. 2023 Jan 3;133(1):e154754.
doi: 10.1172/JCI154754.

Canagliflozin primes antitumor immunity by triggering PD-L1 degradation in endocytic recycling

Affiliations

Canagliflozin primes antitumor immunity by triggering PD-L1 degradation in endocytic recycling

Ling Ding et al. J Clin Invest. .

Abstract

Understanding the regulatory mechanisms of PD-L1 expression in tumors provides key clues for improving immune checkpoint blockade efficacy or developing novel oncoimmunotherapy. Here, we showed that the FDA-approved sodium-glucose cotransporter-2 (SGLT2) inhibitor canagliflozin dramatically suppressed PD-L1 expression and enhanced T cell-mediated cytotoxicity. Mechanistic study revealed that SGLT2 colocalized with PD-L1 at the plasma membrane and recycling endosomes and thereby prevented PD-L1 from proteasome-mediated degradation. Canagliflozin disturbed the physical interaction between SGLT2 and PD-L1 and subsequently allowed the recognition of PD-L1 by Cullin3SPOP E3 ligase, which triggered the ubiquitination and proteasome-mediated degradation of PD-L1. In mouse models and humanized immune-transformation models, either canagliflozin treatment or SGLT2 silencing significantly reduced PD-L1 expression and limited tumor progression - to a level equal to the PD-1 mAb - which was correlated with an increase in the activity of antitumor cytotoxic T cells. Notably, prolonged progression-free survival and overall survival curves were observed in the group of PD-1 mAb-treated patients with non-small cell lung cancer with high expression of SGLT2. Therefore, our study identifies a regulator of cell surface PD-L1, provides a ready-to-use small-molecule drug for PD-L1 degradation, and highlights a potential therapeutic target to overcome immune evasion by tumor cells.

Keywords: Cancer immunotherapy; Immunology.


Figures
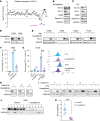
Figure 1
Figure 1. Canagliflozin suppresses PD-L1 expression in vitro and in vivo.
(A) The effect of various small-molecule drugs on PD-L1 expression. H292 cells were treated with a compound library containing 98 small-molecule drugs (approved by the FDA) for 24 hours, followed by Western blot analysis with PD-L1 antibody and quantification using ImageJ grayscale analysis. JQ1 was used as a positive control that significantly downregulated PD-L1 expression. (B and C) Western blots depicting the effect of canagliflozin and JQ1 on regulating different checkpoint protein expression, blots were run in parallel. (D and E) Western blots depicting canagliflozin-downregulated expression of PD-L1 under basal (D) and inducible conditions (E). NSCLC cell lines H292, H460, H1299, H358, H1944 and H1437 were treated with canagliflozin (20 μM) alone or together with IFN-γ (10 ng/mL) for 24 hours, followed by detection of PD-L1 protein level by Western blotting. (F and G) Canagliflozin downregulated the expression of PD-L1 on the cell surface. Cell surface PD-L1 levels were investigated by flow cytometry in H292 (F) and H1299 (G) cells. Data were presented as the mean ± SD of triplicate (H292) or quadruplicate (H1299) experiments. IgG, Isotype control antibody control. (H and I) 7 cases of patient–derived primary NSCLC cancer cells were subjected to Western blotting analysis for PD-L1 expression after treatment with canagliflozin (20 μM) alone or together with IFN-γ (10 ng/mL) for 24 hours. (J and K) H292-implanted NSG mouse model was treated daily with canagliflozin (50 mg/kg body weight, intragastric administration) or vehicle for 1 week. Protein lysates from tumors were analyzed via Western blot and quantified using Image J grayscale analysis. n = 6 mice per experimental group. Blue circles, vehicle group; purple squares, canagliflozin group. Data were analyzed via unpaired 2-tailed Students’ t test. *P < 0.05; **P < 0.01; ***P < 0.001.
Figure 2
Figure 2. Canagliflozin reduces PD-L1 expression through its pharmacological target SGLT2.
(A) Western blots showing that depletion of SGLT2 induced PD-L1 degradation. H1299 cells were treated with siRNAs targeting SGLT2. H292 cells were treated with shRNAs targeting SGLT2 as indicated. (B) Canagliflozin-caused PD-L1 decrease was abolished in the absence of SGLT2. (C) Overexpression of SGLT2 upregulated PD-L1 expression. (D) Depletion of GLUT1 had no effect on PD-L1 expression. H1299 cells were treated with siRNA-GLUT1 and the level of PD-L1 was detected by Western blotting. (E) Canagliflozin did not influence the abundance of glycolytic metabolites, whereas silencing of GLUT1 significantly reduced the abundance of glycolytic metabolites (n = 3). (F) Confocal analysis revealed the colocalization of SGLT2 and PD-L1 proteins in H1299 cells. Scale bar: 5 μm. (G) Interaction of SGLT2 with PD-L1 was detergent-sensitive. SGLT2-GFP and PD-L1-HA were transfected into HEK 293T cells for 24 hours. Cells were then lysed in 1% Digitonin (Dig) or 0.5% Digitonin/ 1% Triton X-100 (Tx) and immunoprecipitated with the anti-HA, followed by analysis using anti-GFP antibody. (H) Canagliflozin disrupted the interaction between SGLT2 and PD-L1. (I) Intracellular domain (aa 548–650) of SGLT2 was responsible for its interaction with PD-L1. (J) Downregulation of PD-L1 caused by canagliflozin was abolished when SGLT2 lost its plasma–membrane targeting region. H292 cells were treated with canagliflozin for 24 hours after transfection with SGLT2-GFP or SGLT2-Δ1-26-GFP. (K) Downregulation of PD-L1 caused by canagliflozin was abolished when the SGLT2 sodium-binding site was mutated. H292 cells were treated with canagliflozin for 24 hours after transfection with SGLT2 or SGLT2-R300A plasmids. Data were presented as the mean ± SD of triplicate experiments. Statistical significance was determined by unpaired 2-tailed Students’ t test. ***P < 0.001.
Figure 3
Figure 3. Canagliflozin inhibits the endocytic recycling of PD-L1.
(A) Canagliflozin significantly attenuated the protein stability of PD-L1. H1299 cells were treated with IFN-γ (10 ng/mL) for 24 hours, then with cycloheximide (10 μg/mL), or cycloheximide (10 μg/mL) plus canagliflozin (20 μM) for the indicated time. (B) Depletion of SGLT2 promoted PD-L1 degradation. H292 cells were treated with siRNA-NC or siRNA-SGLT2 for 24 hours, followed by treatment with cycloheximide for indicated time. (C) Canagliflozin downregulated the expression of PD-L1 on cell surface (n = 3). (D) SGLT2 and PD-L1 colocalized with TFRC and RAB11. H1299 cells were fixed and costained with antibodies against SGLT2, PD-L1, and markers of Golgi (GM130 and TGN46), early endosome (EEA1), late endosome (LAMP1), or recycling endosome (RAB11 and TFRC). Scale bar: 10 μm. (E) Canagliflozin influenced the PD-L1 recycling process (n = 3). (F) Canagliflozin prevented internalized PD-L1 from recycling back to cell membrane. Purple shade represents the 0 minute group, and the orange shade represents 5, 10, and 15 minute groups. Data were presented as the mean ± SD (C and E). Statistical significance was determined by unpaired 2-tailed Students’ t test (C and E) and 1-way ANOVA with Dunnett’s post hoc test (E). *P < 0.05; **P < 0.01. ***P < 0.001.
Figure 4
Figure 4. Canagliflozin induces PD-L1 degradation through the enhanced recognition of PD-L1 by Cullin3SPOP ligase.
(A and B) Canagliflozin degraded PD-L1 through the ubiquitin-proteasome pathway. H1299 cells were treated with canagliflozin with and without MG132 (A) or chloroquine (CQ) (B) for 10 hours. (C) Canagliflozin induced PD-L1 ubiquitination. Left, HEK 293T cells were transfected with indicated plasmids and were treated with canagliflozin and MG132. PD-L1 protein was immunoprecipitated with anti-Flag beads. Right, H1299 cells were treated with canagliflozin and MG132. PD-L1 protein was immunoprecipitated with PD-L1 antibody. (D) Canagliflozin failed to decrease PD-L1 expression upon SPOP silencing. PD-L1 protein expression in H460 cells was analyzed after treatment with canagliflozin in the presence of siRNAs against SPOP or negative control (siRNA-NC), blots were run in parallel. (E) Canagliflozin enhanced the interaction of SPOP and PD-L1. HEK 293T cells were treated with canagliflozin for 24 hours after transfection with SPOP-Flag or PD-L1-HA. The cell lysates were immunoprecipitated with anti-Flag resins. (F) Canagliflozin enhanced the colocalization of SPOP and PD-L1. H292 cells were treated with canagliflozin and the localization of SPOP and PD-L1 were detected by Immunofluorescence. Scale bar: 10 μm. (G) The intracellular domain of PD-L1 (aa 283–290) was responsible for the binding of PD-L1 to SPOP. HEK 293T cells were cotransfected with plasmids as indicated, cell lysates were immunoprecipitated with anti-Flag resins. (H) Downregulation of PD-L1 caused by canagliflozin was abolished upon deletion of the SPOP binding region. H292 cells were first transfected with PD-L1-WT-HA or PD-L1-283-290-HA, and then treated with canagliflozin. (I) SGLT2 bound to the same region of PD-L1 binding to SPOP (aa 283–290). HEK 293T cells were cotransfected with plasmid as indicated. The cell lysates were immunoprecipitated with anti-HA resins. (J and K) SGLT2 regulated the interaction between SPOP and PD-L1. SGLT2 was silenced (J) or overexpressed (K), and the interaction between SPOP and PD-L1 was subsequently determined.
Figure 5
Figure 5. Canagliflozin alone, or combined with CTLA4 blockade, effectively suppressed tumor growth.
(A and B) Tumor growth, weight, and volume of CT26 cells in immunocompetent BALB/c mice treated with canagliflozin, anti-PD-1 mAb, anti-CTLA4 mAb, or a combination of canagliflozin and anti-CTLA4 mAb. n = 6 mice per group. (C) PD-L1 level in extracted tumor tissues was evaluated by FACS, data represent mean ± SD. (D and E) Tumor-infiltrating CD45+CD3+ T cells and CD45+CD8+ T cells were detected by FACS, data represent mean ± SD. (F) FACS analysis of the activity intracellular IFN-γ in leukocytes, data represent mean ± SD. (G and H) CD45+CD3+ T cells and CD45+CD8+ T cells in blood were detected by FACS. Data represent mean ± SD. Data were analyzed by 1-way ANOVA with Dunnett’s post hoc test. *P < 0.05; **P < 0.01; ***P < 0.001; and unpaired 2-tailed Students’ t test #P < 0.05; ##P < 0.01.
Figure 6
Figure 6. Canagliflozin effectively inhibits tumor growth in a PBMC humanized xenograft model.
(A) Scheme representing the experimental procedure. s.c, subcutaneous; qd, 1 a day; i.g., intragastric; IOCV, injection of caudal vein; biw, twice per week. (B) Tumor growth of H292 cells in PBMC humanized NSG mice treated with vehicle, canagliflozin, or anti-PD-1 Ab. n = 7 mice per group. (C) PD-L1 level in extracted tumor cells was evaluated by FACS. (D and E) Tumor-infiltrating CD45+CD3+ T cells and CD45+CD8+ T cells were detected by FACS. (F) Tumor growth of H292 cells in immuno-deficient NSG mice when treated with vehicle, canagliflozin, or anti-PD-1 Ab. n = 6 mice per group. (G) PD-L1 level in extracted tumor cells from immuno-deficient NSG mice was evaluated by FACS. (H and I) shSGLT2 significantly inhibited the tumor growth in the humanized NSG mouse model. H292 cells with or without SGLT2 knocked down were injected into PBMC humanized NSG mice and tumor growth was measured. n = 6 mice per group. (J) The surface level of PD-L1 on tumor cells were evaluated by FACS. (K and L) Tumor infiltrating CD45+CD3+ T cells and CD45+CD8+ T cells were detected by FACS. (M and N) CD45+CD3+ T cells and CD45+CD8+ T cells in blood were detected by FACS. Data represent mean ± SD. Statistical significance was determined by 1-way ANOVA with Dunnett’s post hoc test (BE and G) and unpaired 2-tailed Students’ t test (H and JN). *P < 0.05; **P < 0.01; ***P < 0.001.
Figure 7
Figure 7. Canagliflozin effectively suppresses tumor growth in CD34+ stem cells engrafted into a humanized xenograft model.
(A) Scheme representing the experimental procedure. s.c, subcutaneous; qd, 1 a day; i.g, intragastric; IOCV, injection of caudal vein. (B) In humanized immune-transformed model, H292 cells were injected subcutaneously and treated with vehicle, canagliflozin, or anti-PD-1 Ab. n = 6 mice per group. (C) PD-L1 levels on extracted tumor cells were evaluated by FACS. (D and E) Tumor infiltrating CD45+CD3+ T cells, CD45+CD8+ T cells were detected by FACS, data represent mean ± SD. (F and G) CD45+CD3+ T cells and CD45+CD8+ T cells in blood were detected by FACS. Data represent mean ± SD. Statistical significance was determined by 1-way ANOVA with Dunnett’s post hoc test. *P < 0.05; **P < 0.01; ***P < 0.001.
Figure 8
Figure 8. SGLT2 positively correlated with PD-L1 expression in lung cancer tissues.
(A and B) Patient tissues were stained with SGLT2 and PD-L1. Representative images of IHC staining of SGLT2 and PD-L1 in human lung cancer tissues (n = 100) were shown. Scale bar: 2 mm. The correlation analysis between SGLT2 and PD-L1 was performed, and the P value was calculated by the Pearson correlation test (P < 0.0001, r = 0.70136). –, negative expression; +, low expression; ++, medium expression; +++, high positive expression. (C and D) Kaplan-Meier survival curves of NSCLC patients’ PFS or OS. The low expression category includes those whose positive staining rate is smaller than 50%, whereas the high expression category greater than 50%. The Gehan-Breslow-Wilcoxon test was used to test for the difference between survival curves. (E) Tumor diameter based on the CT imaging was annotated with a red line. Scale bar: 10 cm. (F and G) Kaplan-Meier survival curves of NSCLC patients’ PFS or OS. The Gehan-Breslow-Wilcoxon test was used to test for the difference between survival curves. See also Supplemental Tables 3–5. (H) Diagram of the mechanism of SGLT2 regulating PD-L1.*P < 0.05, **P < 0.01; ***P < 0.001.

Comment in

References

    1. Sanmamed MF, Chen L. A paradigm shift in cancer immunotherapy: from enhancement to normalization. Cell. 2018;175(2):313–326. doi: 10.1016/j.cell.2018.09.035. - DOI - PMC - PubMed
    1. Motzer RJ, et al. Nivolumab versus everolimus in advanced renal-cell carcinoma. N Engl J Med. 2015;373(19):1803–1813. doi: 10.1056/NEJMoa1510665. - DOI - PMC - PubMed
    1. Sharma P, et al. Nivolumab in metastatic urothelial carcinoma after platinum therapy (CheckMate 275): a multicentre, single-arm, phase 2 trial. Lancet Oncol. 2017;18(3):312–322. doi: 10.1016/S1470-2045(17)30065-7. - DOI - PubMed
    1. Woods DM, et al. HDAC inhibition upregulates PD-1 ligands in melanoma and augments immunotherapy with PD-1 blockade. Cancer Immunol Res. 2015;3(12):1375–1385. doi: 10.1158/2326-6066.CIR-15-0077-T. - DOI - PMC - PubMed
    1. Sen T, et al. Targeting DNA damage response promotes antitumor immunity through STING-mediated T-cell activation in small cell lung cancer. Cancer Discov. 2019;9(5):646–661. doi: 10.1158/2159-8290.CD-18-1020. - DOI - PMC - PubMed

Publication types

MeSH terms