. 2023 Feb;10(6):e2205395.
doi: 10.1002/advs.202205395. Epub 2023 Jan 3.

Combined Single-Cell and Spatial Transcriptomics Reveal the Metabolic Evolvement of Breast Cancer during Early Dissemination

Affiliations

Combined Single-Cell and Spatial Transcriptomics Reveal the Metabolic Evolvement of Breast Cancer during Early Dissemination

Yi-Ming Liu et al. Adv Sci (Weinh). 2023 Feb.

Abstract

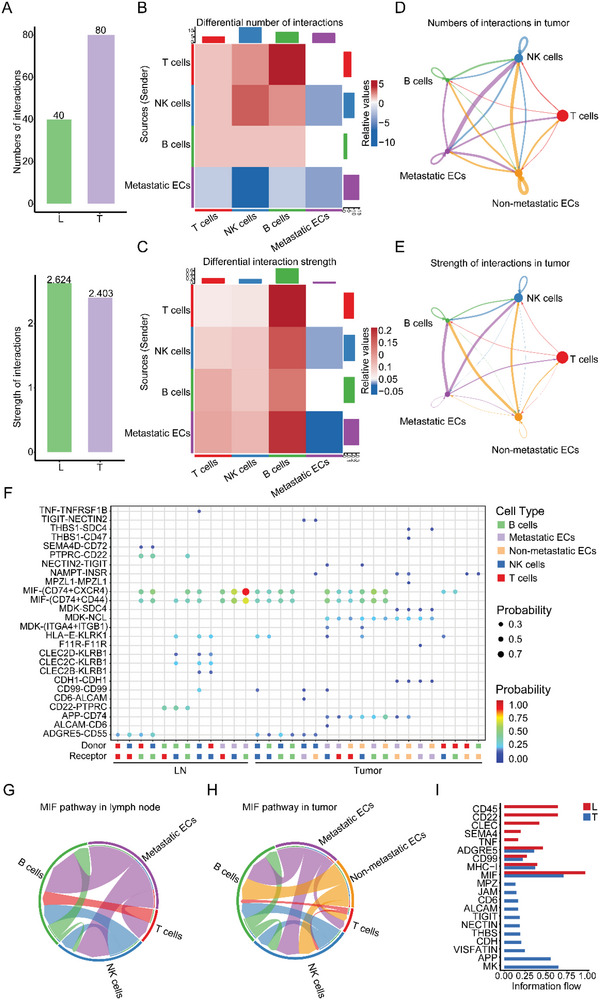
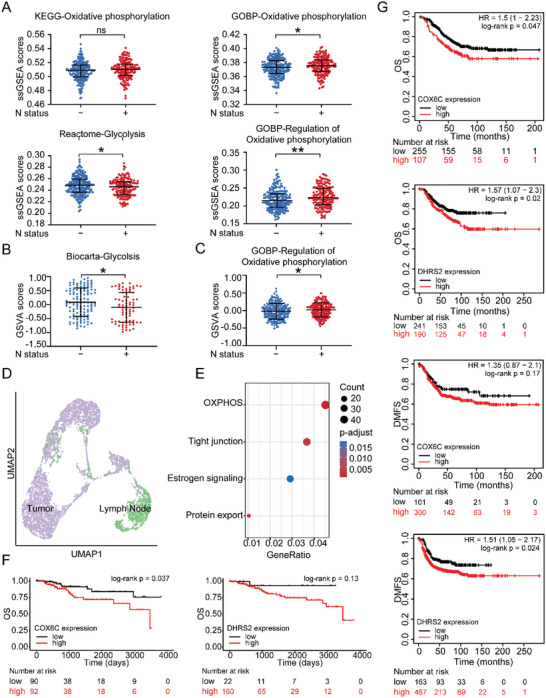
Breast cancer is now the most frequently diagnosed malignancy, and metastasis remains the leading cause of death in breast cancer. However, little is known about the dynamic changes during the evolvement of dissemination. In this study, 65 968 cells from four patients with breast cancer and paired metastatic axillary lymph nodes are profiled using single-cell RNA sequencing (scRNA-seq) and spatial transcriptomics. A disseminated cancer cell cluster with high levels of oxidative phosphorylation (OXPHOS), including the upregulation of cytochrome C oxidase subunit 6C and dehydrogenase/reductase 2, is identified. The transition between glycolysis and OXPHOS when dissemination initiates is noticed. Furthermore, this distinct cell cluster is distributed along the tumor's leading edge. The findings here are verified in three different cohorts of breast cancer patients and an external scRNA-seq dataset, which includes eight patients with breast cancer and paired metastatic axillary lymph nodes. This work describes the dynamic metabolic evolvement of early disseminated breast cancer and reveals a switch between glycolysis and OXPHOS in breast cancer cells as the early event during lymph node metastasis.

Keywords: breast cancer; early dissemination; metabolism; single-cell RNA sequencing; spatial transcriptomics.


Conflict of interest statement

The authors declare no conflict of interest.

Figures

Figure 1
Figure 1
Expression profiling of 65 968 single cells in paired primary breast tumors and metastatic lymph nodes. A) Graphic overview of this study design. Tumor and paired lymph node tissue from four breast cancer patients were processed into single‐cell suspension and unsorted cells were used for scRNA‐seq with 10x Genomics. Tumor slides were processed to obtain by 10x Genomics Visium. The following integrated analysis of cytological experiments and IHC staining is described in squares. B) t‐SNE plots of 65 968 cells from tumor and paired lymph node tissue of four breast cancer patients, showing 15 clusters in each plot. Each cluster is shown in a different color. C) t‐SNE plot of 65 968 cells profiled in the present study colored by major cell types. D) Bubble plots of the marker genes expressed in the major cell types. Dot color reflects expression level and dot size represents the percent of cells expressing marker genes in different cell types. IHC, immunohistochemistry. HE, hematoxylin and eosin. scRNA‐seq, single‐cell RNA sequencing. t‐SNE, t‐distributed stochastic neighbor embedding.
Figure 2
Figure 2
Metastatic epithelial cell characteristics identified by scRNA‐seq. A) t‐SNE plot of 5739 epithelial cells showing 11 clusters. Each cluster is shown in a different color. B) Violin plots of the CNV levels in 11 epithelial cell clusters. C) Potential trajectory of all epithelial cells identified two distinct cell fates colored by cluster. The arrow shows the potential evolutionary direction in the trajectory. D) Bubble plot of hallmarks for DEGs between EDC clusters and other epithelial cell clusters. The intensity represents the adjusted p‐value of each hallmark. Dot size shows gene count for each hallmark. Wilcoxon signed‐rank test was used to assess the difference. E) Heatmap showing selected DEGs (rows) between EDC clusters and other epithelial cell clusters along the pseudo‐time (columns), which was clustered into three profiles. Color key differentially coding from blue to red indicated the relative expression levels from low to high. F) Dot plots of dynamic expression of key genes in glycolysis and OXPHOS and the two pathways themselves based on KEGG database along two cell fates. CNV, copy number variation. DEG, differentially expressed genes. EDC, early‐disseminated cancer cell. KEGG, Kyoto Encyclopedia of Genes and Genomes. OXPHOS, oxidative phosphorylation. Pre‐branch, premalignant‐status branch.
Figure 3
Figure 3
Intercellular ligand–receptor prediction among EDCs and immune cells revealed by CellChat. A) Bar plot showing the number and strength of intercellular interactions in both lymph node and tumor. B,C) Heatmaps of differential number (B) and strength (C) of intercellular interactions between lymph node and tumor. D,E) An overview of cell–cell interactions. Arrow and edge color indicate direction. Circle size is proportional to the number of cells in each cell group. Edge thickness indicates the number (D) and the strength (E) of interaction between populations. The loops indicate cell types. F) Bubble plots of the significant differentially expressed ligand–receptor pairs in the lymph node versus tumor. Dot color reflects communication probabilities, and dot size represents computed p‐values. Each cell group is shown in different color. Empty space means the communication probability is zero. p‐values are computed from a two‐sided permutation test. G,H) Chord diagrams of the inferred MIF signaling networks in lymph node (G) and tumor (H). Arc length represents the number of cells in each cell group and edge width represents the communication probability. I) Bar plots of ranked significant signaling pathways based on differences in the overall information flow within the inferred networks between lymph node and tumor. The top signaling pathways colored red are enriched in lymph node, and these colored blue pathways were enriched in the tumor. EC, epithelial cell. MIF, macrophage migration inhibitory factor.
Figure 4
Figure 4
Leading edge heterogeneity revealed by ST. A) H&E staining of tissue sections (left) and mapped with unbiased clustering of ST spots in 4 tumor samples (right). Each region is surrounded by dotted lines in different color. Scale bar = 500 µm. B) t‐SNE plot of 11 137 ST spots from four primary breast cancer ST data. Each cluster is shown in different color. C) MIA map of overlap between all scRNA‐seq‐identified epithelial cell clusters and ST‐identified spot clusters. Each element in the matrix is computed for all pairs of epithelial cell clusters and spot clusters using the same 728 background genes. Red indicates enrichment (significantly high overlap); blue indicates depletion (significantly low overlap). D) All ST spots of BMS score and the tumor leading edge ST spots of BMS and EMT score in T3 and T4 tissue sections. The intensity represents score of each ST spot. Scale bar = 500 µm. E) Violin spots of BMS score of the tumor inner region and the tumor leading edge in T3, T4, and four samples together. F) Unbiased clustering of ST spots mapped to T3 and T4 tissue sections, respectively (left, middle). BMS score feature plots from T3 and T4 with data generated using the Visium ST platform. The intensity represents max expression of each gene. Scale bar = 500 µm. (right). G) Violin plots of BMS score by ST spots subpopulation in ST data. H) Bar plots of GSVA analysis comparing between leading edge‐associated ST plots and non‐leading edge‐associated ST plots in four primary breast tumor samples. All p‐values were determined using an unpaired two‐sided Wilcoxon rank‐sum test. ns, p ≥ 0.05; *, p < 0.05; **, p < 0.01; ***, p < 0.001; ****, p < 0.0001. BMS, breast metastatic signature. COX6C, cytochrome C Oxidase Subunit 6C. DHRS2, dehydrogenase/Reductase 2. EMT, epithelial–mesenchymal transition. GSVA, Gene set variation analysis. H&E, Hematoxylin and eosin. MIA, multimodal intersection analysis. ST spatial transcriptomics
Figure 5
Figure 5
Downregulation of COX6C and DHRS2 inhibited breast cancer cells proliferation, migration, and EMT. A) Line plots showing significantly lower cell proliferation rates in T‐47D and MDA‐MB‐231 cells after knocking down COX6C and DHRS2. B) Bar plots showing downregulation of COX6C and DHRS2 significantly inhibited cell migration ability of T‐47D and MDA‐MB‐231 cells in trans‐well assay (right). Representative images randomly selected from T‐47D and MDA‐MB‐231 cells are shown (left). Scale bars = 1 mm. C) IHC images of COX6C and DHRS2 expressions in primary tumor with or without lymph node metastasis. Three independent experiments were performed and generated similar results. Scale bar = 100 µm. D) Western blot images showing the EMT signaling pathway was inactivated in shCOX6C and shDHRS2 group, compared with control of MDA‐MB‐231 and 4T1 cells. E) Scatter plots with a significant positive spearman correlation for the expression of COX6C and those of DHRS2. F) Violin spots of EMT score of the high expression and the low expression of COX6C and DHRS2 in epithelial cells. All p‐values in (A) and (B) were determined using an unpaired two‐sided Student's t‐test. All p‐values in (F) were determined using an unpaired two‐sided Wilcoxon rank‐sum test. Data presented as the mean ± SD. of n = 3. ns, p ≥ 0.05; *, p < 0.05; **, p < 0.01; ***, p < 0.001; ****, p < 0.0001. EMT, epithelial–mesenchymal transition. shCOX6C, COX6C knockdown. shDHRS2, DHRS2 knockdown.
Figure 6
Figure 6
Clinical significance of OXPHOS in early disseminated breast cancer. A–C) Dot plots showing significantly higher level of OXPHOS and lower level of glycolysis in N status positive (N1‐3) breast cancer patients than those with N status negative (N0). Patients sequence data were from FUSCC (A), TCGA (B), and METABRIC (C). All p‐values were determined using an unpaired two‐sided Wilcoxon rank‐sum test. D) UMAP plot of 6350 cancer epithelial cells with tissue source. Each tissue source is shown in different color. E) Bubble plot of enriched KEGG pathways of cancer epithelial cell from lymph nodes compared to those from primary tumors. The intensity represents adjusted p‐value of each KEGG pathway. Dot size shows gene count for each KEGG pathway. Wilcoxon signed‐rank test was used to assess the difference. F) Kaplan–Meier curve illustrating higher COX6C and DHRS2 accompanied by poor OS in basal‐like breast cancer patients from TCGA dataset. G) Kaplan–Meier curve illustrating higher COX6C accompanied by poor OS and DMFS in HER2‐positive breast cancer while higher DHRS2 upregulation was associated with poor OS and DMFS in basal‐like breast cancer. Log‐rank test was used to assess the difference. ns, p ≥ 0.05; *, p < 0.05; **, p < 0.01; ***, p < 0.001; **** p < 0.0001. DMFS, distant metastasis‐free survival. GOBP, Gene Ontology Biological Process. KEGG, Kyoto Encyclopedia of Genes and Genomes. OS, overall survival. OXPHOS, oxidative phosphorylation. UMAP, Uniform Manifold Approximation and Projection.

References

    1. Siegel R. L., Miller K. D., Fuchs H. E., Jemal A., CA: Cancer J. Clin. 2021, 71, 7. - PubMed
    1. Shek L. L., Godolphin W., Cancer Res. 1988, 48, 5565. - PubMed
    1. Lawson D. A., Kessenbrock K., Davis R. T., Pervolarakis N., Werb Z., Nat. Cell Biol. 2018, 20, 1349. - PMC - PubMed
    1. Zhang Y., Chen H., Mo H., Hu X., Gao R., Zhao Y., Liu B., Niu L., Sun X., Yu X., Wang Y., Chang Q., Gong T., Guan X., Hu T., Qian T., Xu B., Ma F., Zhang Z., Liu Z., Cancer Cell 2021, 39, 1578. - PubMed
    1. Wagner J., Rapsomaniki M. A., Chevrier S., Anzeneder T., Langwieder C., Dykgers A., Rees M., Ramaswamy A., Muenst S., Soysal S. D., Jacobs A., Windhager J., Silina K., van den Broek M., Dedes K. J., Martinez M. R., Weber W. P., Bodenmiller B., Cell 2019, 177, 1330. - PMC - PubMed

Publication types