. 2023 Apr;531(5):618-638.
doi: 10.1002/cne.25450. Epub 2023 Jan 3.

Neurodegeneration in a novel invertebrate model system: Failed microtubule-mediated cell adhesion and unraveling of macroglia

Affiliations

Neurodegeneration in a novel invertebrate model system: Failed microtubule-mediated cell adhesion and unraveling of macroglia

Ruth Fabian-Fine et al. J Comp Neurol. 2023 Apr.

Abstract

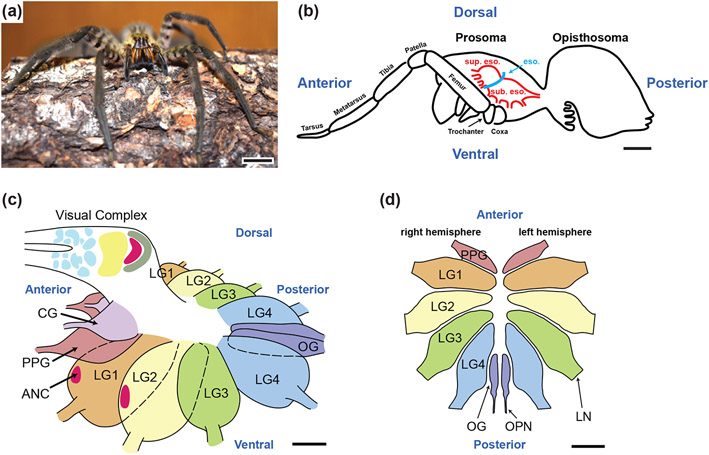
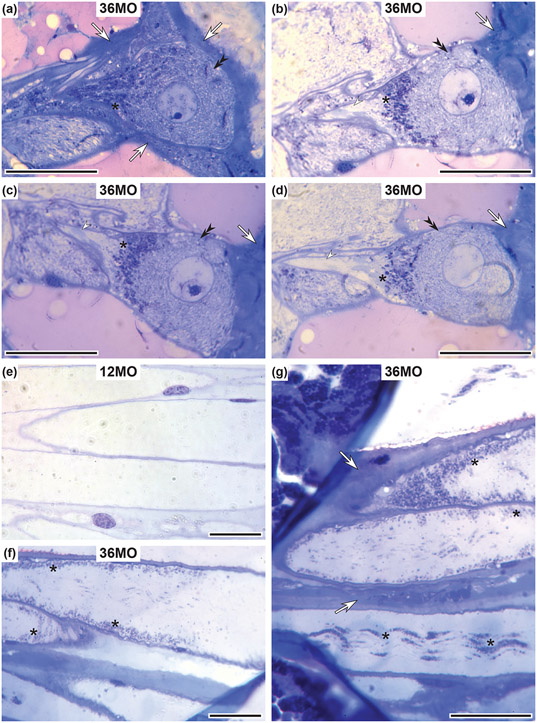
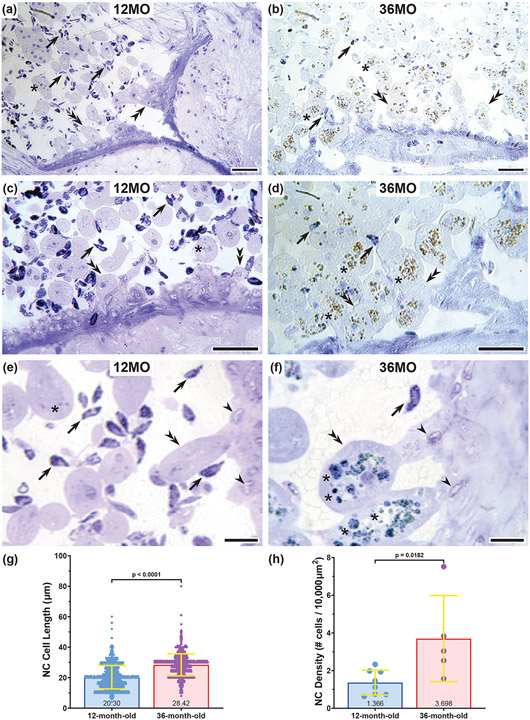
Neurodegenerative diseases are among the main causes of death in the United States, leading to irreversible disintegration of neurons. Despite intense international research efforts, cellular mechanisms that initiate neurodegeneration remain elusive, thus inhibiting the development of effective preventative and early onset medical treatment. To identify underlying cellular mechanisms that initiate neuron degeneration, it is critical to identify histological and cellular hallmarks that can be linked to underlying biochemical processes. Due to the poor tissue preservation of degenerating mammalian brain tissue, our knowledge regarding histopathological hallmarks of early to late degenerative stages is only fragmentary. Here, we introduce a novel model organism to study histological hallmarks of neurodegeneration, the spider Cupiennius salei. We utilized toluidine blue-stained 0.9-μm serial semithin and 50-nm ultrathin sections of young and old spider nervous tissue. Our findings suggest that the initial stages of neurodegeneration in spiders may be triggered by (1) dissociation of neuron- and glia-derived microtubules, and (2) the weakening of microtubule-associated desmosomal junctions that lead to the unraveling of neuron-insulating macroglia, compromising the structural integrity of affected neurons. The involvement of macroglia in the disposal of neuronal debris described here-although different in the proposed transport mechanisms-shows resemblance to the mammalian glymphatic system. We propose that this model system is highly suitable to investigate invertebrate neurodegenerative processes from early onset to scar formation and that this knowledge may be useful for the study of neurodegeneration in mammalian tissue.

Keywords: Cupiennius salei; cell adhesion; desmosomes; macroglia; microtubules.


Conflict of interest statement

CONFLICT OF INTEREST

The authors declare no competing financial interests.

Figures

Figure 1.
Figure 1.
Anatomy and location of the CNS in the Central American wandering spider Cupiennius salei. (a) Adult female; (b) the CNS is located in the prosoma of the animals and consists of the dorsally located supraesophageal ganglion (sup eso) and the ventral subesophageal ganglion (sub eso). The esophagus (eso) transects through the CNS between both complexes (blue line). (c) Schematic drawing of the ganglia. The ventral most areas contain the bilateral leg ganglia for each walking leg pair from anterior (leg pair 1, LG1) to posterior (leg pair 4, LG4). PPG: anterior pedipalpal ganglia that innervate the pedipalps of the animals. OG: Posterior opisthosomal ganglia whose neurons project into the opisthosoma of the animals. CG: Anterior cheliceral ganglia . The visual complex contains neurons of the visual system. ANC: Anterior neuron clusters in LG1 and LG2. (d) Schematic drawing of a cross section through the leg ganglia in the subesophageal ganglion. LN: Leg nerve; OPN: Opisthosomal nerve. Panels b and c adapted from Fabian-Fine et al. (2017); panel d adapted from Fabian-Fine et al. (2015). Scale bars: (a) 10 mm (b) 5 mm (c) 2 mm (d) 500 μm
Figure 2.
Figure 2.
Behavioral signs of neurodegeneration correlate with age-related discoloration of the spider CNS. (a) Young adult spider (12-month-old [12MO]) in a typical vertical head-down resting position. The prosoma aligns in an almost straight line (173°) with the opisthosoma (arrow). The legs are firmly attached to the vertical surface. (b) Old spider (36-month-old [36MO]) with an atypical resting position on a vertical wall. The opisthosoma leans outward following gravitational forces (arrow) forming a 118° angle between the prosoma and opisthosoma. To stabilize her vertical resting position the spider has positioned her leg on the horizontal surface of the bottom of the container. (c) Old spider (36-month) with advanced signs of neurodegeneration. Unlike a young animal that can maintain posture and actively tries to escape, the old animal is unable to sit on a vertical surface at all and has limited control over her leg movement and is largely unresponsive when picked up with forceps. (d) Wholemount preparations of dissected brains of 12- and 36-month-old animals show a normal light beige coloration of the young brain (black arrow) whereas the old brain shows brown discoloration (white arrow). (e) Dense accumulations of brown deposits are observed at the boundaries between central and peripheral neuropil of another animal. Scale bars: (a-c) 10 mm (d-e) 3 mm
Figure 3.
Figure 3.
Toluidine blue-stained cells in the central and peripheral nervous system of C. salei. (a) Neuronal somata (arrows) are surrounded by a darker stained macroglia cell (open arrow) that borders on the neural lamella (arrowhead); double arrowhead: nucleus of the macroglia cell. (b) Mesenchymal cells in the peripheral leg nerves include T-1 microglia (open arrow) with characteristic heterochromatin patch (open diamond in inset) and granulocytes characterized by numerous, blue-stained vesicular inclusions (arrows). Diamonds: formation of a multinucleated syncytium from individual nephrocytes. (c,d) T1-microglia with characteristic heterochromatin patch in scar tissue of an old brain sample (open arrow). Higher zoom in d reveals numerous cytoplasmic inclusions (asterisks). (e) Granulocytes (arrows) of varying sizes and shapes near T-1 microglia (open arrow) and multinucleated cells (diamonds). (f) Nephrocyte (double arrowhead) with numerous debris inclusions (asterisks) and associated T-1 (open arrow) and T2 (arrowheads) microglia. Arrows: Granulocytes. Scale bars: (a-f) 10 μm
Figure 4.
Figure 4.
Toluidine blue-stained cross sections through 12-month-old (a,c) and 36-month-old (b,d,f) spider CNS. (a,b) Leg ganglia of a young spider show predominantly healthy neuronal somata (arrows) and neuropil areas (NP). Open arrows: typical acellular areas on the lateral sides of each leg ganglion; The neural lamella between leg ganglia appears straight (arrowheads). (c,d) Leg ganglia of an old animal show advanced stages of neurodegeneration with pink scar tissue (open arrows) replacing areas of the neuropil (NP) and neuronal somata (arrows). The neural lamella between the leg ganglia appears curved and starts to separate between leg ganglia (arrowheads). Double arrowheads: Macrophage-like mesenchymal cells on the outside of the neural lamella appear more abundant in old compared to young specimens. (e) schematic drawing of the left leg ganglia (LG 1-4) arrangement shown in (a-d). (f) Higher magnification of the neural lamella around the leg ganglia reveals numerous (yellow) debris-containing microchannels (open arrowheads). Debris-containing nephrocytes form on the outside of the neural lamella (double arrowheads). (g) The percentage of scar tissue in the brain of 12-month-old animals (8.37%) is significantly lower compared to 36-month-old tissue (38.64%; t(19)=16.22, p=1.37x10⁻¹², unpaired t-test). Scale bars: (a-d) 150 μm (e) 500 μm (f) 50 μm
Figure 5.
Figure 5.
Toluidine blue-stained, semithin sections of the ventral leg ganglia of 12-month-old spider brain. (a-d) The ganglia are densely packed with intact neuronal somata (arrows). The neuropil contains clearly visible axonal bundles (open arrow). Characteristic large motor neurons are present in the medial areas (large arrows). (e) Higher magnification of the inset in c shows the predominantly smooth and even shape of the neuronal perimeters (open arrowheads) that consist of dark-blue stained macroglia cells and the neuronal membrane (open arrows: axonal profiles). (e,f) Lipofuscin-like granules were present in a subset of somata (asterisks). Scale bars: (a-d) 150 μm (e-f) 50 μm
Figure 6.
Figure 6.
Electron micrographs of macroglia showing glia-derived desmosomes. (a,b) A desmosome connecting a folded glia-cell extension via a triadic desmosome (arrow). Each connected side is in close contact with regularly aligned glia-derived microtubules (arrowheads in a and b; b: zoomed in inset in a). (c) High magnification of a glia-derived desmosome (arrow) bordering on two adjacent neuronal profiles (N1, N2). Regularly aligned microtubules (arrowheads) are clearly visible on both cytoplasmic sides of the desmosome. Debris-laden vesicles and smaller debris particles are visible in the cytoplasm of the macroglia (open arrows). (d) Triadic desmosome in close association with microtubules (small arrowheads) on each of the desmosomal sides. Scale bars: 100 nm
Figure 7.
Figure 7.
Direct comparison between ventral leg ganglia in 12-month-old (a,c,e) and 36-month-old (b,d,f) animals. Young brain tissue is densely packed with neuronal profiles (arrows) and neuropil (NP). The neural lamellae between ganglia appear straight and in close proximity to each other (arrowheads). Old brain tissue contains large areas of scar tissue (open arrows) and the neural lamellae between ganglia appear curved (arrowheads) starting to separate in the lateral areas (asterisk in b). A buildup of dark stained material was observed adjacent to the neural lamellae (double arrowheads in b). (f) Debris particles were observed being channeled through scar tissue toward the neural lamella (thin arrows). Scale bars: (a-f) 150 μm
Figure 8.
Figure 8.
Advanced degeneration in 36-month-old leg ganglia. (a) Lateral neuropil area shows hollow nerve fibers (open arrowheads) and the wide-spread replacement of neuronal tissue with scar tissue (open arrows). (b) fragmentation of both cell membranes (arrows) and neuronal nuclei (diamonds) in a granule-cell ganglion. Open arrows: scar tissue. (c,d) Glia cells and cell membranes around neuronal somata become thin and appear zig-zag-shaped (arrows). (e) Hypertrophic macroglia cell profiles in the cheliceral ganglia become stained with dark materials in older animals. The neuronal cytoplasm becomes increasingly unstructured, and neurons start to appear hollow (asterisks). (c-e) Open arrows: macroglia; arrowheads: neural lamella. (f) schematic drawing indicating the brain areas of a-d from which the images were obtained (insets). Scale bars: (a) 25 μm (b-e) 10 μm
Figure 9.
Figure 9.
Degeneration of axonal profiles. (a-d) Longitudinal serial sections through a neuron show accumulation of debris particles (asterisks) and loss of cytoplasmic structure (open arrowheads) in the axon initial segment. Surrounding glia cells accumulate dark-blue matter (open arrows) adjacent to the neural lamella. The cytoplasm of the neuronal soma and nucleus still look comparatively intact (double arrowheads). (e) Axonal profiles of large motor neurons in young animals reveals relatively straight glia cell membrane outlines. (f,g) Cross section through old animal axonal profiles show the accumulation of debris (asterisks) and dark-blue matter (open arrows) in the surrounding glia cells. Scale bars: (a-g) 25 μm
Figure 10.
Figure 10.
Intra- and extracellular transport of debris in degenerating neuronal profiles. (a) Degenerated neuronal profiles are gradually replaced by scar tissue (open arrows). Extracellular debris particles (asterisks) were observed in channels leading through the scar tissue. (b) Debris was also observed intracellularly in microglia cells that were particularly abundant in neuropil at the boundaries between central and peripheral nervous system (asterisks, inset). Scale bars: (a-b) 10 μm
Figure 11.
Figure 11.
Longitudinal sections through leg nerves at the boundary between central (CNS) and peripheral nervous system (PNS) in young (a,b) and old (c-f) brain tissue. (a,b) The leg nerves projecting through the neural lamella in young brain tissue appear straight and contain little debris and microglia cells. Diamonds: glia cell nuclei. (c,d) In old brain tissue, the nerves contain numerous microglia (arrowheads) and granulocytes (open arrows). Hypertrophic macroglia (arrows) and debris particles are abundant in old leg nerves. (e) Higher magnification of old leg nerves shows numerous microglia and granulocytes (arrows). (f) Pockets containing large numbers of granulocytes (arrows) were observed inside the CNS close to the areas where the leg nerves project out of (efferent neurons) or into (afferent neurons) the CNS. Scale bars: (a,c) 500 μm (b,d) 50 μm (e-f) 25 μm
Figure 12.
Figure 12.
Macrophage-like mesenchymal nephrocytes (NC) in 12-month-old (a,c,e) and 36-month-old brain tissue (b,d,f). (a-f) The NC in both young and old tissue form on the outside of the neural lamella (double arrowheads in a-f). In young tissue, individual NC contain few debris particles (asterisks in a-f) compared to NC in old brain tissue. Numerous microglia and granulocytes were observed between NC in young tissue (arrows in a-f). In contrast, few mesenchymal microglia and granulocytes were observed between NC in old tissue. Areas where NC emerged from the neural lamella contained openings of microchannels (arrowheads in e,f). (g) The average cell length of NC is significantly smaller in young tissue (20.3 μm) compared to old tissue (28.4 μm; t(2519) = 26.88, p=3.92x10−140, unpaired t-test). (h) The number of NC per 10,000 μm2 (100 x 100 μm) squares was significantly lower in young compared to old tissue (1.366 and 3.698 respectively; t(11) = 2.77, p=0.018, unpaired t-test). Scale bars: (a-d) 150 μm (e-f) 50 μm
Figure 13.
Figure 13.
In both young (a) and old (b,c,d) tissue, nephrocytes fuse forming a network of multinucleated cells (double arrowheads). (d) Two nephrocytes (double arrowheads) fuse with a multinucleated cell. The fusing nephrocytes contain dark-blue stained debris, whereas the multinucleated cell is void of debris. Diamonds: nuclei in the multinucleated cell. Scale bars: (a-c) 50 μm (d) 25 μm
Figure 14.
Figure 14.
Schematic drawing summarizing our hypothesis of degenerative processes observed in spider nervous tissue. (a) Neurons (green [N1] and red [N2]) are surrounded by a macroglia (blue [MG]) that borders on the neural lamella (beige). Glia projections are folded and connected via microtubule-associated desmosomes (open arrowheads). In healthy tissue, neuronal debris (asterisks) is taken up by macroglia and transported to the neural lamella where it is released and exits the brain through transecting microchannels (arrowheads). The debris is taken up by nephrocytes (double arrowheads [NC]) that form on the outside of the neural lamella and fuse into multinucleated cells (MNC). Numerous granulocytes (arrows) were observed between and on nephrocytes and MNC’s (b) Dissociation of neuron-derived microtubules lead to the disruption of axonal transport along axonal processes, Golgi fragmentation, and the accumulation of trans-Golgi vesicles at the axon hillock and irregular shape of the axonal boundaries. The dissociation of glia-derived microtubules leads to the destabilization of microtubule associated desmosomes (open arrowheads) and leads to the unraveling of the glial extensions. The resulting destabilization of the neuron and activation of the unraveled macroglia result in the leakage of neuronal cytoplasm that is taken up by macroglia and removed from the brain in a similar fashion described in panel a. Adjacent neurons are similarly affected as they both border on the same glia cell thus causing a penumbra effect that leads to the degeneration of entire neuron groups. Figure not drawn to scale.

References

    1. Ahmadzadeh K, Vanoppen M, Rose CD, Matthys P, & Wouters CH (2022). Multinucleated Giant Cells: Current Insights in Phenotype, Biological Activities, and Mechanism of Formation. Frontiers in cell and developmental biology, 10, 873226. doi:10.3389/fcell.2022.873226 - DOI - PMC - PubMed
    1. Andersen JV, Markussen KH, Jakobsen E, Schousboe A, Waagepetersen HS, Rosenberg PA, & Aldana BI (2021). Glutamate metabolism and recycling at the excitatory synapse in health and neurodegeneration. Neuropharmacology, 196, 108719. doi:10.1016/j.neuropharm.2021.108719 - DOI - PubMed
    1. Babu KS, & Barth FG (1984). Neuroanatomy of the central nervous system of the wandering spider, Cupiennius salei (Arachnida, Araneida). Zoomorphology, 104(6), 344–359. doi:10.1007/BF00312185 - DOI
    1. Bak LK, Schousboe A, & Waagepetersen HS (2006). The glutamate/GABA-glutamine cycle: aspects of transport, neurotransmitter homeostasis and ammonia transfer. Journal of Neurochemistry, 98(3), 641. doi:10.1111/j.1471-4159.2006.03913.x - DOI - PubMed
    1. Bellouze S, Baillat G, Buttigieg D, de la Grange P, Rabouille C, & Haase G (2016). Stathmin 1/2-triggered microtubule loss mediates Golgi fragmentation in mutant SOD1 motor neurons. Molecular Neurodegeneration, 11(1), 43. doi:10.1186/s13024-016-0111-6 - DOI - PMC - PubMed

Publication types