

doi: 10.1182/bloodadvances.2022008303.
Preclinical studies targeting CD74 with STRO-001 antibody-drug conjugate in acute leukemia
Affiliations
- PMID: 36595452
- PMCID: PMC10182275
- DOI: 10.1182/bloodadvances.2022008303
Item in Clipboard
Preclinical studies targeting CD74 with STRO-001 antibody-drug conjugate in acute leukemia
Blood Adv.
.
No abstract available
Conflict of interest statement
Figures
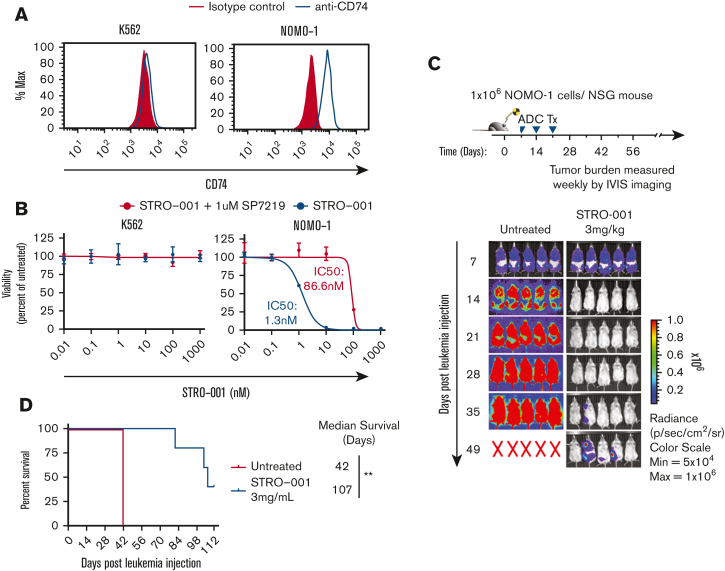
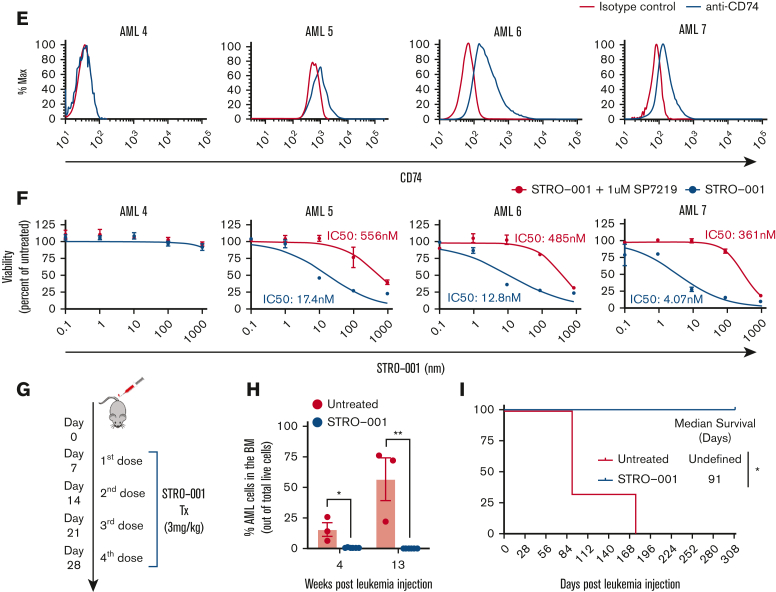
STRO-001 therapy demonstrates preclinical efficacy against CD74 expressing NOMO-1 AML cell line and primary AML cells. (A) Flow cytometric analysis of CD74 cell surface expression on K562 and NOMO-1 cell lines. (B) In vitro cytotoxicity of STRO-001 against K562 and NOMO-1 cells. Cells were treated with increasing doses of STRO-001 alone (blue) or excess of naked antibody SP7219 (1 uM, red). After 3 days of continuous exposure, viability was assessed by Cell Titer-Glo assay. Data are normalized to untreated controls. Error bars denote standard deviation from 2 technical replicates at each dose. Experiments were repeated at least twice (supplemental Figure 5). (C) Top, experimental schema evaluating STRO-001 in vivo efficacy in NOMO-1 xenograft model. Bottom, leukemia burden measured by bioluminescence (IVIS) imaging in NOMO-1 xenograft mice untreated (left) or treated with STRO-001 at 3 mg/kg weekly for 3 weeks (right). Shown are representative timepoints. N = 5 mice per group. X denotes death. (D) Kaplan-Meier survival curves of NOMO-1 xenografts untreated or treated with STRO-001. N = 5 per group. Statistical differences in survival were evaluated using Log-rank Mantel-Cox. (E) Flow cytometric analysis of CD74- (AML-4) and CD74+ AML patient specimens (AML-5-7). (F) In vitro cytotoxicity of STRO-001 primary AML specimens. Cells were treated as described above. Error bars denote standard deviation from 3 technical replicates at each dose. (G) Experimental design to assess in vivo activity of STRO-001 against a PDX model transplanted with a primary AML sample, AML-7. Peripheral blood was obtained every other week following the last dose of STRO-001, bone marrow aspirate was obtained 4 and 13 weeks after transplant. (H) Percent AML cells in the bone marrow at indicated weeks following leukemia injection determined by flow cytometry. (I) Kaplan-Meier survival curves of PDX mice untreated (n = 3) or treated with STRO-001 (n = 3). Statistical differences in survival were evaluated using Log-rank Mantel-Cox.
STRO-001 therapy demonstrates preclinical efficacy against CD74 expressing NOMO-1 AML cell line and primary AML cells. (A) Flow cytometric analysis of CD74 cell surface expression on K562 and NOMO-1 cell lines. (B) In vitro cytotoxicity of STRO-001 against K562 and NOMO-1 cells. Cells were treated with increasing doses of STRO-001 alone (blue) or excess of naked antibody SP7219 (1 uM, red). After 3 days of continuous exposure, viability was assessed by Cell Titer-Glo assay. Data are normalized to untreated controls. Error bars denote standard deviation from 2 technical replicates at each dose. Experiments were repeated at least twice (supplemental Figure 5). (C) Top, experimental schema evaluating STRO-001 in vivo efficacy in NOMO-1 xenograft model. Bottom, leukemia burden measured by bioluminescence (IVIS) imaging in NOMO-1 xenograft mice untreated (left) or treated with STRO-001 at 3 mg/kg weekly for 3 weeks (right). Shown are representative timepoints. N = 5 mice per group. X denotes death. (D) Kaplan-Meier survival curves of NOMO-1 xenografts untreated or treated with STRO-001. N = 5 per group. Statistical differences in survival were evaluated using Log-rank Mantel-Cox. (E) Flow cytometric analysis of CD74- (AML-4) and CD74+ AML patient specimens (AML-5-7). (F) In vitro cytotoxicity of STRO-001 primary AML specimens. Cells were treated as described above. Error bars denote standard deviation from 3 technical replicates at each dose. (G) Experimental design to assess in vivo activity of STRO-001 against a PDX model transplanted with a primary AML sample, AML-7. Peripheral blood was obtained every other week following the last dose of STRO-001, bone marrow aspirate was obtained 4 and 13 weeks after transplant. (H) Percent AML cells in the bone marrow at indicated weeks following leukemia injection determined by flow cytometry. (I) Kaplan-Meier survival curves of PDX mice untreated (n = 3) or treated with STRO-001 (n = 3). Statistical differences in survival were evaluated using Log-rank Mantel-Cox.
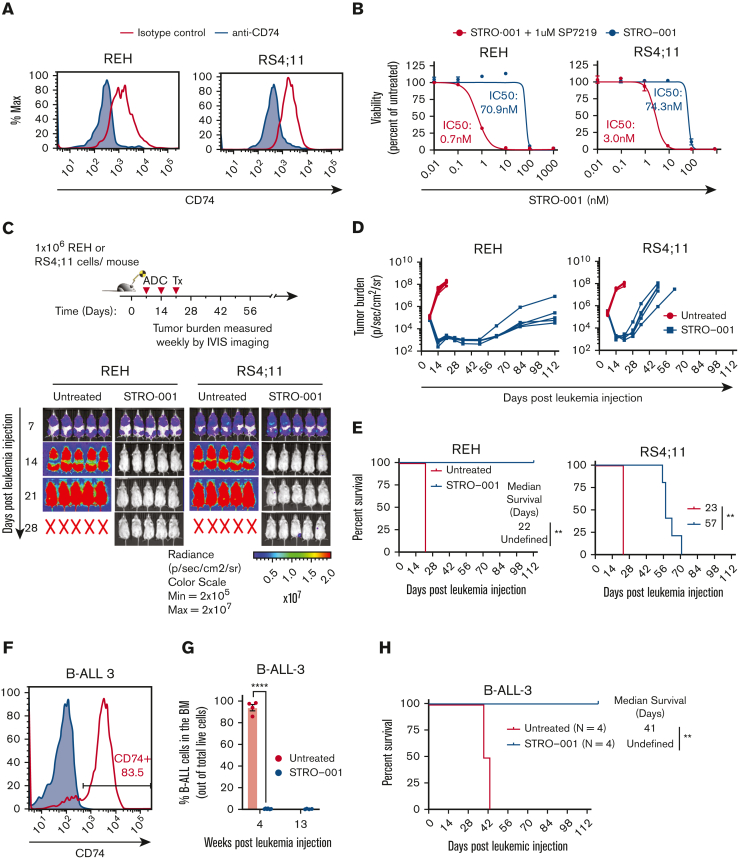
STRO-001 therapy demonstrates preclinical efficacy against CD74-positive B-ALL cell lines and primary B-ALL. (A) Flow cytometric analysis of CD74 cell surface expression on REH and RS4;11 B-ALL cell lines. (B) In vitro cytotoxicity of STRO-001 against REH and RS4;11 cells. Experiments were repeated twice (supplemental Figure 4). Data are normalized to untreated controls. Error bars denote standard deviation from 2 or 3 technical replicates at each dose. (C) Top, experimental schema evaluating STRO-001 in vivo efficacy in REH and RS4;11 xenograft models. Bottom, representative images of leukemia burden detected by IVIS imaging in REH and RS4;11 xenograft mice untreated or treated with STRO-001 at 3 mg/kg weekly for 3 weeks. N = 5 mice per group. X indicates death. (D) Quantification of radiance shown in C. N = 5 mice per group. (E) Kaplan-Meier survival curves of REH and RS4;11 xenograft mice untreated or treated with STRO-001. N = 5 per group. Statistical differences in survival were assessed by Log-rank Mantel-Cox test. (F) Flow cytometric analysis of CD74 expression in patient specimen B-ALL-3. (G) Percent B-ALL-3 cells (huCD19+) in the bone marrow at indicated weeks following leukemia injection (H) Kaplan-Meier survival curves of PDX B-ALL-3 mice untreated or treated with STRO-001. Data are presented as mean +/− SEM. Statistical differences were determined by unpaired, 2-tailed Student t test. Details of the B-ALL-3 PDX studies (8.5e6 cells/mouse; n = 4 for untreated group, n = 7 for STRO-001-treated group).
References
-
- Cohen S, Shachar I. Cytokines as regulators of proliferation and survival of healthy and malignant peripheral B cells. Cytokine. 2012;60(1):13–22. - PubMed
-
- Gore Y, Starlets D, Maharshak N, et al. Macrophage migration inhibitory factor induces b cell survival by activation of a CD74-CD44 receptor complex∗. J Biol Chem. 2008;283(5):2784–2792. - PubMed
-
- Matza D, Wolstein O, Dikstein R, Shachar I. Invariant chain induces B cell maturation by activating a TAF(II)105-NF-kappaB-dependent transcription program. J Biological Chem. 2001;276(29):27203–27206. - PubMed
-
- Starlets D, Gore Y, Binsky I, et al. Cell-surface CD74 initiates a signaling cascade leading to cell proliferation and survival. Blood. 2006;107(12):4807–4816. - PubMed
Publication types
MeSH terms
Substances
LinkOut - more resources
Full Text Sources
Medical
