. 2023 Jan 3;19(1):e1010816.
doi: 10.1371/journal.pcbi.1010816. eCollection 2023 Jan.

Neutral vs. non-neutral genetic footprints of Plasmodium falciparum multiclonal infections

Affiliations

Neutral vs. non-neutral genetic footprints of Plasmodium falciparum multiclonal infections

Frédéric Labbé et al. PLoS Comput Biol. .

Abstract

At a time when effective tools for monitoring malaria control and eradication efforts are crucial, the increasing availability of molecular data motivates their application to epidemiology. The multiplicity of infection (MOI), defined as the number of genetically distinct parasite strains co-infecting a host, is one key epidemiological parameter for evaluating malaria interventions. Estimating MOI remains a challenge for high-transmission settings where individuals typically carry multiple co-occurring infections. Several quantitative approaches have been developed to estimate MOI, including two cost-effective ones relying on molecular data: i) THE REAL McCOIL method is based on putatively neutral single nucleotide polymorphism loci, and ii) the varcoding method is a fingerprinting approach that relies on the diversity and limited repertoire overlap of the var multigene family encoding the major Plasmodium falciparum blood-stage antigen PfEMP1 and is therefore under selection. In this study, we assess the robustness of the MOI estimates generated with these two approaches by simulating P. falciparum malaria dynamics under three transmission conditions using an extension of a previously developed stochastic agent-based model. We demonstrate that these approaches are complementary and best considered across distinct transmission intensities. While varcoding can underestimate MOI, it allows robust estimation, especially under high transmission where repertoire overlap is extremely limited from frequency-dependent selection. In contrast, THE REAL McCOIL often considerably overestimates MOI, but still provides reasonable estimates for low and moderate transmission. Regardless of transmission intensity, results for THE REAL McCOIL indicate that an inaccurate tail at high MOI values is generated, and that at high transmission, an apparently reasonable estimated MOI distribution can arise from some degree of compensation between overestimation and underestimation. As many countries pursue malaria elimination targets, defining the most suitable approach to estimate MOI based on sample size and local transmission intensity is highly recommended for monitoring the impact of intervention programs.


Conflict of interest statement

The authors have declared that no competing interests exist.

Figures

Fig 1
Fig 1. Multiplicity of infection (MOI).
For each category, the horizontal central solid line represents the median, the diamond represents the mean, the box represents the interquartile range (IQR) from the 25th to 75th centiles, the whiskers indicate the most extreme data point, which is no more than 1.5 times the interquartile range from the box, and the dots show the outliers, i.e., the points beyond the whiskers. The upper, middle, and lower row panels show correspond to simulations under low-, moderate-, and high-transmission settings, respectively (S1 and S2 Tables). A) Accuracy of MOI estimates, defined as the difference between estimated and true MOI per host. While null values highlight accurate MOI estimates (indicated by a dashed black horizontal line), the positive and negative values highlight over- and under-estimation, respectively. Estimates with the neutral SNP-based approach (THE REAL McCOIL) are indicated in green, and those with the var gene-based approach (varcoding) are indicated in blue. The dark and light green or blue colors indicate respectively MOI estimations made without and with a measurement model (Fig 2). The column panels show differences for specific true MOI values. B) Population distribution of the estimated and true MOI per host from the simulated “true” values and those estimated with the methods indicated by the colors similar to panel A. For high transmission, the distribution obtained with THE REAL McCOIL shows a more pronounced tail than that from the simulated infections, with a secondary peak around MOI = 14. Note that the method considerably over-estimates individual MOI below that value but then under-estimates above it (panel A). Thus, these opposite trends compensate each other to some extent in the population distribution, producing nevertheless a deviation at high values. The varcoding method provides a good representation of the “true” distribution from the simulations, and of the individual values in general, with a consistent tendency to underestimate when sampling error is taken into account.
Fig 2
Fig 2. Measurement models.
A) and B) Schematic diagrams of the SNP and var measurement models for a host infected by one (MOI = 1) or two (MOI = 2) genetically distinct P. falciparum strains, respectively. To account for potential SNP genotyping failures, we randomly replaced the host genotypes with missing data (X). This replacement was implemented by using the distribution illustrated in panel C. When MOI is high, the frequency of double allele calls (DACs) is also high (Figs 3 and S3). To account for var gene potential sequencing errors, we sub-sampled the number of var genes per repertoire. This sub-sampling was implemented by using the distribution illustrated in panel D. For simplicity, the var repertoire in these two examples only consists of 10 var genes despite each migrant parasite genome consists of a repertoire of 45 var genes in the simulations (S1 Table). C) Histogram of the proportion of missing SNP loci per host haplotype from a panel of 24 bi-allelic SNP loci. The genotypes were previously obtained from monoclonal infections sampled during one cross-sectional survey made in 2015 in the Bongo District, in northern Ghana. The purple curves show the best curves that fit the data using the adjusted R-squared. D) Histogram of the number of non-upsA (i.e., upsB and upsC) DBLα var gene types per repertoire. The molecular sequences were previously sequenced from monoclonal infections, i.e., hosts infected by a single P. falciparum strain (MOI = 1), sampled during six cross-sectional surveys made from 2012 to 2016 in the Bongo District, in northern Ghana.
Fig 3
Fig 3. Proportion of SNP calls (genotypes) per host SNP haplotype.
A) Single major allele calls; B) Double allele calls (DACs); C) Single minor allele calls; D) Missing allele calls. Each SNP call proportion was calculated using the low-, moderate-, and high-transmission setting simulations (S1 and S2 Tables). The column panels show the proportions for specific true MOI values. The dark and light green colors indicate the proportion of calls made without and with a measurement model, respectively (Fig 2). For each category, the horizontal central solid line represents the median, the diamond represents the mean, the box represents the interquartile range (IQR) from the 25th to 75th centiles, the whiskers indicate the most extreme data point, which is no more than 1.5 times the interquartile range from the box, and the dots show the outliers, i.e., the points beyond the whiskers.
Fig 4
Fig 4. Population structure using network properties.
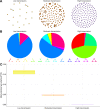
Comparisons of repertoire similarity networks of 150 randomly sampled parasite var repertoires generated from a one-time point under low-, moderate-, and high-transmission settings (i.e., one replicate of runs 1, 25, and 49, respectively; S1 and S2 Tables). Only the top 1% of edges are drawn and used in the analysis. A) Similarity networks where nodes are var repertoires, weighted edges encode the degree of overlap between the var genes contained in these repertoires, and the direction of an edge indicates the asymmetric competition between repertoires. B) Distributions of the average proportion of occurrences of three-node graph motifs across the repertoire similarity networks. C) Distribution of the mean pairwise type sharing (PTS) between var repertoires. For each category, the horizontal central solid line represents the median, the diamond represents the mean, the box represents the interquartile range (IQR) from the 25th to 75th centiles, the whiskers indicate the most extreme data point, which is no more than 1.5 times the interquartile range from the box, and the dots show the outliers, i.e., the points beyond the whiskers.

References

    1. World Health Organization. World malaria report 2021. World Health Organization; 2021.
    1. Kolakovich KA, Ssengoba A, Wojcik K, Tsuboi T, Al-Yaman F, Alpers M, et al.. Plasmodium vivax:favored gene frequencies of the merozoite surface protein-1 and the multiplicity of infection in a malaria endemic region. Experimental Parasitology. 1996;83: 11–18. doi: 10.1006/expr.1996.0044 - DOI - PubMed
    1. Conway DJ, Roper C, Oduola AMJ, Arnot DE, Kremsner PG, Grobusch MP, et al.. High recombination rate in natural populations of Plasmodium falciparum. Proceedings of the National Academy of Sciences. 1999;96: 4506–4511. doi: 10.1073/pnas.96.8.4506 - DOI - PMC - PubMed
    1. Konaté L, Zwetyenga J, Rogier C, Bischoff E, Fontenille D, Tall A, et al.. 5. Variation of Plasmodium falciparum msp1 block 2 and msp2 allele prevalence and of infection complexity in two neighbouring Senegalese villages with different transmission conditions. Transactions of The Royal Society of Tropical Medicine and Hygiene. 1999;93: 21–28. doi: 10.1016/S0035-9203(99)90323-1 - DOI - PubMed
    1. Anderson TJC, Haubold B, Williams JT, Estrada-Franco§ JG, Richardson L, Mollinedo R, et al.. Microsatellite markers reveal a spectrum of population structures in the malaria parasite Plasmodium falciparum. Molecular Biology and Evolution. 2000;17: 1467–1482. doi: 10.1093/oxfordjournals.molbev.a026247 - DOI - PubMed

Publication types