. 2023 Jan 10;120(2):e2206480120.
doi: 10.1073/pnas.2206480120. Epub 2023 Jan 3.

The Maresin 1-LGR6 axis decreases respiratory syncytial virus-induced lung inflammation

Affiliations

The Maresin 1-LGR6 axis decreases respiratory syncytial virus-induced lung inflammation

Nandini Krishnamoorthy et al. Proc Natl Acad Sci U S A. .

Abstract

The resolution of infection is an active process with specific molecular and cellular mechanisms that temper inflammation and enhance pathogen clearance. Here, the specialized pro-resolving mediator (SPM) Maresin 1 (MaR1) inhibited respiratory syncytial virus (RSV)-induced inflammation. inlerleukin-13 production from type 2 innate lymphoid cells (ILC) and CD4 T helper type 2 cells was decreased by exogenous MaR1. In addition, MaR1 increased amphiregulin production and decreased RSV viral transcripts to promote resolution. MaR1 also promoted interferon-β production in mouse lung tissues and also in pediatric lung slices. MaR1 significantly inhibited the RSV-triggered aberrant inflammatory phenotype in FoxP3-expressing Tregs. The receptor for MaR1, leucine-rich repeat-containing G protein-coupled receptor 6 (LGR6), was constitutively expressed on Tregs. Following RSV infection, mice lacking Lgr6 had exacerbated type 2 immune responses with an increased viral burden and blunted responses to MaR1. Together, these findings have uncovered a multi-pronged protective signaling axis for MaR1-Lgr6, improving Tregs's suppressive function and upregulating host antiviral genes resulting in decreased viral burden and pathogen-mediated inflammation, ultimately promoting restoration of airway mucosal homeostasis.

Keywords: CD4 T helper type 2 cells; innate lymphoid cells; regulatory T cells; resolution of inflammation; specialized pro-resolving mediators.


Conflict of interest statement

The authors declare competing interest. The authors have patent filings to disclose. B.D.L. is an inventor on patents (resolvins) assigned to Brigham and Women's Hospital (BWH). His interests were reviewed and are managed by the BWH according to conflict of interest policies. The other authors have no conflicts of interest to declare.

Figures

Fig. 1.
Fig. 1.
Maresin 1 enhances viral clearance and decreases type 2 inflammation after RSV infection. (A) Schema of the mouse model of RSV infection with clinical strain RSV line 19 (105 PFU/mouse, intranasal route, i.n.) in 3-wk old Balb/c ByJ mice. Vehicle or MaR1 (10 ng/mouse) administered i.n. on day 3 pi. Inflammatory and virological parameters analyzed on day 6 pi. (B) Representative lung tissue sections from mice 6 d post-mock infection (mock) or RSV infection with either i.n. vehicle (Veh) or MaR1 administered on day 3 pi (MaR1). Sections were stained with PAS. Original magnification (×10). Inset magnification (×20). Arrows indicate areas of high mucous production. (C) gob5 expression analysis by qRT-PCR. Fold increase was calculated over mock infected mice. (D) IL-13 levels in lung tissue measured by Enzyme-linked immunosorbent assay (ELISA). (E) Number of IL-13+ Lineage ILC2 and IL-13+ CD4+ TH2 cells in the lungs with or without MaR1 exposure after RSV as measured by flow cytometry. (F) AREG levels in lung tissue with or without MaR1 exposure after RSV as measured by ELISA. (G) RSV L Gene expression analysis by qRT-PCR. Fold increase was calculated over mock infected mice. Values represent the mean ± SD. *P < 0.05, **P < 0.01, ***P < 0.001 and data were analyzed using Student’s t test for all the panels shown here. This experiment was performed more than twice and the results from two experiments pooled. Each experiment used 3 to 4 mice per group.
Fig. 2.
Fig. 2.
Maresin 1 promotes resolution of RSV infection with increased AREG production and decreased type 2 inflammation. (A) Schema of the mouse model of RSV infection as in Fig. 1A. Inflammatory and virological parameters analyzed on day 10 pi. (B) Representative lung tissue sections from mice 10 d post-mock infection (mock) or RSV infection with either i.n. vehicle (Veh) or MaR1 administered on day 3 pi (MaR1). Sections were stained with PAS. Original magnification (×10). Inset magnification (×20). Arrows indicate areas of high mucous production. (C) gob5 expression analysis by qRT-PCR Fold increase was calculated over mock infected mice. (D) IL-13 levels in lung tissue measured by ELISA. (E) Number of IL-13+ Lineage ILC2 and IL-13+ CD4+ TH2 cells in the lungs with or without MaR1 exposure after RSV as measured by flow cytometry. (F) AREG levels in lung tissue with or without MaR1 exposure after RSV as measured by ELISA. (G) RSV L gene expression analysis by qRT-PCR. Fold increase was calculated over mock infected mice. n≥3 mice per group. Values represent the mean ± SD. *P < 0.05, **P < 0.01, ***P < 0.001 and data were analyzed using Student’s t test for all the panels shown here. This experiment was performed more than twice and the results from two experiments pooled. Each experiment used 3 to 4 mice per group.
Fig. 3.
Fig. 3.
Unique anti-viral lung gene transcripts and increased Interferon-β production following MaR1 administration. (A) Heat map showing fold change of gene transcripts in animals after MaR1 administration over Vehicle control. The gene expression was normalized to β-actin. The Left panel represents mice at day 4 pi and the Right panel represents mice at day 6 pi. For each time point 2 mice were used per group on two individual plates. The RNA was not pooled. The numbers in the heat map indicate the fold change of MaR-1-treated animals over Vehicle control. (B) Interferon-β concentration measured in ling tissue at day 4 pi as measured by legend plex ELISA. (C) Interferon-β concentration in ling tissue at day 6 pi as measured by legend plex ELISA. Values represent the mean ± SD and the data was analyzed using one-way ANOVA with Tukey's multiple comparisons test. *P < 0.05. For each group 3 to 4 mice were used per group per experiment. The experiments were performed twice.
Fig. 4.
Fig. 4.
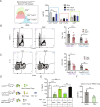
Regulatory T cells express LGR6 and MaR1 regulates their phenotype and function during RSV infection. (A) Lgr6 expression on T cell subsets from mock infected FoxP3eGFP mice. The Left panel shows the histogram, and the Right panel compares MFI of Lrg6 expression following Mock or RSV infection days 6 and 10 pi. (B) The expression of FoxP3 and GATA-3 within the CD4 population in lungs of RSV infected mice with or without MaR1 at day 6 pi as analyzed by flow cytometry and the quantification of cells. Values represent the mean ± SD. The data was analyzed using two-way ANOVA with Sidak's multiple comparisons test. *P < 0.05, ***P < 0.001. (C) The expression of FoxP3 and IL-13 within the CD4 population in lungs of RSV infected mice with or without MaR1 at day 6 pi as analyzed by flow cytometry and the quantification of cells. Values represent the mean ± SD. The data was analyzed using two-way ANOVA with Sidak's multiple comparisons test. *P < 0.05. (D) ILC2-Treg suppression was set from the different FoxP3eGFP mice cohorts. ILC population were sorted from RSV-infected lungs day 6 pi and Tregs from mock and RSV-infected lungs day 6 pi ± MaR1 exposure were added to ILC2 (1:10 ratio). (E) IL-13 production was measured by ELISA 72 h after co-culture. Values represent the mean ± SD and the data was analyzed using one-way ANOVA with Tukey's multiple comparisons test. *P < 0.05, **P < 0.01, ***P < 0.001. The mouse experiments were performed twice and the data from the two experiments pooled. Each experiment used 3 to 4 mice per group. (F) Tregs were profiled from three healthy donors and the expression of LGR6 was analyzed by flow cytometry and expressed as MFI. The data was analyzed using Student’s t test and NS.
Fig. 5.
Fig. 5.
Lgr6 deficient mice have exacerbated type 2 immune responses and higher viral load. 3-wk-old Lgr6+/+ and Lgr6−/− mice were infected with RSV line 19 and euthanized on day 6 pi. (A) PAS staining of lung sections. (B) gob5 expression analysis by qRT-PCR. Fold increase was calculated over naïve Lgr6+/+ and Lgr6−/− mice. Values represent the mean ± SD. *P < 0.05 using Student’s t test. (C) IL-13 levels in lung tissue of Lgr6+/+ and Lgr6−/− measured by ELISA. Values represent the mean ± SD. *P < 0.05 using Student’s t test. (D) Number of IL-13+ Lineage ILC2 and IL-13+ CD4+ TH2 cells in the lungs of Lgr6+/+ and Lgr6−/- mice with or without MaR1 ex vivo exposure as measured by flow cytometry. One-way ANOVA with Tukey's multiple comparisons test was performed. Values represent the mean ± SD. *P < 0.05, **P < 0.01. (E) Number of CD4 TH2 cells (FoxP3 GATA-3+) and type 2 Tregs (FoxP3+ GATA-3+) in Lgr6+/+ and Lgr6−/− mice as measured by flow cytometry. Error bars indicate mean ± SD. The data were analyzed by two-way ANOVA with Sidak’s multiple comparison test. *P < 0.05. (F) RSV L gene expression analysis by qRT-PCR. Fold increase was calculated over naïve Lgr6+/+ and Lgr6−/− mice. The data was analyzed using Student’s t test and was NS. (G) In vitro generation of Tregs from naïve CD4 T cells isolated from spleens of Lgr6+/+ and Lgr6−/− mice. The cells were analyzed for FoxP3 induction by flow cytometry after 4 d in culture with the addition of TGF-β, MaR1, or in combination. (H) The production of AREG from cell culture supernatants from Lgr6+/+ and Lgr6−/− mice was measured by ELISA after the addition of TGF-β, MaR1, or in combination. This experiment was performed twice. Error bar indicate mean ± SD. The data for panels G and H were analyzed by two-way ANOVA with Sidak’s multiple comparison test. *< 0.05, ***P<0.001.
Fig. 6.
Fig. 6.
MaR1 regulates RSV-induced inflammatory responses in hPCLSs. Human pediatric lung slices were infected with RSV ± MaR1. MaR1 was added to lung slices 24 h prior to infection. Seventy-two hours after the treatment, the following analyses were performed: (A) Phase contrast microscopy (airways indicated by red asterisk). (B) IL-13 and AREG protein levels in cell culture supernatant were measured by ELISA. The data were analyzed by two-way ANOVA with Sidak’s multiple comparison test. ***P<0.001, ****P<0.0001. (C) Interferon-β in cell culture supernatant were measured by legend plex ELISA. This experiment was performed using three pediatric donors. The data were analyzed by one-way ANOVA with Tukey’s multiple comparison test. *P<0.05.

References

    1. Nair H., et al. , Global burden of acute lower respiratory infections due to respiratory syncytial virus in young children: A systematic review and meta-analysis. Lancet 375, 1545–1555 (2010). - PMC - PubMed
    1. Empey K. M., Peebles R. S. Jr., Kolls J. K., Pharmacologic advances in the treatment and prevention of respiratory syncytial virus. Clin. Infect. Dis. 50, 1258–1267 (2010). - PMC - PubMed
    1. Coultas J. A., Smyth R., Openshaw P. J., Respiratory syncytial virus (RSV): A scourge from infancy to old age. Thorax 74, 986–993 (2019). - PubMed
    1. Ramaswamy M., Groskreutz D. J., Look D. C., Recognizing the importance of respiratory syncytial virus in chronic obstructive pulmonary disease. COPD 6, 64–75 (2009). - PubMed
    1. Linden D., et al. , Respiratory viral infection: A potential “missing link” in the pathogenesis of COPD. Eur. Respir Rev. 28, 180063 (2019). - PMC - PubMed

Publication types

Substances