Meta-Analysis
. 2023 Jan 10;120(2):e2201886120.
doi: 10.1073/pnas.2201886120. Epub 2023 Jan 3.

The productive performance of intercropping

Affiliations
Meta-Analysis

The productive performance of intercropping

Chunjie Li et al. Proc Natl Acad Sci U S A. .

Abstract

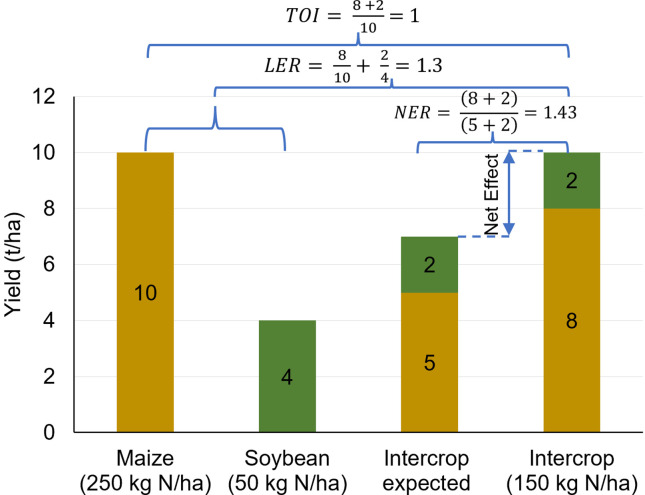
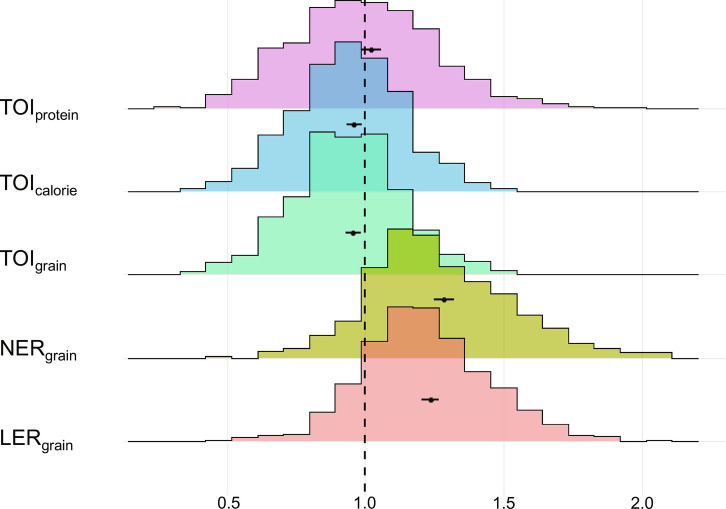
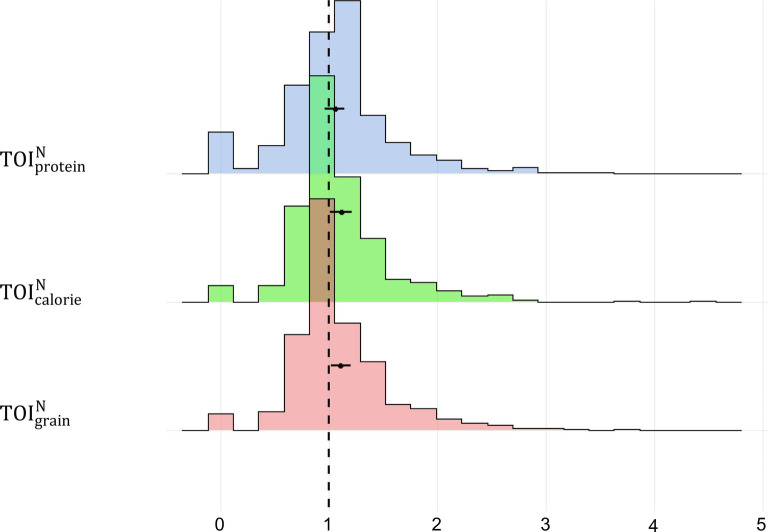
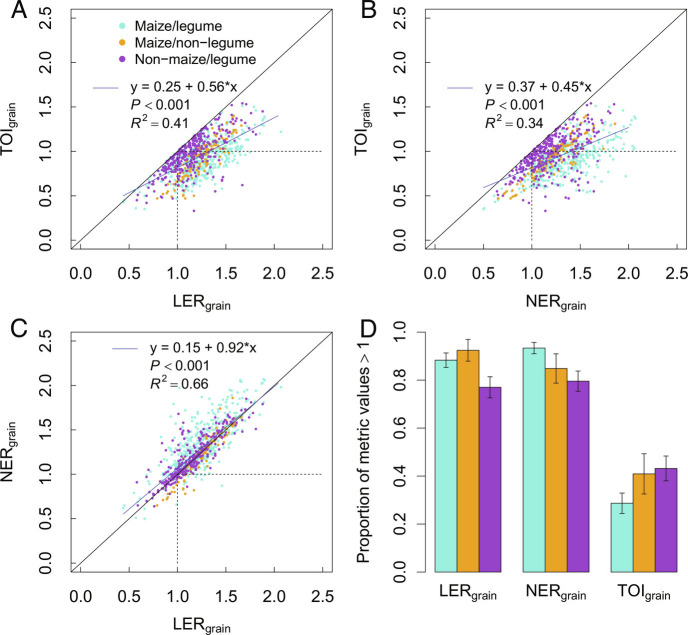
Crop diversification has been put forward as a way to reduce the environmental impact of agriculture without penalizing its productivity. In this context, intercropping, the planned combination of two or more crop species in one field, is a promising practice. On an average, intercropping saves land compared with the component sole crops, but it remains unclear whether intercropping produces a higher yield than the most productive single crop per unit area, i.e., whether intercropping achieves transgressive overyielding. Here, we quantified the performance of intercropping for the production of grain, calories, and protein in a global meta-analysis of several production indices. The results show that intercrops outperform sole crops when the objective is to achieve a diversity of crop products on a given land area. However, when intercropping is evaluated for its ability to produce raw products without concern for diversity, intercrops on average generate a small loss in grain or calorie yield compared with the most productive sole crop (-4%) but achieve similar or higher protein yield, especially with maize/legume combinations grown at moderate N supply. Overall, although intercropping does not achieve transgressive overyielding on average, our results show that intercropping performs well in producing a diverse set of crop products and performs almost similar to the most productive component sole crop to produce raw products, while improving crop resilience, enhancing ecosystem services, and improving nutrient use efficiency. Our study, therefore, confirms the great interest of intercropping for the development of a more sustainable agricultural production, supporting diversified diets.

Keywords: food security; intercropping; land-use efficiency; productivity; transgressive overyielding.


Conflict of interest statement

The authors declare no competing interest.

Figures

None
Graphical illustration of the calculation of different metrics. The yields in sole crops and intercrop are shown as orange bars (maize) and green bars (soybean).
Fig. 1.
Fig. 1.
Values of metrics for assessing the productive performance of intercropping. LER, NER, and TOI based on grain yield (LERgrain, NERgrain, TOIgrain), and TOI based on calorie yield (TOIcalorie) and protein yield (TOIprotein). Histograms show the distribution of the data for each metric. The small black points and error bars represent the mean metric values and their 95% CIs. The vertical dashed line at 1.0 represents the reference value for the index if intercropping is equivalent in production efficiency to sole crops.
Fig. 2.
Fig. 2.
Values of N fertilizer TOI (i.e., TOIN). N fertilizer TOI for grain yield (TOIgrainN), calorie yield (TOIcalorieN), and protein yield (TOIproteinN). These indices express the extent to which the PFP of N fertilizer on intercrop grain yield, calories, or protein exceeds that of the sole crop species with the highest grain yield, calorie yield, or protein yield, respectively. The small black points and error bars represent the mean metric values and their 95% CIs. The vertical dashed line at 1 represents the reference value for the index if intercropping is equivalent in production efficiency to sole crops.
Fig. 3.
Fig. 3.
Bivariate scatter plots illustrating relationships between LER, NER, and TOI (AC) and proportions of data records with performance metrics larger than one for three types of species combinations in intercropping (D). Metric values are based on grain yield in maize/legume (turquoise), maize/nonlegume (orange), and nonmaize/legume intercrops (purple). A 1:1 line is shown in panels AC for reference. The horizontal lines represent TOI = 1 or NER = 1, and the vertical lines represent NER = 1 or LER = 1. Blue lines in panels AC are regressions fitted using linear models based on data of the three types of species combinations. Bars in panel D represent the proportions of data records with metric values larger than one and their approximate 95% CIs, calculated as p±1.96×p(1-p)n, where P is the observed proportion of data records with the metric value greater than one, and n is the number of observations.
Fig. 4.
Fig. 4.
Probability of a TOI larger than one (TOI > 1) as a function of the ratio of the grain yields (A) or protein yields of the sole crops (B) and value of TOI in response to N fertilizer input (C and D). Metric values are based on grain yield in maize/legume (turquoise), maize/nonlegume (orange), and nonmaize/legume intercrops (purple). Yield ratio is defined as the ratio of the sole crop yield of the lowest yielding species to the sole crop yield of the highest yielding species. A yield ratio of one indicates that the two sole crop yields are equal. The dashed lines in panels (A and B) represent a probability of TOI > 1 equal to 0.5, and the dashed lines in panels (C and D) represent TOI = 1.
Fig. 5.
Fig. 5.
Lines indicating TOI = 1 (i.e., on the verge of transgressive overyielding) as a function of pLER1 of a high yielding species (y-axis) and pLER2 of a low yielding species (x-axis). If the sum of pLER1 and pLER2 is greater than the limit indicated by the drawn line, the intercrop will show transgressive overyielding. Different lines are characterized by different values of the yield ratio of species 1 and 2 and greater pLERs are required to reach transgressive overyielding if  R =M2M1 is smaller. When the sole crop yields are equal (R = 1), transgressive overyielding is achieved if LER > 1. However, the condition LER > 1 is not sufficient to achieve transgressive overyielding when one of the two sole crop species has a lower yield than the other, which is generally the case.

References

    1. Godfray H. C. J., et al. , Food security: The challenge of feeding 9 billion people. Science 327, 812–818 (2010). - PubMed
    1. Tilman D., Balzer C., Hill J., Befort B. L., Global food demand and the sustainable intensification of agriculture. Proc. Natl. Acad. Sci. U.S.A. 108, 20260 (2011). - PMC - PubMed
    1. Khoury C. K., et al. , Increasing homogeneity in global food supplies and the implications for food security. Proc. Natl. Acad. Sci. U.S.A. 111, 4001–4006 (2014). - PMC - PubMed
    1. Dempewolf H., Bordoni P., Rieseberg L. H., Engels J. M. M., Food security: Crop species diversity. Science 328, 169–170 (2010). - PubMed
    1. Acevedo M., et al. , A scoping review of adoption of climate-resilient crops by small-scale producers in low- and middle-income countries. Nat. Plants 6, 1231–1241 (2020). - PMC - PubMed

Publication types

LinkOut - more resources