. 2023 Jan 10;120(2):e2214634120.
doi: 10.1073/pnas.2214634120. Epub 2023 Jan 3.

Anatomically interpretable deep learning of brain age captures domain-specific cognitive impairment

Affiliations

Anatomically interpretable deep learning of brain age captures domain-specific cognitive impairment

Chenzhong Yin et al. Proc Natl Acad Sci U S A. .

Abstract

The gap between chronological age (CA) and biological brain age, as estimated from magnetic resonance images (MRIs), reflects how individual patterns of neuroanatomic aging deviate from their typical trajectories. MRI-derived brain age (BA) estimates are often obtained using deep learning models that may perform relatively poorly on new data or that lack neuroanatomic interpretability. This study introduces a convolutional neural network (CNN) to estimate BA after training on the MRIs of 4,681 cognitively normal (CN) participants and testing on 1,170 CN participants from an independent sample. BA estimation errors are notably lower than those of previous studies. At both individual and cohort levels, the CNN provides detailed anatomic maps of brain aging patterns that reveal sex dimorphisms and neurocognitive trajectories in adults with mild cognitive impairment (MCI, N = 351) and Alzheimer's disease (AD, N = 359). In individuals with MCI (54% of whom were diagnosed with dementia within 10.9 y from MRI acquisition), BA is significantly better than CA in capturing dementia symptom severity, functional disability, and executive function. Profiles of sex dimorphism and lateralization in brain aging also map onto patterns of neuroanatomic change that reflect cognitive decline. Significant associations between BA and neurocognitive measures suggest that the proposed framework can map, systematically, the relationship between aging-related neuroanatomy changes in CN individuals and in participants with MCI or AD. Early identification of such neuroanatomy changes can help to screen individuals according to their AD risk.

Keywords: Alzheimer’s disease; brain age; cognitive impairment; deep learning.


Conflict of interest statement

The authors have research support to disclose, P.M.T. discloses research grant support from Biogen, Inc. for work unrelated to this study.

Figures

Fig. 1.
Fig. 1.
Overview of BA estimation by an interpretable 3D-CNN. (A) Proportions of participants in the aggregate dataset (ADNI, UKBB, CamCAN, and HCP), where each human symbol represents ∼300 participants. (B) T1 -weighted MRIs were skull-stripped and 3D saliency probability maps were generated from 3D-CNN output for each subject. (C) Prior to BA estimation using the 3D-CNN, participants were split by sex and assigned randomly into training and test sets. MAE was used to evaluate 3D-CNN performance from BA estimation results for test sets. The test set’s CA histogram is displayed in an inset. (D) The 3D-CNN’s input consists of T1 -weighted MRIs, and its output are BA estimates. Saliency maps are extracted from 3D-CNN output after training. A dropout rate of 0.3 is used in all dropout layers, and a ReLU activation function is used in all convolutional and dense layers. x i is the feature map for input i and w i is its weight. (E) Sample sizes for participants with neurocognitive measures.
Fig. 2.
Fig. 2.
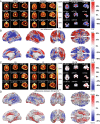
Comparison of brain saliency maps across sexes and diagnoses. (A) Sex-specific mean saliency maps (P M , P F ) and the sex dimorphism map Δ P = (P M  − P F )/[(P F  + P M )/2] of CN participants. In all cases, canonical cortical views (sagittal, axial, and coronal) are displayed in radiological convention. Higher saliencies (brighter regions) indicate neuroanatomic locations whose voxels contribute more to BA estimation. Regions drawn in red have higher saliencies in males (P M  >  P F ); the reverse (P F  >  P M ) is true for the regions drawn in blue. (B) Canonical views of the sex dimorphism map Δ P for CN participants. Sex-specific deviations of Δ P from its mean across sexes are expressed as percentages of the mean. Red indicates that Δ P M  >  Δ P F , i.e., males have higher saliency; blue indicates the reverse (Δ P F  >  Δ P M ), i.e., females have higher saliency. (C) Like (A), for the comparison between CN participants and participants with CI, where Δ P = (P C I  − P C N )/P C N ; red indicates P C I  >  P C N , blue indicates P C N  >  P C I . (D) Like (B), for the saliency difference Δ P between CN and CI participants. Images are displayed in radiological orientation convention (the right hand side of the reader is the left hand side of the participant and vice versa).
Fig. 3.
Fig. 3.
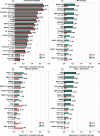
Correlations between neurocognitive measures and both estimated BA and CA. Results are depicted for two independent test sets: CamCAN and ADNI. (A) displays CN participants from CamCAN, (B) displays CN participants from ADNI, (C) displays results only for participants with MCI, and (D) displays results for participants with either MCI or AD. For each independent test set, the sample size for each neurocognitive measure is listed below the measure name. Bar charts depict Spearman’s correlations r S (along x) between BA (green) or CA (red) and each neurocognitive measure (along y). Bars are contoured in black if r S is significant. Error bar widths equate to one SE of the mean. For each neurocognitive measure, the corresponding bar pair is annotated with Fisher’s z statistic. Asterisks indicate neurocognitive measures for which the difference in Spearman’s correlations r S (B A)−r S (C A) is significant.
Fig. 4.
Fig. 4.
Radar plots of sex-specific MAEs and performance parameters. Radar plots of MAE, R 2, and performance parameters (average ET and the number of trainable parameters) according to sex and diagnostic status (CN: UKBB, CamCAN; MCI or AD: ADNI). The SFCN of Gong et al. (20, 21) (purple) is compared to our 3D-CNN (blue). To facilitate simultaneous comparison, all values are normalized to range from 0 to 1, where the maximum value in each measurement was rescaled as 1 and 0 remained as 0.

References

    1. Amgalan A., et al. , Brain age estimation reveals older adults’ accelerated senescence after traumatic brain injury. GeroScience pages 1–17 (2022). - PMC - PubMed
    1. Lopez-Otin C., Blasco M. A., Partridge L., Serrano M., Kroemer G., The hallmarks of aging. Cell 153 , 1194–1217 (2013). - PMC - PubMed
    1. Irimia A., Torgerson C. M., Matthew Goh S.-Y., Van Horn J. D., Statistical estimation of physiological brain age as a descriptor of senescence rate during adulthood. Brain Imaging Behav. 9 , 678–689 (2015). - PMC - PubMed
    1. Beheshti I., Nugent S., Potvin O., Duchesne S., Bias-adjustment in neuroimaging-based brain age frameworks: A robust scheme. NeuroImage: Clin. 24 , 102063 (2019). - PMC - PubMed
    1. Cole J. H., et al. , Brain age predicts mortality. Mol. Psychiatry 23 , 1385–1392 (2018a). - PMC - PubMed

Publication types