. 2023 Jan 10;120(2):e2206324120.
doi: 10.1073/pnas.2206324120. Epub 2023 Jan 3.

Dystrophin myonuclear domain restoration governs treatment efficacy in dystrophic muscle

Affiliations

Dystrophin myonuclear domain restoration governs treatment efficacy in dystrophic muscle

Adrien Morin et al. Proc Natl Acad Sci U S A. .

Abstract

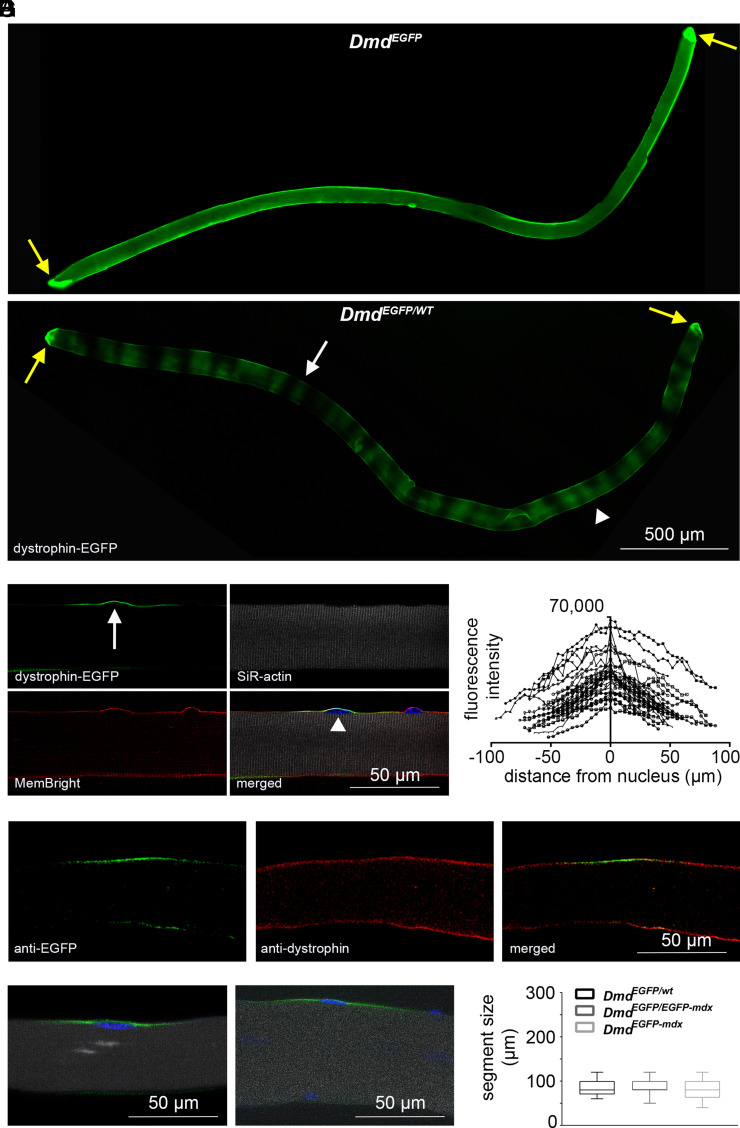
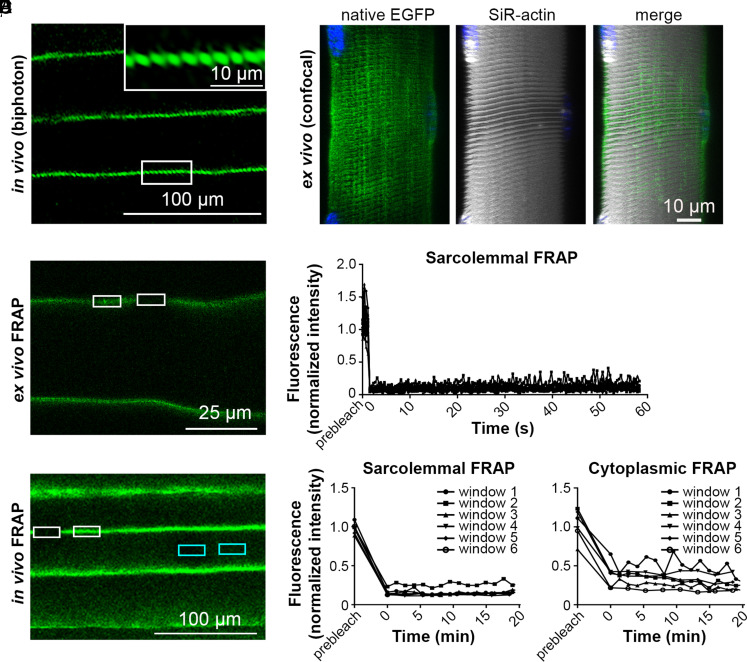
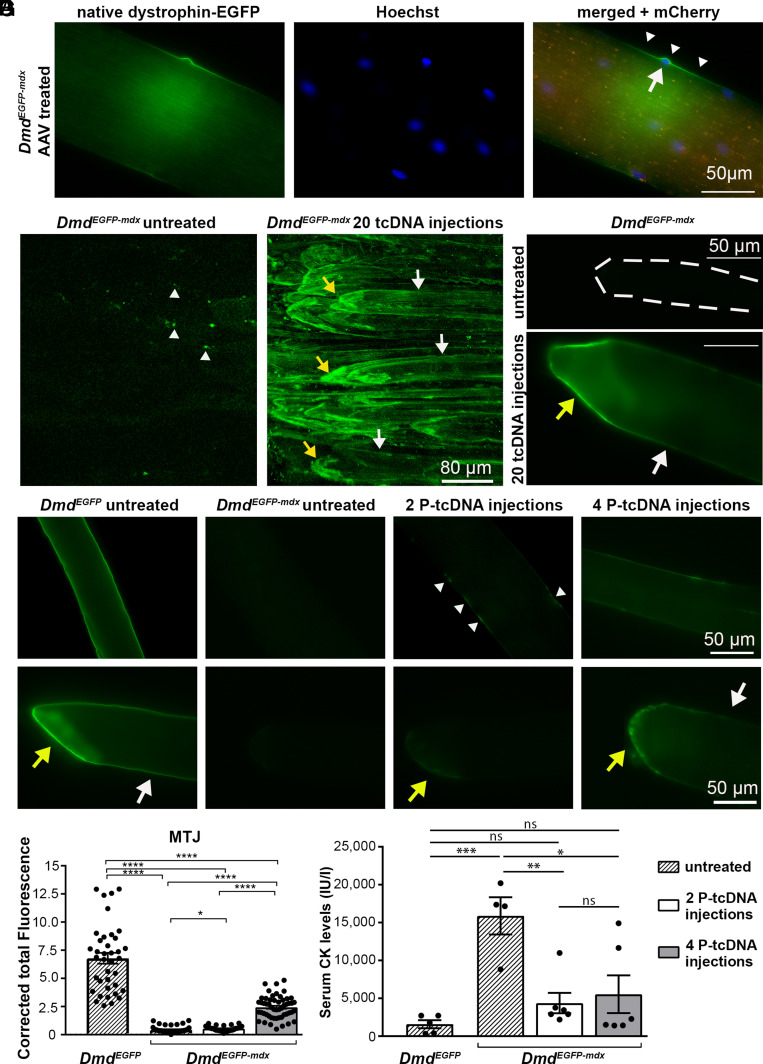
Dystrophin is essential for muscle health: its sarcolemmal absence causes the fatal, X-linked condition, Duchenne muscular dystrophy (DMD). However, its normal, spatial organization remains poorly understood, which hinders the interpretation of efficacy of its therapeutic restoration. Using female reporter mice heterozygous for fluorescently tagged dystrophin (DmdEGFP), we here reveal that dystrophin distribution is unexpectedly compartmentalized, being restricted to myonuclear-defined sarcolemmal territories extending ~80 µm, which we called "basal sarcolemmal dystrophin units (BSDUs)." These territories were further specialized at myotendinous junctions, where both Dmd transcripts and dystrophin protein were enriched. Genome-level correction in X-linked muscular dystrophy mice via CRISPR/Cas9 gene editing restored a mosaic of separated dystrophin domains, whereas transcript-level Dmd correction, following treatment with tricyclo-DNA antisense oligonucleotides, restored dystrophin initially at junctions before extending along the entire fiber-with levels ~2% sufficient to moderate the dystrophic process. We conclude that widespread restoration of fiber dystrophin is likely critical for therapeutic success in DMD, perhaps most importantly, at muscle-tendon junctions.

Keywords: dystrophin-EGFP; mdx mouse; myotendinous junction; nuclear domain.


Conflict of interest statement

The authors declare no competing interest.

Figures

Fig. 1.
Fig. 1.
Organization of dystrophin in basal sarcolemmal units. Live imaging of single fibers freshly isolated from EDL muscles except for the fiber in D. (A) Epifluorescence microscopy of DmdEGFPand DmdEGFP/WT fibers. Example of a small dystrophin-EGFP-positive segment (white arrow). Example of a larger segment with varying dystrophin levels (white arrowhead). Yellow arrows point to MTJs. (B) Confocal microscopy of a DmdEGFP/WTmyofiber section. Native dystrophin-EGFP (green), SiR-actin (gray), MemBright (red), Hoechst (blue). BSDU (arrow). Central nucleus (arrowhead). (C) Quantification of fluorescence intensities of BSDUs from DmdEGFP/WT mice (n = 30 segments of fibers from 3 mice). (D) Confocal microscopy of a DmdEGFP/WTmyofiber section after immunocytochemistry using anti-EGFP (green) and anti-dystrophin (DYS2, red) antibodies. (E and F) Confocal microscopy of a DmdEGFP/EGFP-mdx myofiber section (E) and DmdEGFP-mdx myofiber section (F). Native dystrophin-EGFP (green), SiR-actin (gray), Hoechst (blue). (G) The length of BSDUs was measured in myofibers from DmdEGFP/WT mice (n = 35 myofibers), DmdEGFP/EGFP-mdx mice (n = 114 myofibers), and DmdEGFP-mdxmice (n = 86 myofibers). Data are presented as Whisker–Tukey boxplots. Boxes indicate interquartile ranges (IQR), whiskers indicate (1.5 × IQR).
Fig. 2.
Fig. 2.
Compartmentalization of dystrophin at the MTJ. (A) In vivo multiphoton intravital microscopy of the TA muscle of DmdEGFP mouse. Left image shows native dystrophin-EGFP. MTJ (white arrows). The Right image shows dystrophin-EGFP together with second harmonic generation (SHG) to highlight the collagen fibrils of the tendon (yellow asterisks). (B) In situ confocal microscopy shows TA muscles from DmdEGFP mice. Dystrophin-EGFP (green), SiR-actin (red), SHG (gray). SiR-actin at MTJ level (white arrows). Tendon (yellow asterisk). (C and D) Ex vivo epifluorescence microscopy shows live single myofibers freshly isolated from EDL muscles of DmdEGFP mice (C) and DmdEGFP-mdxmice (D). MemBright accumulated at the MTJ in the presence (white arrow) or absence (white arrowheads) of dystrophin-EGFP. A small MTJ segment from the DmdEGFP-mdxmice expressed revertant dystrophin-EGFP (yellow arrow) (E) Confocal microscopy of an isolated EDL fiber from wild-type mice after RNA-FISH to detect Dmd transcripts. The tip of the fiber appears on the left side. 5′-Dmd probe (green) and DAPI-stained nuclei (blue). Nascent transcripts are detected with the 5′-Dmd probe and appear as large intranuclear foci (white arrowheads), while smaller sarcoplasmic foci concentrate mostly at the fiber tip (yellow arrows).
Fig. 3.
Fig. 3.
Sarcolemmal dystrophin is organized in a costameric pattern and lacks lateral mobility. (A) In vivo multiphoton microscopy of hindlimb muscle of DmdEGFP mice revealed a costameric pattern of dystrophin-EGFP. The Inset shows the sarcolemma in higher magnification. (B) Three dimensional reconstruction of ex vivo confocal microscopy of live EDL fibers from heterozygous DmdEGFP-mdx/EGFP mice. Dystrophin-EGFP (in green) and SiR-actin (gray). (C) Ex vivo confocal microscopy of live single fibers and (E) in vivo confocal microscopy of hindlimb muscle after photobleaching of selected regions with a high-intensity laser pulse. Rectangles show ROIs where EGFP fluorescence intensity was measured for sarcolemmal (white) and cytoplasmic (cyan) EGFP in bleached and nonbleached regions. (D and F) Normalized fluorescence intensity curves of bleached/unbleached ROIs for FRAP recovery up to 1 min (D) and 20 min (F) after bleaching of dystrophin-EGFP in sarcolemma (D and F) and cytoplasm (F) [four isolated fibers, n = 12 ROIs (D); two mice, n = 6 ROIs for cytoplasmic or sarcolemmal EGFP (F)].
Fig. 4.
Fig. 4.
Experimental restoration of dystrophin-EGFP. (A) Epifluorescence microscopy shows single live myofibers isolated from EDL muscles of DmdEGFP-mdx mouse after injection of AAV-SaCas9-sgRNA22 and AAV-mCherry-sgRNA23 vectors. Dystrophin-EGFP in green (Left image), Hoechst in blue (Middle image), mCherry in red (Right merged image). Restored BSDU (arrowheads) and central myonucleus (arrow). (B) In vivo multiphoton microscopy of hindlimb muscle from untreated DmdEGFP-mdx control mice (Left image) with autofluorescent macrophages (white arrowheads) and muscle from tcDNA-treated mice (Right image) with restored dystrophin-EGFP at the MTJ (yellow arrows) and interjunctional sarcolemma (white arrows). (C) Epifluorescence microscopy of a single live myofiber from untreated DmdEGFP-mdx mice (Top image; dotted line outlines fiber) and after tcDNA treatment (Bottom image). MTJ (yellow arrow) and interjunctional sarcolemma (white arrow). (D and E) Epifluorescence microscopy with identical microscopy settings of live single myofibers from EDL muscles of untreated DmdEGFP mice, untreated DmdEGFP-mdx mice, and after two P-tcDNA and after four P-tcDNA injections of DmdEGFP-mdx mice (from Left to Right) of interjunctional sarcolemma (D) and fiber tips (E). Interspersed dystrophin-EGFP patches (white arrowheads), MTJ (yellow arrows), and interjunctional sarcolemma (white arrows). (F) The corrected total intensity of native dystrophin-EGFP fluorescence was measured and compared between the different genotypes and conditions at the MTJ level. The dot plots show the values of the analyzed areas with a histogram of the average and SEM (between 8 and 38 fibers were analyzed). P values were calculated using the Mann–Whitney test. (G) Serum CK levels were quantified in DmdEGFP mice in comparison with untreated and treated DmdEGFP-mdx mice. All values are expressed as mean ± SEM. Points represent individual mice from each group (n = 4 to 6 mice). Statistical analyses were performed using one-way ANOVA followed by Sidak multiple comparison test (ns = not significant; *P < 0.05; **P < 0.01; ***P < 0.001; ****P < 0.0001).

References

    1. Davies K. E., Nowak K. J., Molecular mechanisms of muscular dystrophies: Old and new players. Nat. Rev. Mol. Cell Biol. 7, 762–773 (2006). - PubMed
    1. Hoffman E. P., Brown R. H., Kunkel L. M., Dystrophin: The protein product of the Duchenne muscular dystrophy locus. Cell 51, 919–928 (1987). - PubMed
    1. Koenig M., Monaco A. P., Kunkel L. M., The complete sequence of dystrophin predicts a rod-shaped cytoskeletal protein. Cell 53, 219–228 (1988). - PubMed
    1. Schneider A.-F. E., Aartsma-Rus A., Developments in reading frame restoring therapy approaches for Duchenne muscular dystrophy. Expert Opin. Biol. Ther. 21, 343–359 (2021). - PubMed
    1. Goyenvalle A., et al. , Functional correction in mouse models of muscular dystrophy using exon-skipping tricyclo-DNA oligomers. Nat. Med. 21, 270–275 (2015). - PubMed

LinkOut - more resources