. 2022 Dec 16;3(4):101881.
doi: 10.1016/j.xpro.2022.101881. Epub 2022 Dec 6.

Protocol for assessing phagocytosis activity in cultured primary murine microglia

Affiliations

Protocol for assessing phagocytosis activity in cultured primary murine microglia

Elsie Layman et al. STAR Protoc. .

Abstract

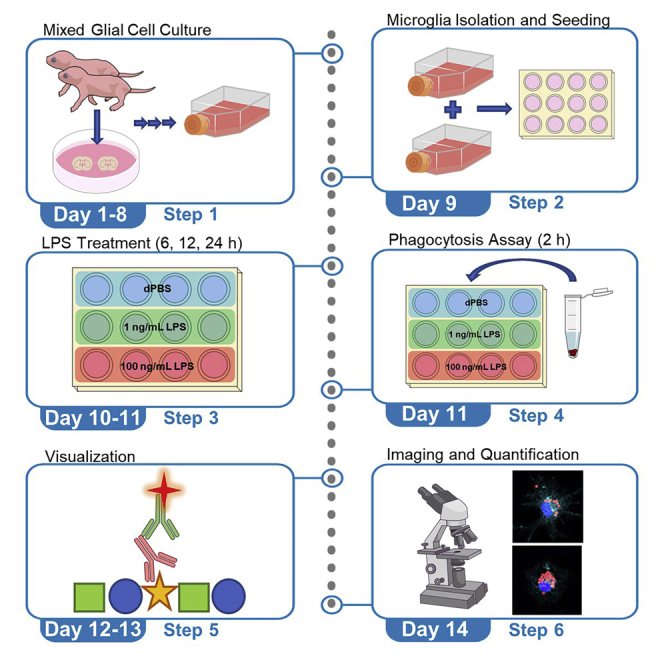
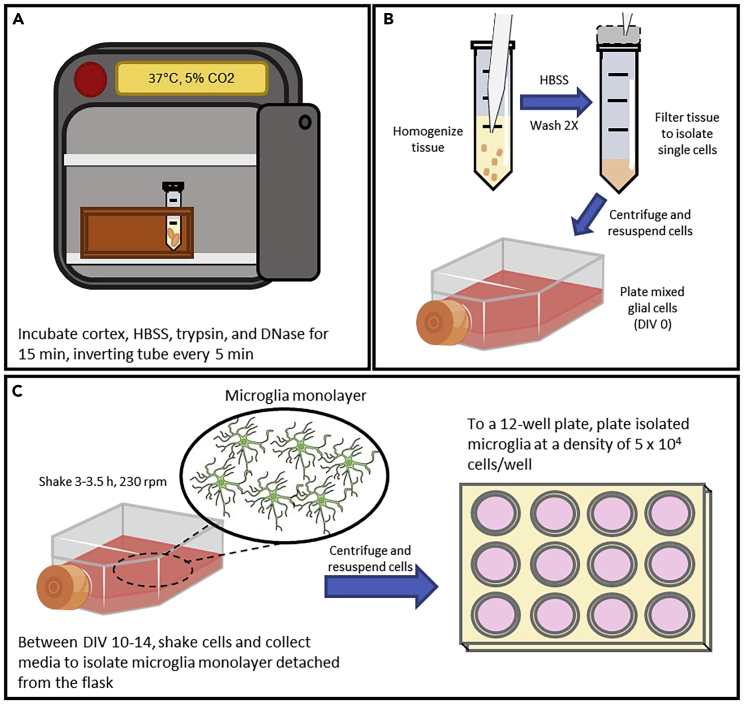
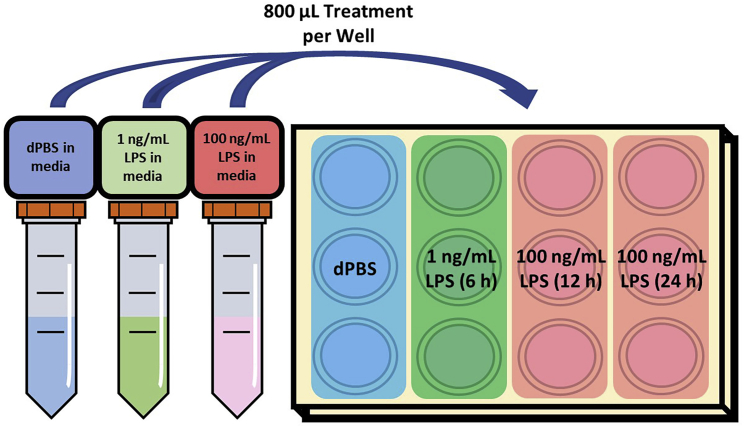
In this protocol, we describe steps to assess inflammation-induced cell response in cultured primary murine microglia through the analysis of fluorescent bead phagocytosis. We detail primary murine mixed glial cell culture preparation followed by microglia-specific isolation. Further, we describe treatment with lipopolysaccharide (LPS) to induce phagocytosis of fluorescent beads, followed by quantitative analysis using fluorescent imaging and Fiji - ImageJ software. For complete details on the use and execution of this protocol, please refer to Parrott et al.1.

Keywords: Cell Biology; Cell culture; Cell-based Assays; Microscopy; Neuroscience.


Conflict of interest statement

Declaration of interests The authors declare no competing interests.

Figures

None
Graphical abstract
Figure 1
Figure 1
Illustration of brain dissection and collection of the cortex (A) After removing the murine brain from the skull, remove olfactory bulbs, meninges, cerebellum, brainstem, and hypothalamus. (B) Carefully cut into the midline of the brain, avoiding cutting all the way through, peeling the cortex away to reveal the hippocampus. (C) Flip the brain from the dorsal to ventral side, revealing the striatum. Remove the striatum. Cut along the corpus callosum and peel tissue to reveal hippocampus. Remove hippocampus to isolate cortex. (D) Ensuring all meninges are removed from cortex, collect cortex into prepared 15 mL conical tube containing HBSS-H.
Figure 2
Figure 2
Primary mixed glial culture, shaking, and seeding microglia (A) After collecting the cortices from 2–6 pups, incubate cortices with trypsin, HBSS, and DNase at 37°C for 15 min. Every 5 min, invert tube. (B) After completing incubation, homogenize the tissue with P1000 and P200 pipettes, then filter the tissue to isolate single cells. These cells may then be plated with warmed media in a T-75 flask. (C) At DIV 10–14, cover the flask with aluminum foil and shake cells at 230 rpm for 3–3.5 h. Shaking of the flasks will detach microglia, which adhere in a loose monolayer on the flask. Collect the media containing microglia and plate cells to a 12-well plate.
Figure 3
Figure 3
Timeline of mixed glial culture development (DIV 1–14) During DIV 1–7, a bottom layer consisting of astrocytes forms. Microglia begin forming clusters and individual cells above this astrocytic layer. At about DIV 10, microglia become dense and float above astrocytes (mainly). By DIV 14, microglia have become very dense. Yellow arrows indicate examples of microglia development. Black arrows indicate examples of astrocyte development. Scale bars for all panels represent 100 μm. Images taken at 10× magnification.
Figure 4
Figure 4
Examples of unhealthy and healthy isolated microglia after shaking Microglia were plated with a density of 5 × 105 cells/well in a 12-well plate. Images were taken three days after plating. (A) Unhealthy primary cultured microglia: unhealthy cells have notable debris with a lower density of cells. Cells appear darker with a less defined amoeboid shape than healthy cells. (B) Healthy primary cultured microglia: healthy cells have minimal debris with a more defined amoeboid morphology. Scale bars for all panels represent 100 μm. Higher magnifications of the left images (yellow boxes) are shown on the right panels. Images taken at 10× magnification.
Figure 5
Figure 5
LPS treatment and timing strategy example for a single 12-well plate In this example, 800 μL of solution should be added to each well. This strategy can be revised according to the desired conditions for an individual investigator’s experimental set-up.
Figure 6
Figure 6
Visualization of microglia phagocytosis of fluorescent beads (A and B) Schematic depiction of immunostaining, mounting, and imaging steps. (C) Visualization of WT microglia phagocytosis of fluorescent beads after staining. Images are labeled with beads (red), microglia (Iba1, cyan), and nuclei (DAPI, blue). Higher magnifications of the left images (yellow box) are shown on the right panel. Scale bars for left image and right image represent 30 μm and 10 μm, respectively. Cells were imaged at 20× magnification and analyzed using Fiji – ImageJ software. Microglia images are adopted from a previous publication by Parrott et al. (2021).

References

    1. Parrott J.M., Oster T., Lee H.Y. Altered inflammatory response in FMRP-deficient microglia. iScience. 2021;24:103293. - PMC - PubMed
    1. Wolterink-Donselaar I.G., Meerding J.M., Fernandes C. A method for gender determination in newborn dark pigmented mice. Lab Anim. 2009;38:35–38. - PubMed
    1. Floden A.M., Combs C.K. Microglia repetitively isolated from in vitro mixed glial cultures retain their initial phenotype. J. Neurosci. Methods. 2007;164:218–224. - PMC - PubMed
    1. Wolfes A.C., Dean C. Culturing in vivo-like murine astrocytes using the fast, simple, and inexpensive AWESAM protocol. J. Vis. Exp. 2018;131:e56092. - PMC - PubMed
    1. Schildge S., Bohrer C., Beck K., Schachtrup C. Isolation and culture of mouse cortical astrocytes. J. Vis. Exp. 2013;71:e50079. - PMC - PubMed

Publication types

LinkOut - more resources