. 2023 Jan 31;42(1):111895.
doi: 10.1016/j.celrep.2022.111895. Epub 2023 Jan 2.

PD-1highCXCR5-CD4+ peripheral helper T cells promote CXCR3+ plasmablasts in human acute viral infection

Affiliations

PD-1highCXCR5-CD4+ peripheral helper T cells promote CXCR3+ plasmablasts in human acute viral infection

Hiromitsu Asashima et al. Cell Rep. .

Abstract

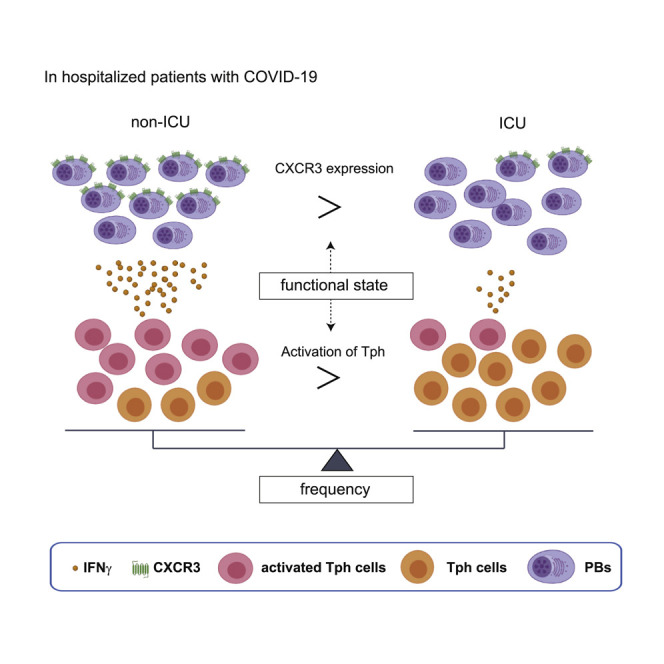
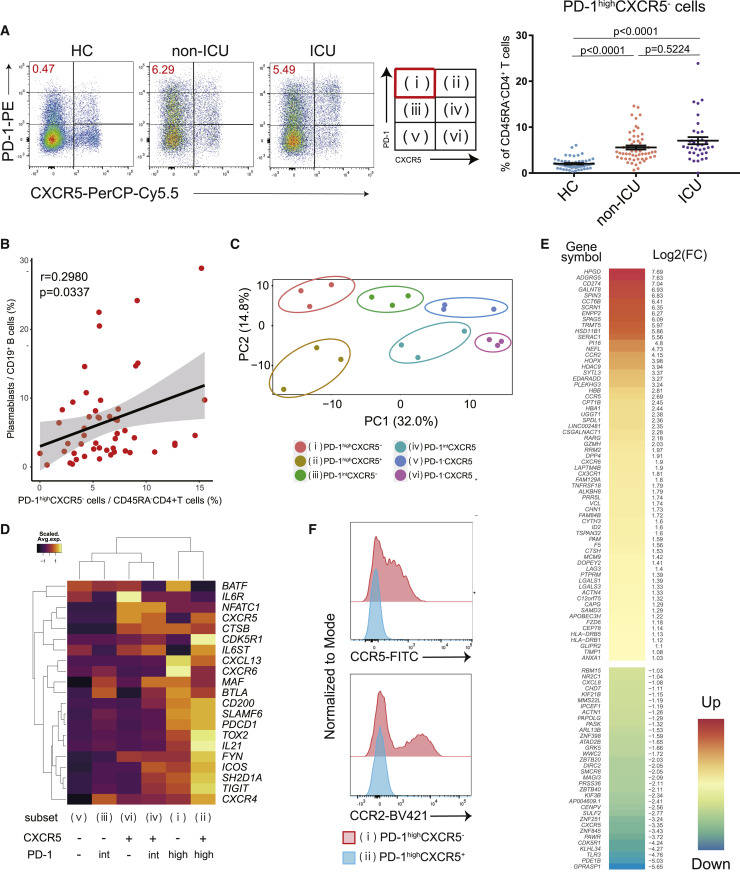
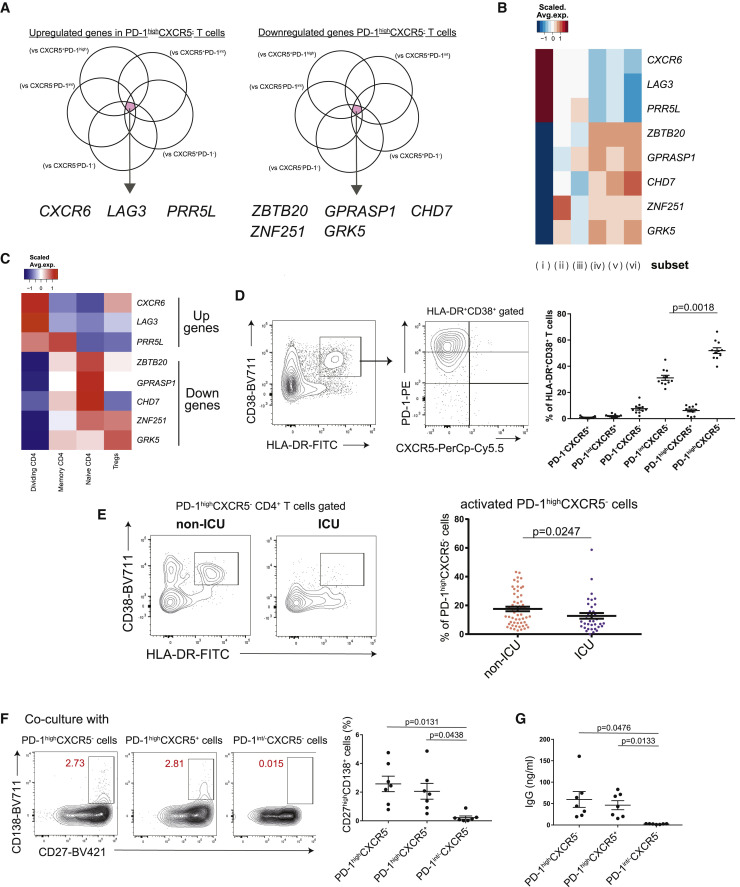
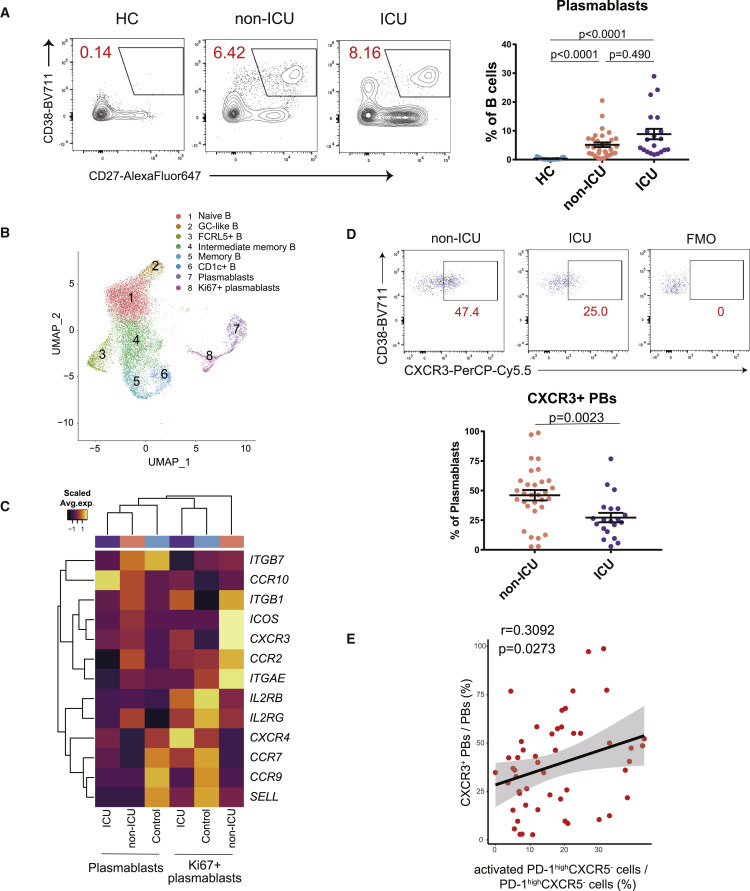
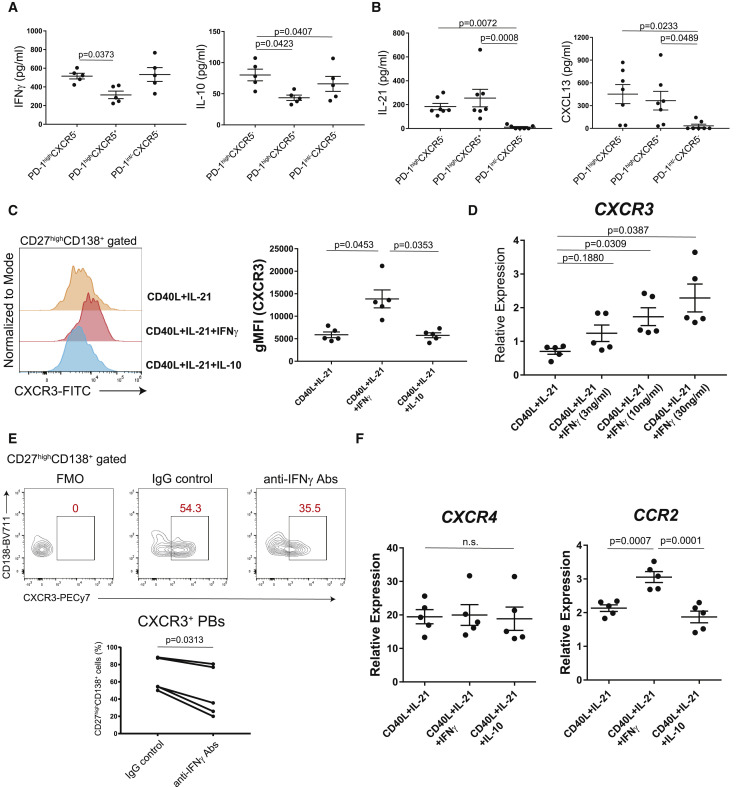
T cell-B cell interaction is the key immune response to protect the host from severe viral infection. However, how T cells support B cells to exert protective humoral immunity in humans is not well understood. Here, we use COVID-19 as a model of acute viral infections and analyze CD4+ T cell subsets associated with plasmablast expansion and clinical outcome. Peripheral helper T cells (Tph cells; denoted as PD-1highCXCR5-CD4+ T cells) are significantly increased, as are plasmablasts. Tph cells exhibit "B cell help" signatures and induce plasmablast differentiation in vitro. Interestingly, expanded plasmablasts show increased CXCR3 expression, which is positively correlated with higher frequency of activated Tph cells and better clinical outcome. Mechanistically, Tph cells help B cell differentiation and produce more interferon γ (IFNγ), which induces CXCR3 expression on plasmablasts. These results elucidate a role for Tph cells in regulating protective B cell response during acute viral infection.

Keywords: CP: Immunology; CXCR3(+) plasmablasts; IFNγ; PD-1(high)CXCR5(–)CD4(+) peripheral helper T cells; T cell-B cell interactions; Tph cells.


Conflict of interest statement

Declaration of interests D.A.H. has received research funding from Bristol-Myers Squibb, Novartis, Sanofi, and Genentech. He has been a consultant for Bayer Pharmaceuticals, Bristol Myers Squibb, Compass Therapeutics, EMD Serono, Genentech, Juno Therapeutics, Novartis Pharmaceuticals, Proclara Biosciences, Sage Therapeutics, and Sanofi Genzyme. Further information regarding funding is available at https://openpaymentsdata.cms.gov/physician/166753/general-payments. N.K. reports personal fees from Boehringer Ingelheim, Third Rock, Pliant, Samumed, NuMedii, Indalo, Theravance, LifeMax, Three Lake Partners, and RohBar in the last 36 months and Equity in Pliant. N.K. is also a recipient of a grant from Veracyte and non-financial support from Miragen. In addition, N.K. has patents on New Therapies in Pulmonary Fibrosis and ARDS (unlicensed) and Peripheral Blood Gene Expression as biomarkers in IPF (licensed to biotech), all outside the submitted work. S.H.K. receives consulting fees from Northrop Grumman. K.B.H. receives consulting fees from Prellis Biologics.

Figures

None
Graphical abstract
Figure 1
Figure 1
The characteristics of PD-1highCXCR5 Tph cells (A) Representative data of PD-1highCXCR5 Tph cells in each group (left), the proportion of these T cells among healthcare workers (HCs) (n = 55), non-ICU patients with COVID-19 (non-ICU) (n = 56), and ICU patients (ICU) (n = 36). One-way ANOVA with Dunn’s multiple comparisons tests were performed (right). Data are represented as mean ± SEM. (B) Correlation between PD-1highCXCR5 Tph cells and plasmablasts in patients (both non-ICU and ICU, n = 51). Linear regression is shown with 95% confidence interval (gray area). Correlation statistics is two-tailed Spearman’s rank correlation test. (C) Principal-component analysis (PCA) of RNA-seq transcriptomes (n = 3, patients with COVID-19). Based on the expressions of PD-1 and CXCR5, six subsets were evaluated. (D) Heatmap of Tfh-related genes. (E) Clustered heatmap of 100 genes that were differentially expressed (left column) in PD-1highCXCR5 Tph cells compared with cTfh cells (PD-1highCXCR5+ Tfh cells) (|log2FC| > 1, FDR < 0.05). The right column shows the log2FC. (F) Representative data of CCR5 and CCR2 expression on PD-1highCXCR5 Tph cells compared with PD-1highCXCR5+ Tfh cells. See also Figures S1–S3.
Figure 2
Figure 2
Activated PD-1highCXCR5 Tph cells are significantly increased in non-ICU patients with COVID-19 (A) Venn diagrams showing the overlapped genes among those significantly upregulated (log2FC > 1, FDR < 0.05) (left) and downregulated (log2FC < −1, FDR < 0.05) (right) in PD-1highCXCR5 Tph cells compared with five subsets. (B) Heatmap of PD-1highCXCR5 Tph cell-related genes (selected in A). (C) Heatmap of PD-1highCXCR5 Tph cell-related genes (selected in A) among each T cell cluster of our scRNA-seq dataset reported. (D) Representative data for each T cell subset among HLA-DR+CD38+CD45RACD4+ T cells (left), and their proportions were evaluated by one-way ANOVA with Dunn’s multiple comparisons tests (right). COVID-19 samples that have more than 5% of HLA-DR+CD38+ T cells were evaluated (n = 11). (E) Representative data of HLA-DR+CD38+ activated cells in PD-1highCXCR5 Tph cells between non-ICU and ICU patients (left). The proportions of activated PD-1highCXCR5 Tph cells were evaluated (non-ICU; n = 56, ICU; n = 36) by two-tailed unpaired Student’s t test (right). (F and G) Each T cell subset and autologous CD20+CD27+ B cells were co-cultured (n = 7, patients with COVID-19). Representative data of CD27highCD138+ plasma cells after co-culture (F, left) and the proportion of plasma cells (F, right). IgG concentrations in supernatants were evaluated (G). PD-1int/−CXCR5 T cells indicate both PD-1intCXCR5 T cells (subset iii) and PD-1CXCR5 T cells (v). Data are represented as mean ± SEM (D–G). See also Figure S4.
Figure 3
Figure 3
The divergent immunological features of B cells in non-ICU and ICU patients with COVID-19 (A) Representative data of CD19+CD27+CD38+ plasmablasts (left). Plasmablasts between HCs (n = 15) and non-ICU (n = 31) and ICU patients with COVID-19 (n = 20) were evaluated by one-way ANOVA with Dunn’s multiple comparisons tests (right). (B) Uniform manifold approximation and projection (UMAP) representation of subclustered B cells from HCs (n = 13) and COVID-19 samples (n = 18 from 10 patients). (C) Heatmap of chemoattractant receptors among HCs and non-ICU and ICU patients with COVID-19 in clusters of both plasmablasts and Ki67+ plasmablasts. Average expression per subject is shown. (D) Representative data of CXCR3 expression on CD19+CD27+CD38+ plasmablasts in patients with COVID-19 (left). CXCR3+ plasmablasts between non-ICU (n = 31) and ICU (n = 20) patients with COVID-19 were evaluated by two-tailed unpaired Student’s t test (right). FMO, fluorescence minus one. (E) Correlation between activated PD-1highCXCR5 Tph cells and CXCR3+ plasmablasts (both non-ICU and ICU, n = 51). Linear regression is shown with 95% confidence interval (gray area). Correlation statistics is two-tailed Spearman’s rank correlation test. Data are represented as mean ± SEM (A and D). See also Figures S5–S7.
Figure 4
Figure 4
CXCR3 expression on plasmablasts is induced by via IFNγ from PD-1highCXCR5 Tph cells (A) T cells (n = 5, patients with COVID-19) were stimulated with anti-CD3/28 for 48 h, then cytokine productions were measured (IFNγ, IL-10) by ELISA. (B) IL-21 and CXCL13 levels in the supernatants of co-cultures were measured by ELISA (n = 7, patients with COVID-19). (C and D) CD20+CD27+ memory B cells (n = 5, healthy controls) were cultured with CD40L, IL-21, and IL-10 or different concentrations of IFNγ for 7 days (n = 5, healthy controls). Representative histogram for CXCR3 expression on plasma cells (C, left) and CXCR3 gMFI was evaluated (C, right). After 7 days in culture, CD19+CD27+CD138+ plasma cells were sorted, and CXCR3 expression was measured by qPCR (D). (E) Representative data of CXCR3 expression on CD27highCD138+ plasma cells after co-culture with Tph cells (n = 5, patients with COVID-19) with anti-human IFNγ antibodies (anti-IFNγ Abs) or IgG isotype controls (IgG control) (E, top). CXCR3+CD27highCD138+ plasma cells (bottom) were evaluated by Wilcoxon matched-pairs signed rank test (E, bottom). (F) After 7 days culture of CD20+CD27+ memory B cells (n = 5, healthy donors) with various conditions, gene expressions of CD19+CD27highCD138+ plasma cells were measured by qPCR (n = 5, healthy controls). Data were evaluated by one-way ANOVA with Tukey’s multiple comparisons tests (A–D and F). Data are represented as mean ± SEM (A–D and F).

References

    1. Wu Z., McGoogan J.M. Characteristics of and important lessons from the coronavirus disease 2019 (COVID-19) outbreak in China: summary of a report of 72314 cases from the Chinese center for disease control and prevention. JAMA. 2020;323:1239–1242. doi: 10.1001/jama.2020.2648. - DOI - PubMed
    1. Zhu N., Zhang D., Wang W., Li X., Yang B., Song J., Zhao X., Huang B., Shi W., Lu R., et al. Novel coronavirus from patients with Pneumonia in China, 2019. N. Engl. J. Med. 2020;382:727–733. doi: 10.1056/NEJMoa2001017. - DOI - PMC - PubMed
    1. Takahashi T., Ellingson M.K., Wong P., Israelow B., Lucas C., Klein J., Silva J., Mao T., Oh J.E., Tokuyama M., Lu P., Venkataraman A., Park A., Liu F., Meir A., Sun J., Wang E.Y., Casanovas-Massana A., Wyllie A.L., Vogels C.B.F., Earnest R., Lapidus S., Ott I.M., Moore A.J., Yale IMPACT Research Team. Shaw A., Fournier J.B., Odio C.D., Farhadian S., Dela Cruz C., Grubaugh N.D., Schulz W.L., Ring A.M., Ko A.I., Omer S.B., Iwasaki A. Sex differences in immune responses that underlie COVID-19 disease outcomes. Nature. 2020;588:315–320. doi: 10.1038/s41586-020-2700-3. - DOI - PMC - PubMed
    1. Giamarellos-Bourboulis E.J., Netea M.G., Rovina N., Akinosoglou K., Antoniadou A., Antonakos N., Damoraki G., Gkavogianni T., Adami M.E., Katsaounou P., et al. Complex immune dysregulation in COVID-19 patients with severe respiratory failure. Cell Host Microbe. 2020;27:992–1000.e3. doi: 10.1016/j.chom.2020.04.009. - DOI - PMC - PubMed
    1. Unterman A., Sumida T.S., Nouri N., Yan X., Zhao A.Y., Gasque V., Schupp J.C., Asashima H., Liu Y., Cosme C., et al. Single-cell multi-omics reveals dyssynchrony of the innate and adaptive immune system in progressive COVID-19. Nat. Commun. 2022;13:440. doi: 10.1038/s41467-021-27716-4. - DOI - PMC - PubMed

Publication types