. 2023 Jan 31;42(1):111896.
doi: 10.1016/j.celrep.2022.111896. Epub 2023 Jan 2.

Efficient generation of lower induced motor neurons by coupling Ngn2 expression with developmental cues

Affiliations

Efficient generation of lower induced motor neurons by coupling Ngn2 expression with developmental cues

Francesco Limone et al. Cell Rep. .

Abstract

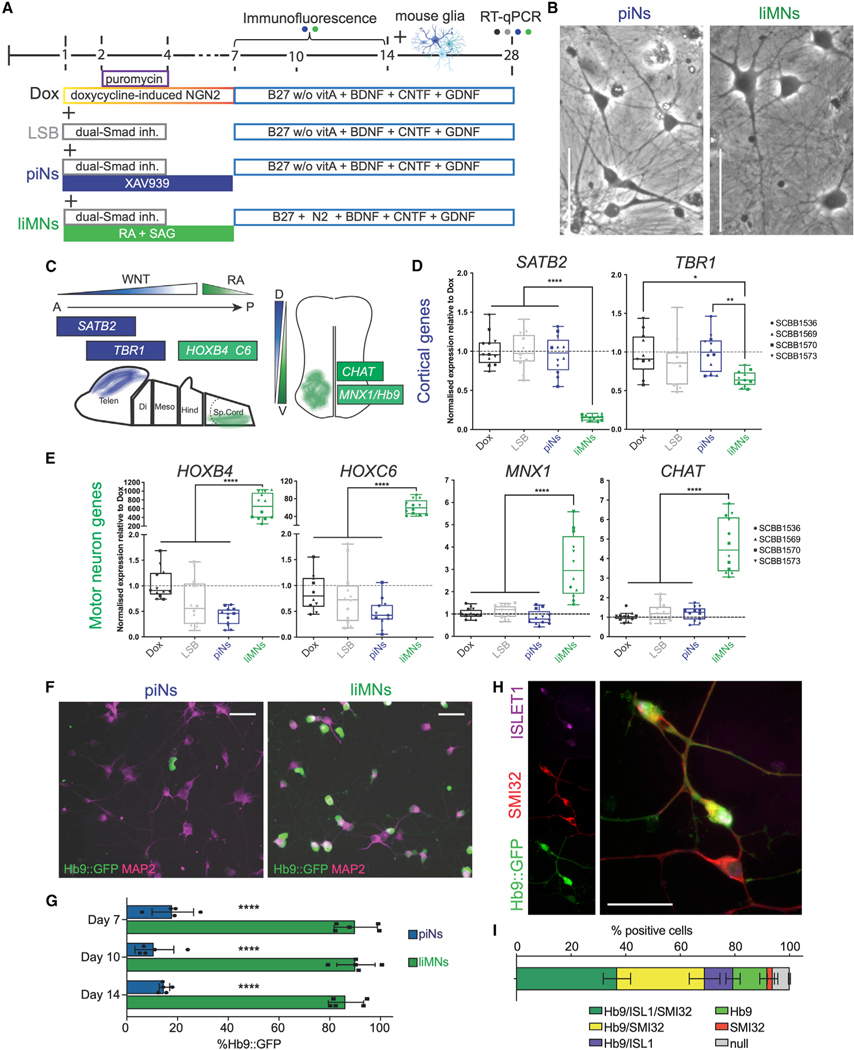
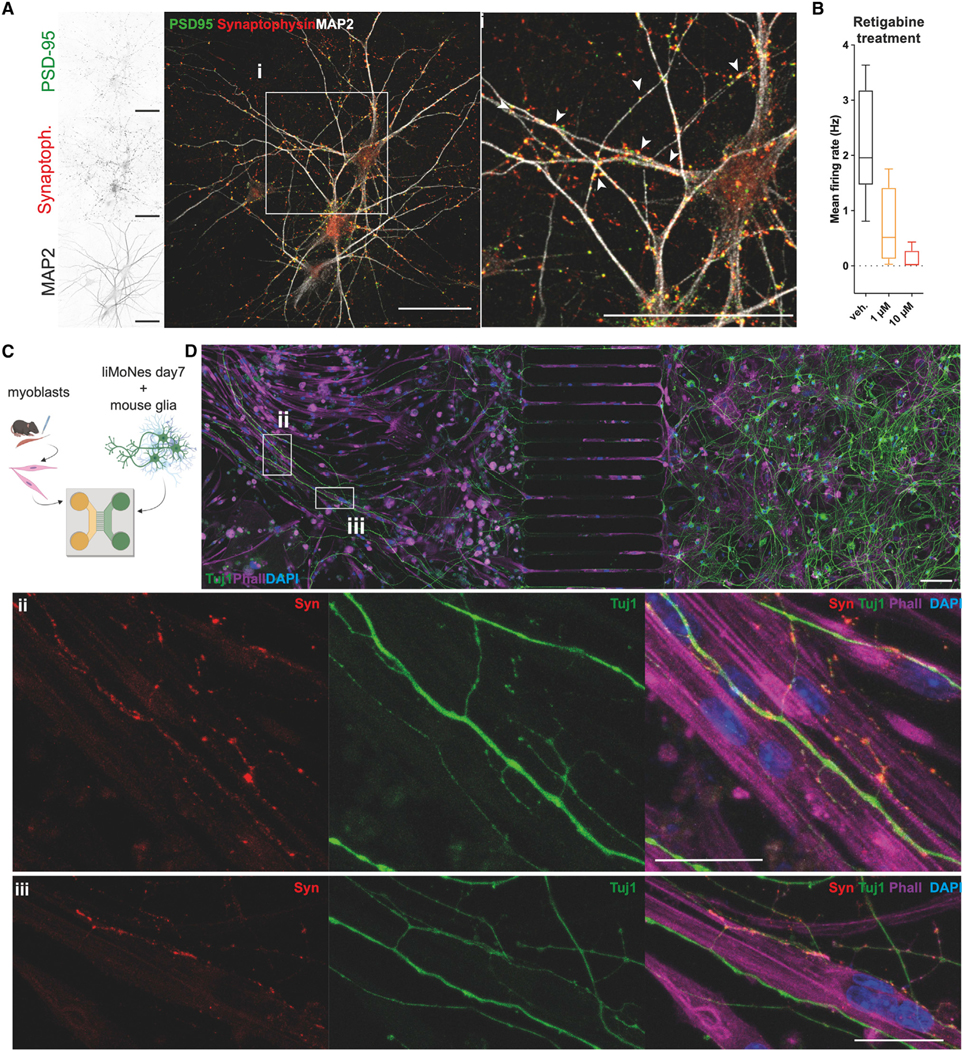
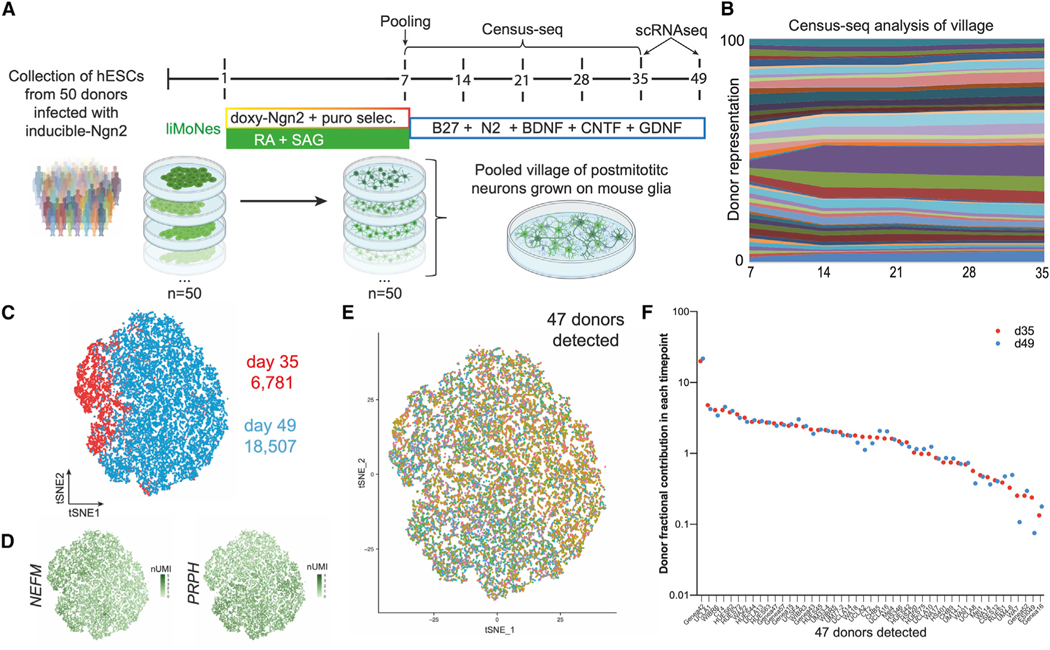
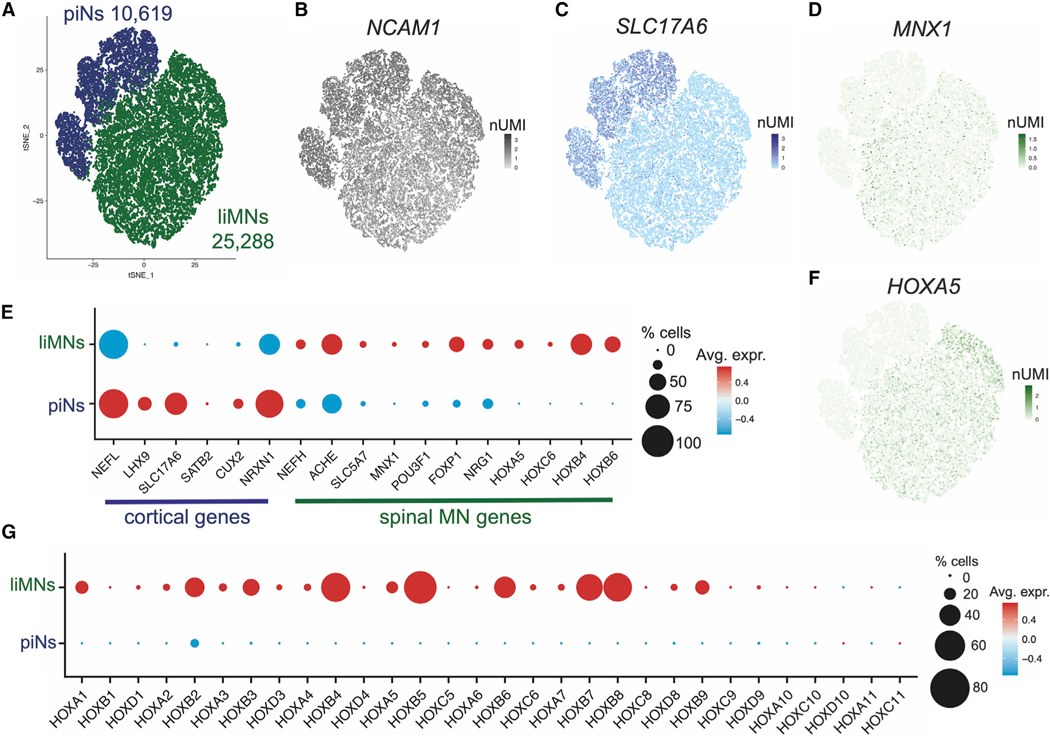
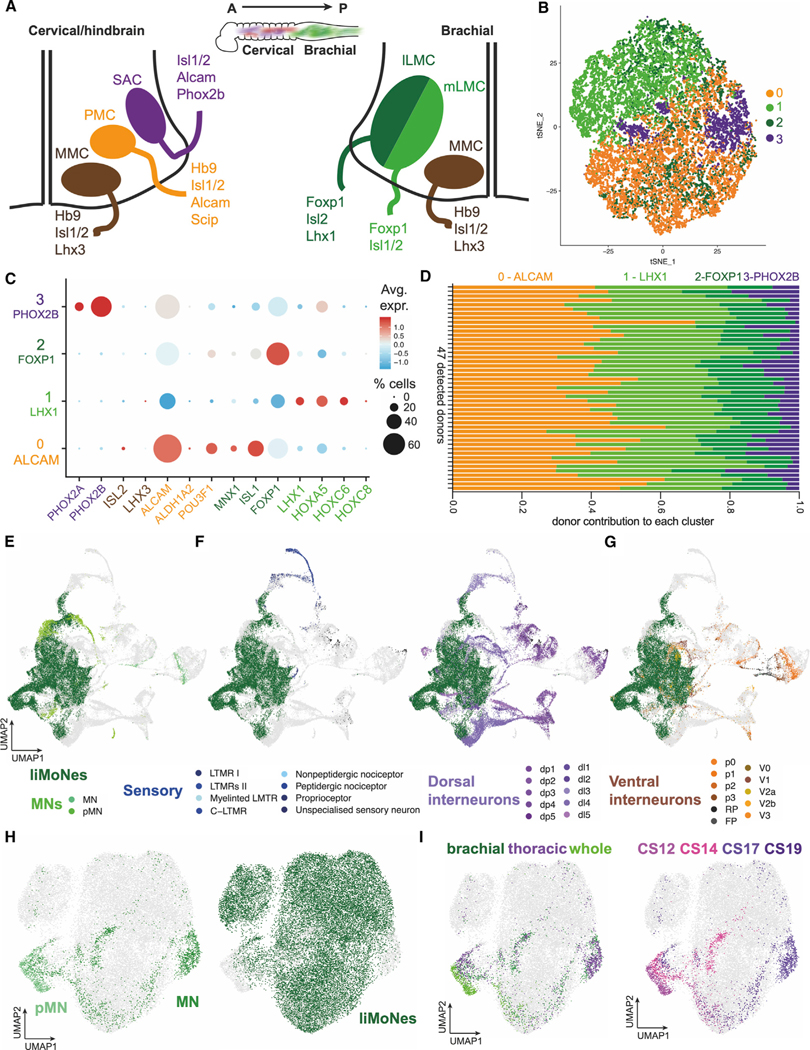
Human pluripotent stem cells (hPSCs) are a powerful tool for disease modeling of hard-to-access tissues (such as the brain). Current protocols either direct neuronal differentiation with small molecules or use transcription-factor-mediated programming. In this study, we couple overexpression of transcription factor Neurogenin2 (Ngn2) with small molecule patterning to differentiate hPSCs into lower induced motor neurons (liMoNes/liMNs). This approach induces canonical MN markers including MN-specific Hb9/MNX1 in more than 95% of cells. liMNs resemble bona fide hPSC-derived MN, exhibit spontaneous electrical activity, express synaptic markers, and can contact muscle cells in vitro. Pooled, multiplexed single-cell RNA sequencing on 50 hPSC lines reveals reproducible populations of distinct subtypes of cervical and brachial MNs that resemble their in vivo, embryonic counterparts. Combining small molecule patterning with Ngn2 overexpression facilitates high-yield, reproducible production of disease-relevant MN subtypes, which is fundamental in propelling our knowledge of MN biology and its disruption in disease.

Keywords: CP: Neuroscience; CP: Stem cell research; Dropulation; NGN2; differentiation protocol; human stem cells; motor neuron; multiplexed pooled sequencing; neuronal differentiation; patterning molecules; single cell profiling; spinal cord.


Conflict of interest statement

Declaration of interests K.E. is cofounder of Q-State Biosciences, Quralis, Enclear Therapies, and is group vice president at BioMarin Pharmaceutical.

Figures

Figure 1.
Figure 1.. Ngn2-driven neuralization can be directed to different neuronal fates by small molecule patterning
(A) Diagram of known developmental cues used to design patterning strategy. BMP, bone morphogenic protein. (B) Differentiation schemes used for comparison of divergent Ngn2-driven trajectories: Dox, original Ngn2 overexpression from Zhang et al. 2013; LSB, Ngn2 overexpression coupled with neuralizing dual-Smad inhibition (LDN193189, SB431542); piNs, cortical-like piNs (Nehme et al. 2018); liMoNes/liMNs generated by Ngn2 overexpression and ventro-caudal patterning (RA and smoothened agonist). (C) Genes selected as master regulators of anterior-dorsal, cortical development and ventro-caudal, spinal cord development. (D) RT-qPCR quantification for cortical genes at day 4 (three cell lines in n = 3 technical replicates each, p values from one-way ANOVA). (E) RT-qPCR quantification for spinal genes at day 4 (three cell lines in n = 3 technical replicates each, one-way ANOVA). (F) Flow cytometry quantification of Hb9:GFP positive cells at day 4. (G) Hb9:GFP intensity at day 4 of differentiation demonstrating higher total intensity of the Hb9:GFP signal in liMNs. (H) Hb9:GFP expression day 7 after induction in piNs and liMNs, the majority of liMNs express the reporter (scale bar, 50 μm).
Figure 2.
Figure 2.. Patterned Ngn2-induced neuronal fate is maintained throughout differentiation
(A) Differentiation schemes for neuronal maturation after one-week of patterning: Dox, original Zhang et al. 2013; LSB, Ngn2 with dual-Smad inhibition; piNs, cortical-like piNs (Nehme et al. 2018).. (B) Brightfield image at day 30 of piNs and liMNs (scale bar, 100 μm). (C) Diagram of genes specifically expressed in either anterior-dorsal cortical neurons or ventro-caudal, spinal cord MNs. (D) RT-qPCR quantification for induction of cortical genes at day 30 (four cell lines in n = 3 technical replicates, one-way ANOVA). (E) RT-qPCR quantification for spinal cord genes at day 28 (four cell lines in n = 3 technical replicates, one-way ANOVA). (F) Hb9:GFP reporter expression at day 14 after induction in piNs and liMNs (scale bar, 50 μm). (G) Quantification of Hb9:GFP reporter expression at day 7, 10 and 14 post-induction in piNs (blue) and liMNs (green) by immunofluorescence (n = 5, p values from t test at each time point). (H) IF analysis for pan-MN SMI-32, Islet1 and Hb9:GFP reporter expression at day 7 post-induction (scale bar, 50 μm). (I) Quantification H (n = 3 replicates).
Figure 3.
Figure 3.. liMoNes reproducibly express canonical MN markers
(A) Immunofluorescent staining for MN-specific marker Stathmin2 (STMN2) and neuronal cytoskeletal protein TUBB3 (Tuj1) at day14 (scale bar 100 μm). (B) Immunofluorescent staining for cholinergic marker choline acetyltransferase (Chat) and neuronal cytoskeletal proteins MAP2 and TUBB3 (Tuj1) at day 30 (glial co-cultures—scale bar, 30 μm). (C) Immunofluorescent staining for limb-innervating MN marker FOXP1 and neuronal MAP2 and TUBB3 (Tuj1) at day 30 (glial co-cultures—scale bar, 30 μm). (D) Immunofluorescent staining for MN-enriched SMI-32, cholinergic TF islet 1 and neuronal MAP2 at day 30 (glial co-cultures—scale bar, 30 μm). (E) Quantification for cells in B–D (n = 10). (F) Quantification of expression of selected markers in five independently differentiated lines (five cell lines, n = 2 each). (G) Differentiation schemes implemented to compare liMNs with bona fide hiPSC-MN derived by conventional small molecule induction (2D MN, in purple). (H) Morphology of neuronal cells produced: piNs, liMNs and 2D-MN (scale bar, 50 μm). (I) RT-qPCR quantification of MN markers between liMNs (green) and 2D-MN (purple) (n = 3).
Figure 4.
Figure 4.. liMoNes can form active synaptic structures in vitro
(A) Day50 liMNs express pre- and post-synaptic density proteins (scale bar, 50 μm). (B) Mean number of spikes in day 50 cultures treated with raising concentrations of retigabine (n = 6). (C) Diagram of co-culture experiments of liMNs and primary murine myoblasts in microfluidic devices. (D) Immunofluorescence of co-culture of liMNs and primary murine myoblasts showing glia-liMNs co-cultures (right), where neurons extend axons through the channels (middle), contacting primary muscle cells (left). (Di–Dii) Insets of (D) showing liMNs forming synaptic-like contacts with muscles cells (scale bar, 50 μm).
Figure 5.
Figure 5.. scRNA-seq confirms expression of MN-specific genes and reproducibility of the protocol
(A) Pooling strategy and village construction for Census-seq and Dropulation analysis. BDNF, brain-derived neurotrophic factor; CNTF, ciliary neurotrophic factor; GDNF, glia-derived neurotrophic factor. (B) Sandplot of Census-seq analysis showing balanced representation of 47 detected donors throughout several days after induction. (C) t-SNE projection of scRNA-seq analysis of 25,288 cells of two timepoints of mature liMNs differentiation. (D) t-SNE projection with expression of markers for neurons of the peripheral nervous system. (E) t-SNE projection of 25,288 cells depicting donor’s identity of each cell from 47 donors detected by Dropulation analysis. (F) Fraction representation of 47 donors in the two timepoints of mature liMNs differentiation.
Figure 6.
Figure 6.. Confirmed divergent neuronal fate of piNs and liMNs
(A) t-SNE projection of scRNA-seq analysis of 25,288 cells of two timepoints of piNs and liMNs differentiation. (B) t-SNE projection with expression of neuronal marker. (C) t-SNE projection with expression of cortical-enriched marker. (D) t-SNE projection with expression of MN-specific marker. (E) Dotplot for differential gene expression of markers specific to either cortical excitatory neurons or spinal MNs. (F) t-SNE projection with expression of brachial MN-specific HOX gene expression. (G) Dotplot for gene expression of all retinoid-dependent HOX genes in piNs and liMNs.
Figure 7.
Figure 7.. Ventro-caudal patterning of NGN2 can produce different MN subtypes
(A) Diagram of known pools of MN subtypes along mammalian spinal cord. (B) t-SNE projection of four, unbiasedly identified subclusters in the 25,288 cells analyzed. (C) Dotplot for differential gene expression of MN subtype-specific markers in the four cervico-brachial MN groups. (D) Fraction of each donor’s share between the identified subclusters as calculated by Dropulation. (E) t-SNE projection of integrated datasets: liMoNes and MNs and pMNs (progenitors) from human embryonic spinal cord Rayon et al. 2021. (F) t-SNE projection of integrated datasets: liMoNes, sensory neurons and dorsal interneurons from Rayon et al. 2021. (G) t-SNE projection of integrated datasets: liMoNes and ventral interneurons from Rayon et al. 2021. (H) t-SNE projection of integrated datasets with MNs only. (I) t-SNE projection of integrated datasets with MNs only with regionality and timepoints (Carnegie stage) from Rayon et al. highlighted.

References

    1. Mitchell JM, Nemesh J, Ghosh S, Handsaker RE, Mello CJ, Meyer D, Raghunathan K, de Rivera H, Tegtmeyer M, Hawes D, et al. (2020). Mapping genetic effects on cellular phenotypes with “cell villages”. Preprint at bioRxiv. 10.1101/2020.06.29.174383. - DOI
    1. Wells MF, Nemesh J, Ghosh S, Mitchell JM, Mello CJ, Meyer D, Raghunathan K, Tegtmeyer M, Hawes D, Neumann A, et al. (2021). Natural variation in gene expression and Zika virus susceptibility revealed by villages of neural progenitor cells. Preprint at bioRxiv. 10.1101/2021.11.08.467815. - DOI - PMC - PubMed
    1. Penney J, Ralvenius WT, and Tsai LH (2020). Modeling Alzheimer’s disease with iPSC-derived brain cells. Mol. Psychiatry 25, 148–167. 10.1038/s41380-019-0468-3. - DOI - PMC - PubMed
    1. Limone F, Klim JR, and Mordes DA (2022). Pluripotent stem cell strategies for rebuilding the human brain. Front Aging Neurosci 14, 1017299. 10.3389/fnagi.2022.1017299. - DOI - PMC - PubMed
    1. Chambers SM, Fasano CA, Papapetrou EP, Tomishima M, Sadelain M, and Studer L. (2009). Highly efficient neural conversion of human ES and iPS cells by dual inhibition of SMAD signaling. Nat. Biotechnol 27, 275–280. 10.1038/nbt.1529. - DOI - PMC - PubMed

Publication types