. 2023 Jan;20(198):20220075.
doi: 10.1098/rsif.2022.0075. Epub 2023 Jan 4.

The ensemble of gene regulatory networks at mutation-selection balance

Affiliations

The ensemble of gene regulatory networks at mutation-selection balance

Chia-Hung Yang et al. J R Soc Interface. 2023 Jan.

Abstract

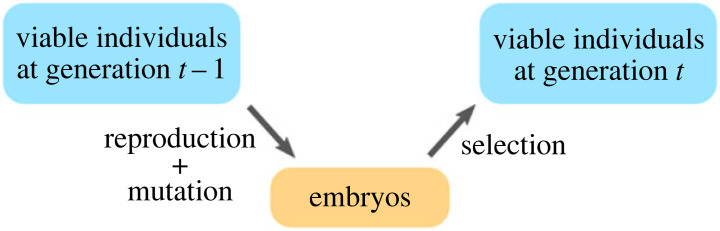
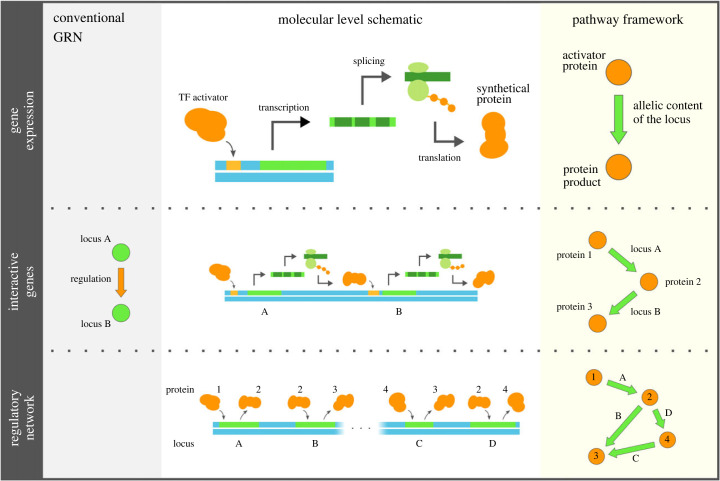
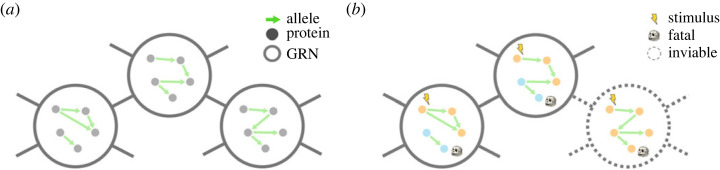
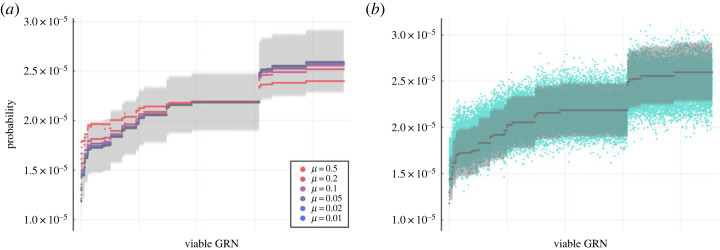
The evolution of diverse phenotypes both involves and is constrained by molecular interaction networks. When these networks influence patterns of expression, we refer to them as gene regulatory networks (GRNs). Here, we develop a model of GRN evolution analogous to work from quasi-species theory, which is itself essentially the mutation-selection balance model from classical population genetics extended to multiple loci. With this GRN model, we prove that-across a broad spectrum of selection pressures-the dynamics converge to a stationary distribution over GRNs. Next, we show from first principles how the frequency of GRNs at equilibrium is related to the topology of the genotype network, in particular, via a specific network centrality measure termed the eigenvector centrality. Finally, we determine the structural characteristics of GRNs that are favoured in response to a range of selective environments and mutational constraints. Our work connects GRN evolution to quasi-species theory-and thus to classical populations genetics-providing a mechanistic explanation for the observed distribution of GRNs evolving in response to various evolutionary forces, and shows how complex fitness landscapes can emerge from simple evolutionary rules.

Keywords: gene regulatory networks; mutation–selection balance; neutral network; quasi-species theory.


Figures

Figure 1.
Figure 1.
Illustrative cartoon of different stages in the proposed quasi-species model.
Figure 2.
Figure 2.
The pathway framework interprets a GRN as an abstraction of the expression behaviour of the genotype. In this framework, a GRN consists of edges indicating the input–output pair of a gene’s expression, from which transcriptional regulation between genes can be recovered, and it is arguably a more compact representation than the conventional notion of GRNs.
Figure 3.
Figure 3.
(a) Genotype network of GRNs, where, under the pathway framework, two mega-nodes (GRNs) are connected if and only if thy differ by one edge rewiring. (b) Neutral network of GRNs, where inviable mega-nodes are removed from the genotype network. In this illustrative example inviability is modelled as a regulatory pathway from the stimulus to the protein product with a fatal effect.
Figure 4.
Figure 4.
Validation that the evolutionary dynamics of GRNs converges to the derived stationary distribution (3.9). We compare the predicted stationary distribution of viable GRNs under the rare-mutation approximation with (a) the exact leading eigenvector of the transition matrix (3.7) with various per-locus mutation probability μ (coloured by a red-purple gradient from large to small) and (b) the distribution of GRNs sampled from their simulated evolutionary dynamics with μ = 0.1 (blue). The predicted distribution under the limit μ → 0 is coloured in grey, and the shaded area shows its 95% confidence band that accounts for the uncertainty of finite-sized sampling in the simulations. In both panels, the viable GRNs are ordered increasingly by their predicted probability to be observed.
Figure 5.
Figure 5.
GRN that has the largest eigenvector centrality in the neutral network for different environmental conditions (table 1) and among different constrained groups of GRNs (table 2). For each prevalent GRN, its pathway framework representation is plotted by the circles and the labelled arrows, while its conventional representation is drawn through the rectangles and the unlabelled arrows. A node is coloured in orange if the protein/gene is present/activated and in blue otherwise.

Similar articles

Cited by

References

    1. Hoekstra HE, Coyne JA. 2007. The locus of evolution: evo devo and the genetics of adaptation. Evolution 61, 995-1016. (10.1111/j.1558-5646.2007.00105.x) - DOI - PubMed
    1. Carroll SB. 2008. Evo-devo and an expanding evolutionary synthesis: a genetic theory of morphological evolution. Cell 134, 25-36. (10.1016/j.cell.2008.06.030) - DOI - PubMed
    1. Yeaman S, Whitlock MC. 2011. The genetic architecture of adaptation under migration–selection balance. Evolution 65, 1897-1911. (10.1111/evo.2011.65.issue-7) - DOI - PubMed
    1. Cohen AA, Martin LB, Wingfield JC, McWilliams SR, Dunne JA. 2012. Physiological regulatory networks: ecological roles and evolutionary constraints. Trends Ecol. Evol. 27, 428-435. (10.1016/j.tree.2012.04.008) - DOI - PubMed
    1. Nelson TC, Jones MR, Velotta JP, Dhawanjewar AS, Schweizer RM. 2019. Unveiling connections between genotype, phenotype, and fitness in natural populations. Mol. Ecol. 28, 1866-1876. (10.1111/mec.2019.28.issue-8) - DOI - PMC - PubMed

Publication types

LinkOut - more resources