. 2023 Jan;20(198):20220553.
doi: 10.1098/rsif.2022.0553. Epub 2023 Jan 4.

Protein-protein complexes can undermine ultrasensitivity-dependent biological adaptation

Affiliations

Protein-protein complexes can undermine ultrasensitivity-dependent biological adaptation

C Jeynes-Smith et al. J R Soc Interface. 2023 Jan.

Abstract

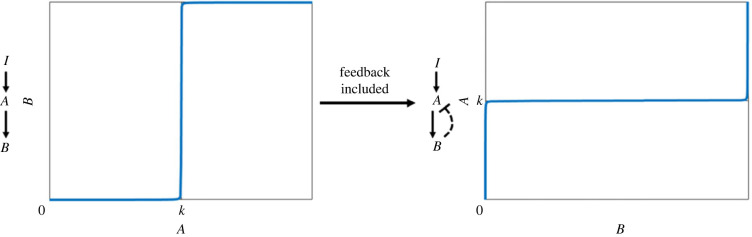
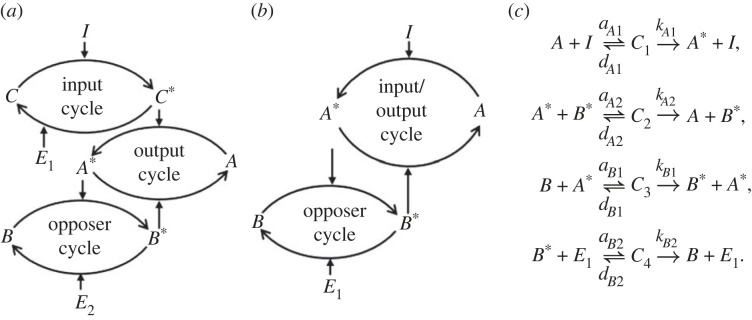
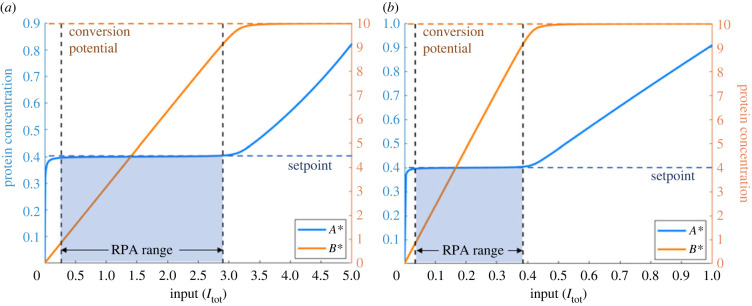
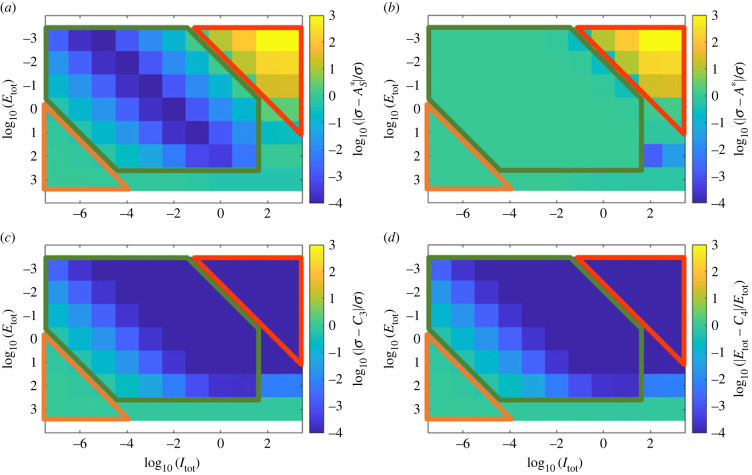
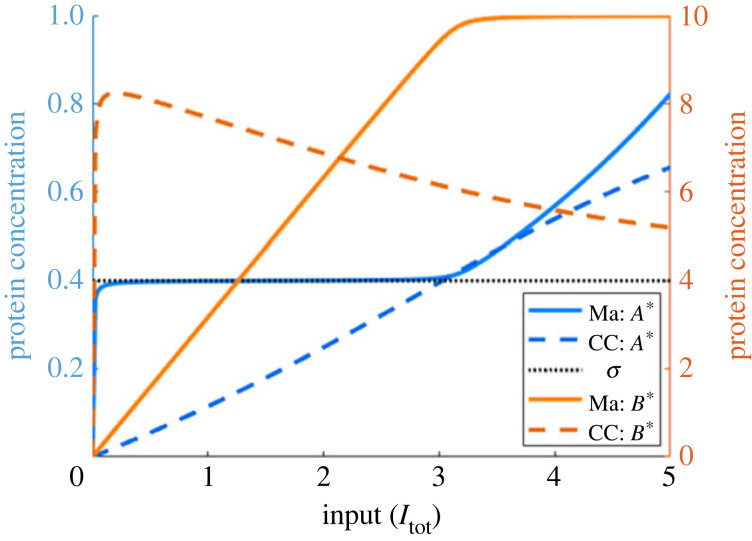
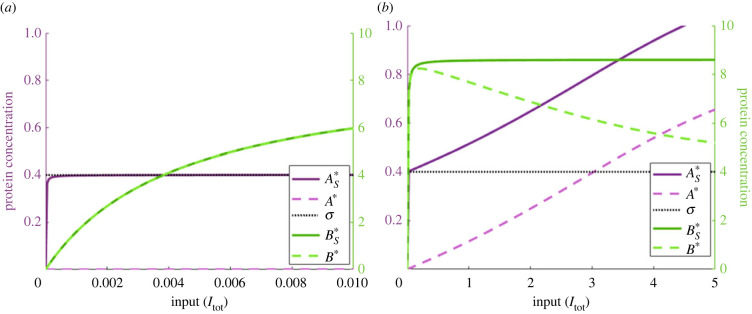
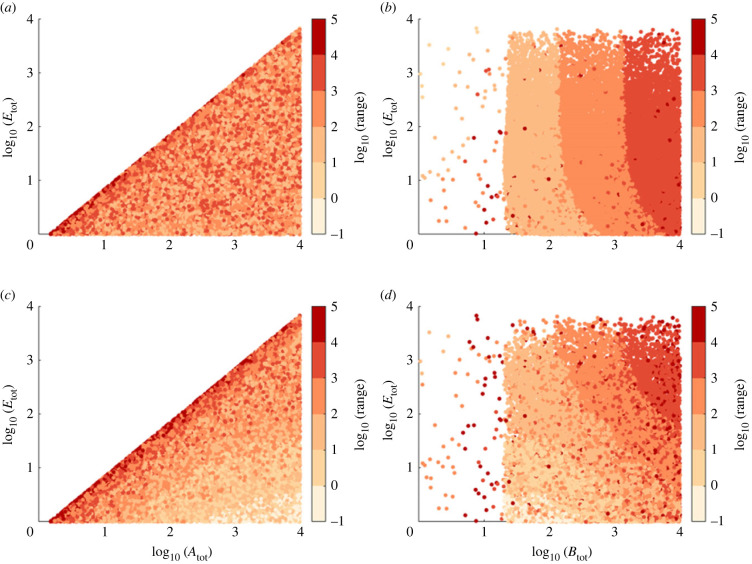
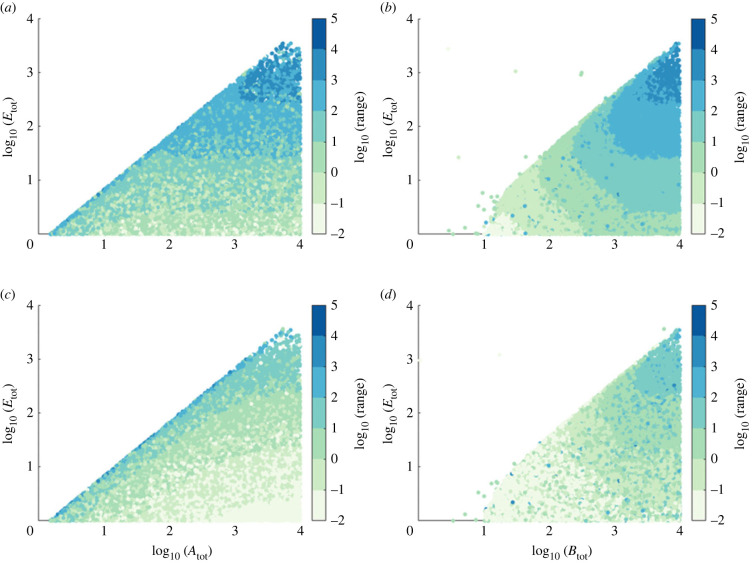
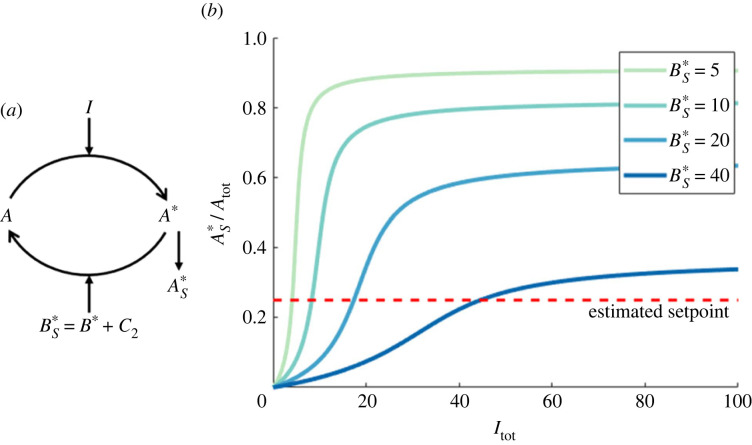
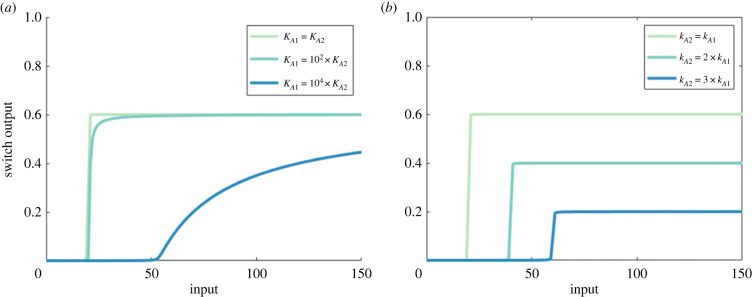
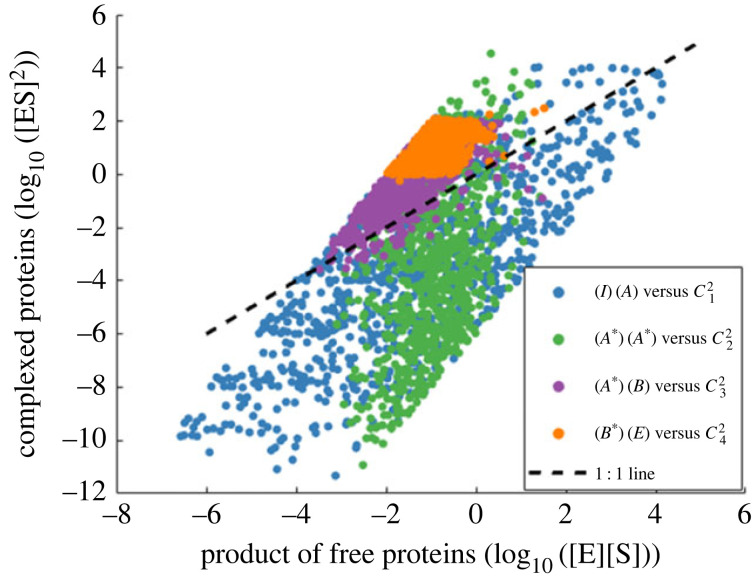
Robust perfect adaptation (RPA) is a ubiquitously observed signalling response across all scales of biological organization. A major class of network architectures that drive RPA in complex networks is the Opposer module-a feedback-regulated network into which specialized integral-computing 'opposer node(s)' are embedded. Although ultrasensitivity-generating chemical reactions have long been considered a possible mechanism for such adaptation-conferring opposer nodes, this hypothesis has relied on simplified Michaelian models, which neglect the presence of protein-protein complexes. Here we develop complex-complete models of interlinked covalent-modification cycles with embedded ultrasensitivity, explicitly capturing all molecular interactions and protein complexes. Strikingly, we demonstrate that the presence of protein-protein complexes thwarts the network's capacity for RPA in any 'free' active protein form, conferring RPA capacity instead on the concentration of a larger protein pool consisting of two distinct forms of a single protein. We further show that the presence of enzyme-substrate complexes, even at comparatively low concentrations, play a crucial and previously unrecognized role in controlling the RPA response-significantly reducing the range of network inputs for which RPA can obtain, and imposing greater parametric requirements on the RPA response. These surprising results raise fundamental new questions as to the biochemical requirements for adaptation-conferring Opposer modules within complex cellular networks.

Keywords: Michaelis–Menten; chemical reaction networks; feedback; mass-action; robust perfect adaptation; ultrasensitivity.


Figures

Figure 1.
Figure 1.
The relationship between ultrasensitivity and RPA. In an open-loop signalling cascade (left), an ultrasensitivity-generating mechanism at the level of a single protein (B) creates a reversible switch whereby the output can exist in either a low activity state, or a high activity state, with a vanishingly narrow transition zone (for Ak) between the two states. If this ultrasensitivity-generating mechanism is embedded into a negative feedback loop (right), the narrow transition zone for the ultrasensitive switch is converted into a narrow tolerance around an RPA setpoint (k) for the upstream molecule A.
Figure 2.
Figure 2.
Network diagrams for (a) the three-node network analysed by Ma et al. [7] and (b) the corresponding reduced two-node network with a single node representing both input and output. (c) The graph structure for the set of chemical reactions corresponding to the network in (b), from which either complex-complete mass-action equations [48] or simplified Michaelis–Menten equations (neglecting all protein–protein complexes) can be derived. In each case, the active form of protein X is denoted X*. The four intermediate protein–protein complexes are denoted by C1, C2, C3 and C4. The association, dissociation and catalytic rate constants are given by ai, di and ki, respectively, as shown.
Figure 3.
Figure 3.
Example simulations of (a) the Ma et al. model [7] using equations (1.1) and (1.2), and (b) the Ferrell model [5], employing parameter sets used by Ma et al. and Ferrell. We highlight the range of input values over which the RPA property can be observed, i.e. the ‘RPA range’. The beginning of this range is determined by the value of input when A* is first within 1% of the estimated setpoint (dark blue dashed line), and ends when A* deviates from the setpoint by more than 1% and B* reaches the conversion potential (dark orange dashed line). Parameters: Atot = Btot = 10, Etot = 1, kA1 = kA2 = 200, kB1 = 10, kB2 = 4, KA1 = KA2 = 1 and KB1 = KB2 = 0.01. Ferrell [5] equations: dA*/dt = kA1 Itot (AtotA*) − kA2 B*A*, dB*/dt = kB1 A*(BtotB*)/(KB1 + BtotB* )− kB2 Etot B*/(KB2 + B*).
Figure 4.
Figure 4.
Comparison of protein concentrations for a wide range of input values (Itot) and total enzyme abundances (Etot), during three phases of the network response: prior to RPA (orange region), during RPA (green region), and after RPA has been lost (red region). We demonstrate the abundances (relative to σ) of: (a) the total input to the opposer cycle, AS; (b) the free, active output protein, A*; (c) the complex C3 and (d) the complex C4 relative to the total enzyme abundance, Etot. Each heatmap represents the logged relative error of the proteins indicated in the label. As shown, RPA is associated with the conditions AS=C3=σ, with A* = 0, and C4 = Etot. Parameters: Atot = Btot = 200, kA1 = kA2 = 200, kB1 = 10, kB2 = 4, KA1 = KA2 = 1, KB1 = KB2 = 0.01, dA1 = dA2 = dB1 = dB2 = 1 and ai = (di + ki)/Ki.
Figure 5.
Figure 5.
Free active protein forms in the Ma et al. (solid lines) [7] and complex-complete (CC) (dashed lines) models under the same parameter regime. Parameters: Atot = Btot = 10, Etot = 1, kA1 = kA2 = 200, kB1 = 10, kB2 = 4, KA1 = KA2 = 1, KB1 = KB2 = 0.01, dA1 = dA2 = dB1 = dB2 = 1 and ai = (di + ki)/Ki.
Figure 6.
Figure 6.
Comparison of the free active proteins (dashed lines) and the corresponding total active protein pools (comprising free protein plus complex with downstream substrate, solid lines) in the complex-complete model, for two input ranges: (a) Itot ∈ [0, 10−2] and (b) Itot ∈ [0, 5] (as seen in figure 5). The total active protein pools are given by: AS=A+C3 and BS=B+C2. In (a), we restrict the input domain in order to demonstrate how the complex-complete network is capable of achieving RPA, while (b) demonstrates the deviation of the output from the estimated setpoint. Parameters: Atot = Btot = 10, Etot = 1, kA1 = kA2 = 200, kB1 = 10, kB2 = 4, KA1 = KA2 = 1, KB1 = KB2 = 0.01, dA1 = dA2 = dB1 = dB2 = 1 and ai = (di + ki)/Ki.
Figure 7.
Figure 7.
The influence of total substrate and enzyme abundances on RPA capacity in the Michaelian (Ma et al. [7]) model for two sensitivity regimes in the input/output cycle: (a,b) low sensitivity (KA1 = 700, KA2 = 500) and (c,d) high sensitivity (KA1 = 7, KA2 = 5). When RPA obtains, the RPA range is indicated by colour. As shown, the Michaelian model of RPA imposes strict constraints on Atot relative to Etot (a,c), with no constraints on Btot (b,d). However, Btot exerts a significant influence on the RPA range. Parameters: kA1 = 7, kA2 = 5, kB1 = 2, kB2 = 3, KB1 = 2 × 10⁻² and KB2 = 3 × 10⁻².
Figure 8.
Figure 8.
The influence of total substrate and enzyme abundances on RPA capacity in the complex-complete model for two sensitivity regimes in the input/output cycle: (a,b) low sensitivity (KA1 = 700, KA2 = 500) and (c,d) high sensitivity (KA1 = 7, KA2 = 5). When RPA obtains, the RPA range is indicated by colour. As shown, the complex-complete model of RPA imposes strict constraints on all total protein abundances, all of which can also affect the RPA range. Parameters: kA1 = 7, kA2 = 5, kB1 = 2, kB2 = 3, KA1 = 7, KA2 = 5, and KB1 = 2 × 10⁻², KB2 = 3 × 10⁻², dA1 = dA2 = dB1 = dB2 = 1 and ai = (di + ki)/Ki.
Figure 9.
Figure 9.
(a) The input/output cycle, considered as a single reversible covalent-modification cycle. (b) The dose response profile for this cycle, for varying enzyme abundances, BS. As shown, increasing BS increases the amount of input (Itot) required to generate a particular output value for AS. When considering the maximum possible value that BS can take (as determined by the opposer cycle in the full system), the intersection of a curve with the estimated setpoint line indicates the maximum value of Itot for which RPA obtains. If the maximum possible value of BS is reduced (lighter curves), the maximum possible value of Itot for which RPA obtains is reduced commensurately, thereby reducing the RPA range. Parameters: Atot = 100, kA1 = kA2 = kB1 = kB2 = 1, KA1 = KA2 = 0.01, dA1 = dA2 = 1 and ai = (di + ki)/Ki.
Figure 10.
Figure 10.
Increasing Etot relative to Atot and Btot in both the Ma et al. [7] and complex-complete models results in the convergence of the RPA ranges across the two model types. For each parameter choice, we compare the RPA ranges predicted by the two different models, in each case dividing the larger range by the smaller range. Note that the RPA range for the Michaelian model is always the larger of the two. The log of this result is thus greater than zero, and the closer to zero (light yellow) the result becomes, the more similar are the RPA ranges for the two models. Parameters shown here: kA1 = 7, kA2 = 5, kB1 = 2, kB2 = 3, KA1 = 7, KA2 = 5, KB1 = 2 × 10⁻², KB2 = 3 × 10⁻², Etot, Atot, Btot ∈ [1, 104], dA1 = dA2 = dB1 = dB2 = 1 and ai = (di + ki)/Ki.
Figure 11.
Figure 11.
Histograms of (a) RPA versus (b) non-RPA responses for varying Michaelis constants in the opposer cycle. Small Michaelis constants are a necessary, but insufficient, condition for generating the RPA response. One hundred thousand simulations were run with Michaelis constants being randomly selected from 10−3 to 104. Parameters: Atot = Btot = 10, Etot = 1, kA1 = kA2 = kB1 = kB2 = 1, dA1 = dA2 = dB1 = dB2 = 1 and ai = (di + ki)/Ki.
Figure 12.
Figure 12.
Histograms of the input/output cycle Michaelis constants (ac), and catalytic constants (df), which were associated with RPA, grouped by the magnitude of the RPA range. As shown, smaller values of KA2 and kA1, and larger values of KA1 and kA2 are associated with larger RPA ranges. One hundred thousand simulations were run with Michaelis constants or catalytic constants being randomly selected from 10−3 to 104. Parameters: Atot = Btot = 10, Etot = 1, KA1 = KA2 = 1 (except where noted otherwise), KB1 = KB2 = 0.01, kA1 = kA2 = kB1 = kB2 = 1 (except where noted otherwise), dA1 = dA2 = dB1 = dB2 = 1 and ai = (di + ki)/Ki.
Figure 13.
Figure 13.
The role of (a) Michaelis constants and (b) catalytic constants in a single reversible covalent-modification cycle. Parameters: Atot = 100, Etot = 20, dA1 = dA2 = 1 and ai = (di + ki)/Ki, (a) kA1 = kA2 = 1, KA2 = 0.01, KA1 ∈ {0.01, 1, 100} (light to dark curves), (b) KA1 = KA2 = 0.01, kA2 = 1, kA2 ∈ {1, 2, 3} (light to dark curves).
Figure 14.
Figure 14.
A comparison of the product of free enzyme and free substrate concentrations ([E][S]), with the square of their corresponding complex concentration ([ES]2). The tQSSA assumption employed by Ma et al. [7] in their simplified mass action analysis requires that for any enzyme–substrate interaction, [ES]2 ≪ [E][S]. As shown, this condition never holds for the interactions between A* and B (with corresponding complex C3), or between B* with E (with corresponding complex C4), and only rarely holds for the other enzyme–substrate interactions of the models (involving complexes C1 and C2). Each point shown above corresponds to a steady-state concentration obtained from model simulations using the parameter sampling discussed in our Methods section.

Similar articles

Cited by

References

    1. Araujo RP, Liotta LA. 2006. A control theoretic paradigm for cell signaling networks: a simple complexity for a sensitive robustness. Curr. Opin Chem. Biol. 10, 81-87. (10.1016/j.cbpa.2006.01.002) - DOI - PubMed
    1. Araujo RP, Liotta LA. 2018. The topological requirements for robust perfect adaptation in networks of any size. Nat. Commun. 9, 1-12. (10.1038/s41467-018-04151-6) - DOI - PMC - PubMed
    1. Araujo RP, Liotta LA, Petricoin EF. 2007. Proteins, drug targets and the mechanisms they control: the simple truth about complex networks. Nat. Rev. Drug Discov. 6, 871-880. (10.1038/nrd2381) - DOI - PubMed
    1. Araujo RP, Vittadello ST, Stumpf MPH. 2021. Bayesian and algebraic strategies to design in synthetic biology. Proc. IEEE 110, 675-687. (10.1109/JPROC.2021.3129527) - DOI
    1. Ferrell JE Jr. 2016. Perfect and near-perfect adaptation in cell signaling. Cell Syst. 2, 62-67. (10.1016/j.cels.2016.02.006) - DOI - PubMed

Publication types

LinkOut - more resources