. 2023 Feb;20(2):158-174.
doi: 10.1038/s41423-022-00963-1. Epub 2023 Jan 4.

TRIM27 maintains gut homeostasis by promoting intestinal stem cell self-renewal

Affiliations

TRIM27 maintains gut homeostasis by promoting intestinal stem cell self-renewal

Jing Wang et al. Cell Mol Immunol. 2023 Feb.

Abstract

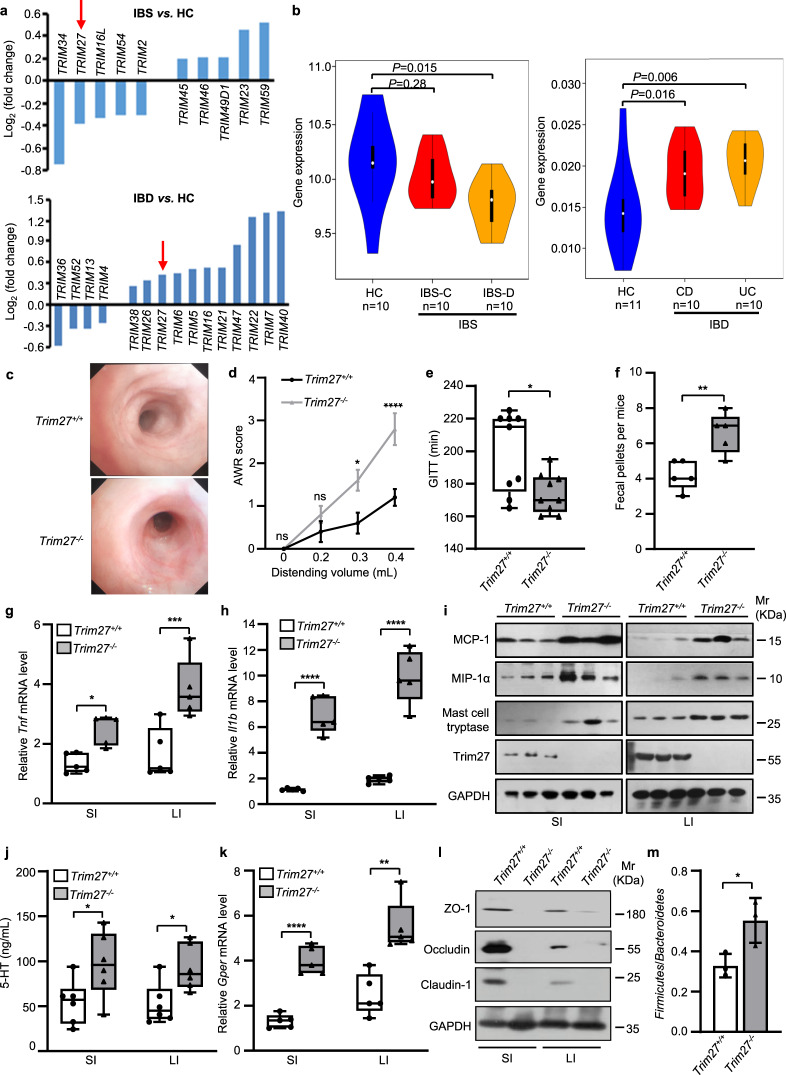
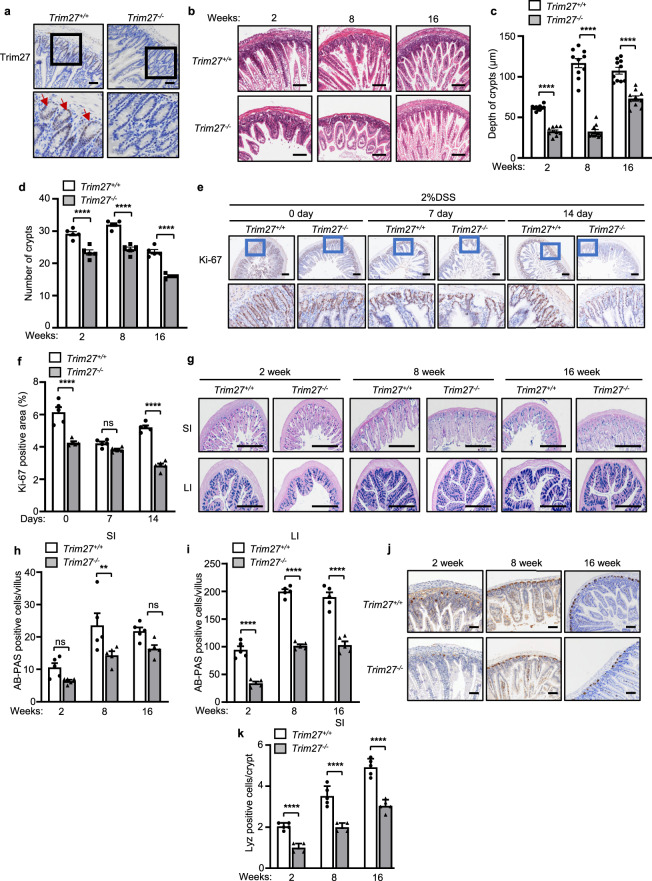
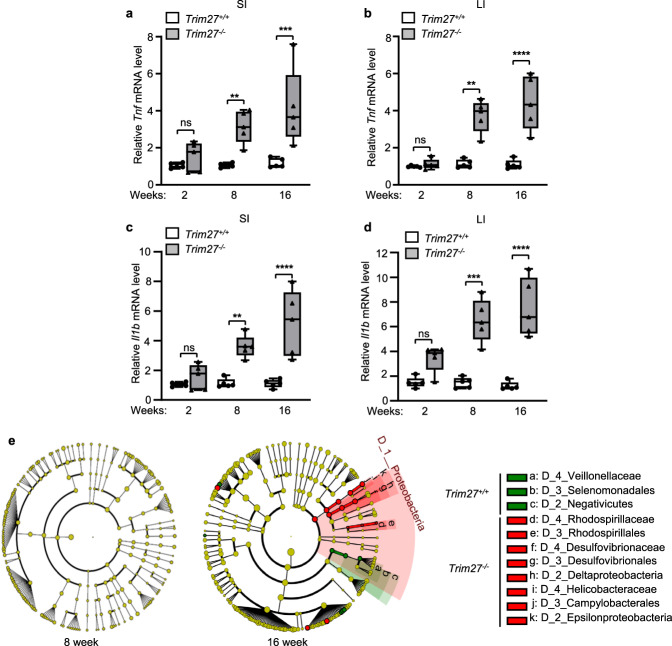
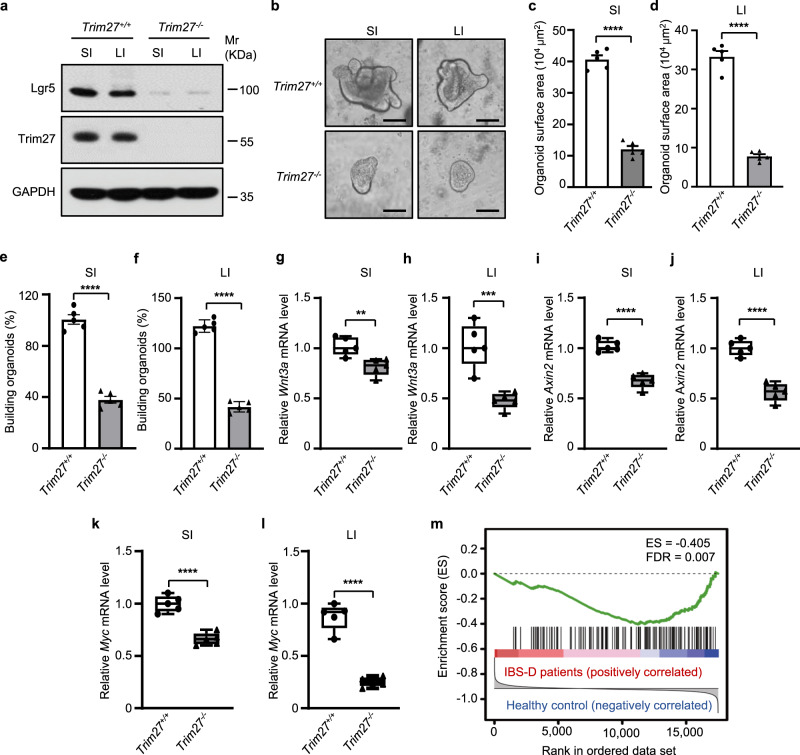
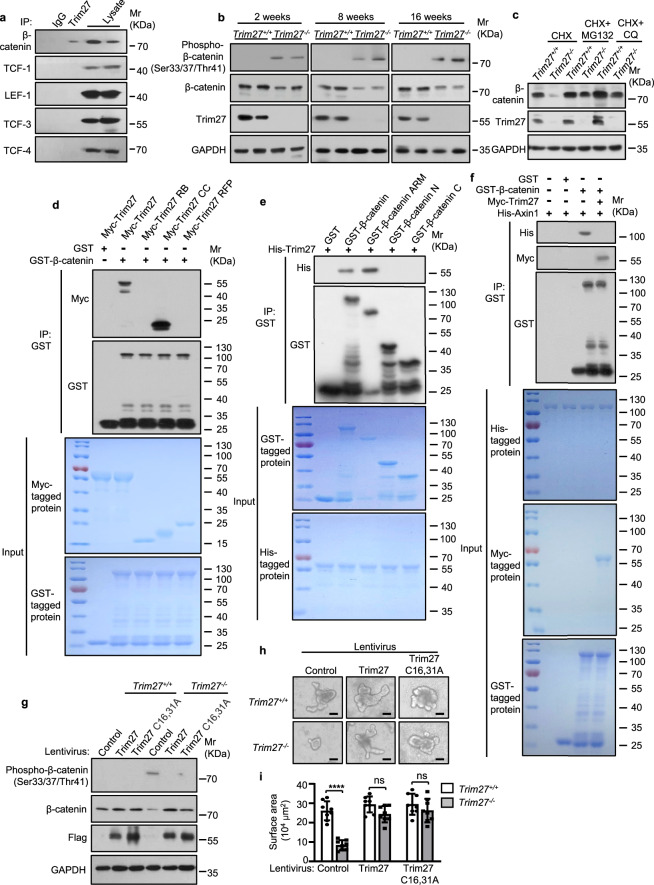
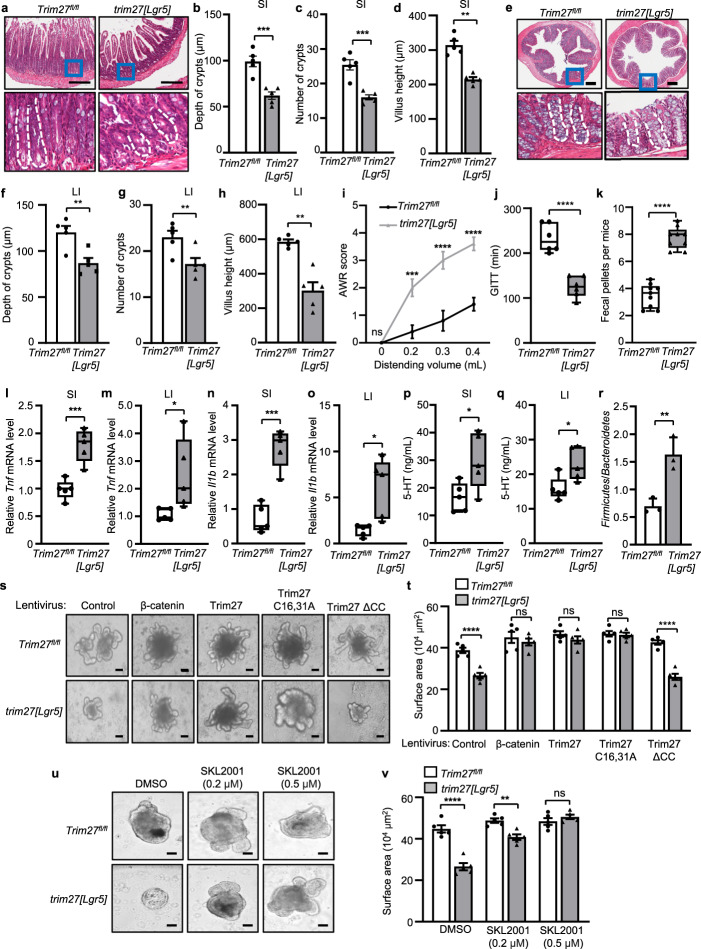
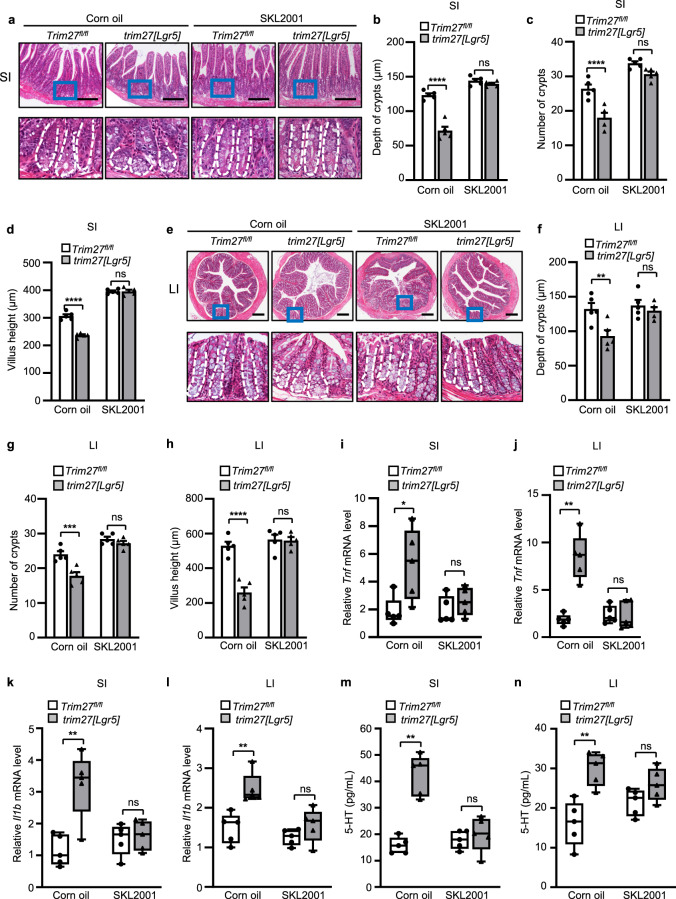
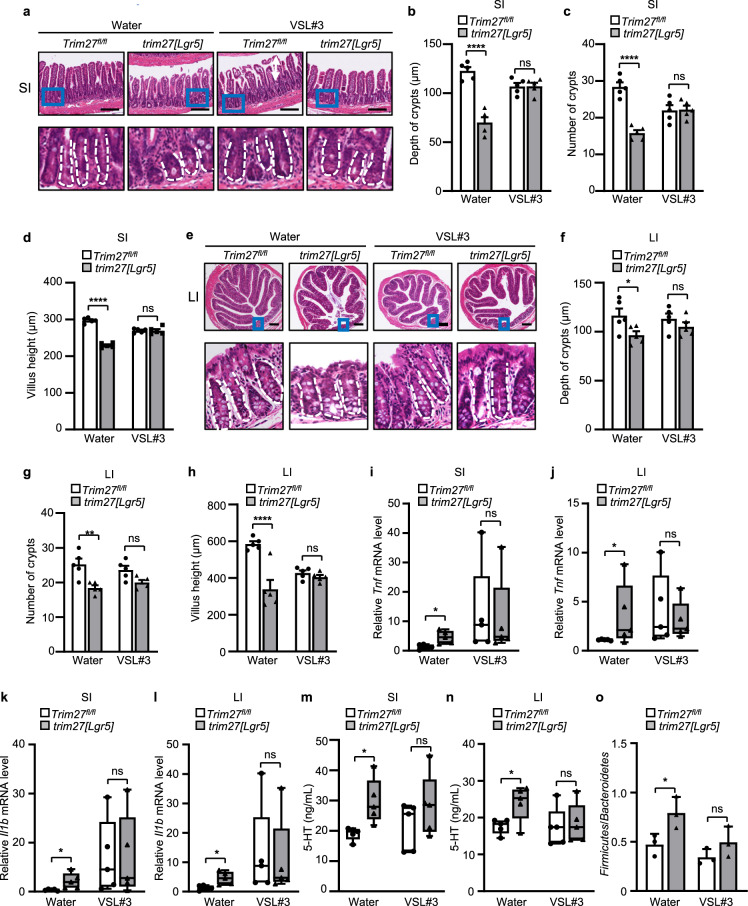
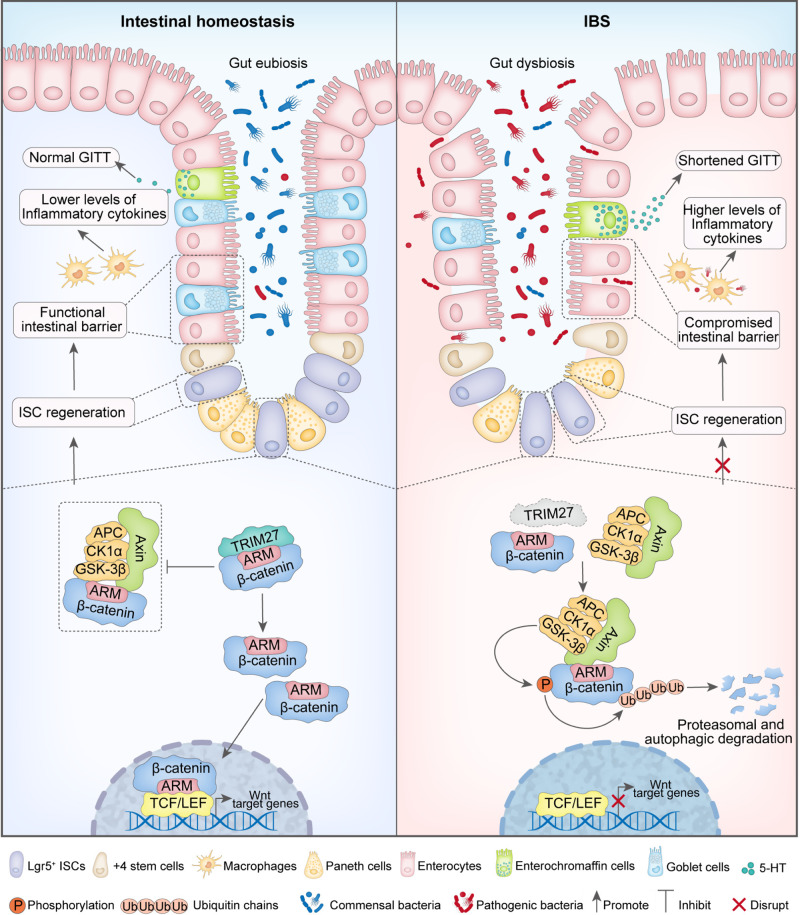
Dysregulation of gut homeostasis is associated with irritable bowel syndrome (IBS), a chronic functional gastrointestinal disorder affecting approximately 11.2% of the global population. The poorly understood pathogenesis of IBS has impeded its treatment. Here, we report that the E3 ubiquitin ligase tripartite motif-containing 27 (TRIM27) is weakly expressed in IBS but highly expressed in inflammatory bowel disease (IBD), a frequent chronic organic gastrointestinal disorder. Accordingly, knockout of Trim27 in mice causes spontaneously occurring IBS-like symptoms, including increased visceral hyperalgesia and abnormal stool features, as observed in IBS patients. Mechanistically, TRIM27 stabilizes β-catenin and thus activates Wnt/β-catenin signaling to promote intestinal stem cell (ISC) self-renewal. Consistent with these findings, Trim27 deficiency disrupts organoid formation, which is rescued by reintroducing TRIM27 or β-catenin. Furthermore, Wnt/β-catenin signaling activator treatment ameliorates IBS symptoms by promoting ISC self-renewal. Taken together, these data indicate that TRIM27 is critical for maintaining gut homeostasis, suggesting that targeting the TRIM27/Wnt/β-catenin axis could be a potential treatment strategy for IBS. Our study also indicates that TRIM27 might serve as a potential biomarker for differentiating IBS from IBD.

Keywords: IBS; ISC self-renewal; TRIM27; Wnt/β-catenin signaling.


Conflict of interest statement

The authors declare no competing interests.

Figures

Fig. 1
Fig. 1
TRIM27 deficiency induces spontaneous IBS-like symptoms. a Changes in the expression levels of TRIM family genes in patients with IBS and IBD compared with healthy controls (HCs), as determined by microarray analysis. b Comparison of TRIM27 gene expression in patients with IBS-C and IBS-D with that in HCs (left) and in patients with CD and UC with that in HCs (right). c Endoscopic images of colons from 16-week-old Trim27+/+ and Trim27-/- mice (n = 5). d The AWR scores of 16-week-old Trim27+/+ and Trim27-/- mice in response to graded colorectal distention (0, 0.2, 0.3 and 0.4 mL). e GITT of 16-week-old Trim27+/+ and Trim27-/- mice. f The number of fecal pellets excreted from Trim27+/+ and Trim27-/- mice every hour. g, h Quantitative PCR (qPCR) analysis of Tnf (g) and Il1b (h) mRNA levels in the small intestine (SI) and large intestine (LI) from 16-week-old Trim27+/+ and Trim27-/- mice. i Immunoblot analysis of MCP-1, MIP-1α, mast cell tryptase, Trim27 and GAPDH protein levels in the SI and LI from 16-week-old Trim27+/+ and Trim27-/- mice. j Enzyme-linked immunosorbent assay (ELISA) of 5-HT in the SI and LI from 16-week-old Trim27+/+ and Trim27-/- mice. k qPCR analysis of the G protein-coupled estrogen receptor (Gper) mRNA level in the SI and LI from 16-week-old Trim27+/+ and Trim27-/- mice. l Immunoblot analysis of ZO-1, Occludin, Claudin-1 and GAPDH protein levels in the SI and LI from 16-week-old Trim27+/+ and Trim27-/- mice. m The ratio of the Firmicutes to Bacteroidetes in the colonic contents from 16-week-old Trim27+/+ and Trim27-/- mice. In b, d, e, f, g, h, j, k and m, statistical analyses were performed using the Wilcoxon rank-sum test with the Benjamini–Hochberg method (b), two-way ANOVA with Sidak’s multiple comparisons test (d) and unpaired two-tailed Student’s t test (eh, j, k, m). The data are shown as the means ± SEMs (d, n = 5; m, n = 3) or in box-and-whisker plots displaying the medians, interquartile ranges (boxes) and minima and maxima (whiskers) (e, n = 9; f, g, h, k, n = 5; j, n = 6). P > 0.05, not significant (ns); *P < 0.05; **P < 0.01; ***P < 0.001; ****P < 0.0001
Fig. 2
Fig. 2
TRIM27 promotes the development and regeneration of intestinal tissues. a Immunohistochemical analysis of Trim27 expression in the SI from Trim27+/+ and Trim27-/- mice. Bottom, enlarged images of the regions outlined in the upper panels. The red arrows indicate Trim27-positive cells. Scale bars, 150 μm. b H&E staining of the SI from 2–16-week-old Trim27+/+ and Trim27-/- mice. Scale bars, 150 μm. c, d Crypt depth (c) and number of crypts per mm (d). At least 20 randomly selected crypts (c) or randomly selected fields (d) from the SI of each mouse were analyzed, and the average was calculated. Ten mice per group were analyzed. e Ki-67 staining of the SI from 16-week-old Trim27+/+ and Trim27-/- mice after treatment with 2% DSS (top). Bottom, enlarged images of the regions outlined in the upper panels. Scale bars, 150 μm. f Ki-67-positive area in the intestinal tissues described in e. Five mice per group were analyzed. g Alcian blue-periodic acid–Schiff (AB-PAS) staining of the SI and LI from 2–16-week-old Trim27+/+ and Trim27-/- mice. Scale bars, 500 μm. h, i The number of AB-PAS-positive goblet cells per villus in the SI (h) and LI (i) as described in g. At least 20 randomly selected villi from the small intestine of each mouse were analyzed, and the average was calculated. Five mice per group were analyzed. j Immunohistochemical analysis of lysozyme expression in small intestinal tissue sections from 2–16-week-old Trim27+/+ and Trim27-/- mice. Scale bars, 100 μm. k The number of lysozyme-positive Paneth cells per crypt in the SI as described in j. At least 20 randomly selected crypts from the SI of each mouse were analyzed, and the average was calculated. Five mice per group were analyzed. In c, d, f, h, i and k, statistical analyses were performed using two-way ANOVA with Sidak’s multiple comparisons test. The data are presented as the means ± SEMs (c, n = 10; d, f, h, i, k, n = 5). P > 0.05, not significant (ns); **P < 0.01; ****P < 0.0001
Fig. 3
Fig. 3
TRIM27 deficiency causes enhanced intestinal inflammation and gut dysbiosis over time. a, b qPCR analysis of Tnf mRNA expression in the SI (a) and LI (b) from 2–16-week-old Trim27+/+ and Trim27-/- mice. c, d qPCR analysis of Il1b mRNA expression in the SI (c) and LI (d) from 2–16-week-old Trim27+/+ and Trim27-/- mice. e Taxonomic cladogram generated via linear discriminant analysis effect size (LEfSe) analysis showing the bacterial taxa (phylum, class, order and family) in 8-week-old (left) and 16-week-old (right) Trim27+/+ and Trim27-/- mice. Green and red indicate an increased abundance in Trim27+/+ and Trim27-/- mice, respectively. In ad, statistical analyses were performed using two-way ANOVA with Sidak’s multiple comparisons test. The data are shown as box-and-whisker plots displaying the medians, interquartile ranges (boxes) and minima and maxima (whiskers) (ad, n = 5). P > 0.05, not significant (ns); **P < 0.01; ***P < 0.001; ****P < 0.0001
Fig. 4
Fig. 4
TRIM27 promotes the activation of Wnt/β-catenin signaling in intestinal crypts. a Immunoblot analysis of the Lgr5 protein level in intestinal tissues from 16-week-old Trim27+/+ and Trim27-/- mice. b Representative images of small intestinal and large intestinal organoids formed by crypts of 16-week-old Trim27+/+ and Trim2-/- mice. Scale bars, 200 μm. c, d Quantification of the surface area of small intestinal (c) and large intestinal (d) organoids formed by crypts as described in b. Five randomly selected organoids were analyzed per group. e, f The small intestinal (e) and large intestinal (f) organoid-forming efficiency of crypts as described in b. Five randomly selected microscopic fields were analyzed per group. g, h qPCR analysis of Wnt3a mRNA expression in intestinal crypts isolated from the SI (g) and LI (h) of 16-week-old Trim27+/+ and Trim27-/- mice. i, j qPCR analysis of Axin2 mRNA expression in intestinal crypts isolated from the SI (i) and LI (j) of mice as described in g. k, l qPCR analysis of Myc mRNA expression in intestinal crypts isolated from the SI (k) and LI (l) of mice as described in g. m Gene set enrichment analysis (GSEA) results for the Wnt signaling pathway in IBS-D. FDR, false discovery rate. In cl, statistical analyses were performed using unpaired two-tailed Student’s t test. The data are presented as the means ± SEMs (cf, n = 5) or in box-and-whisker plots displaying the medians, interquartile ranges (boxes) and minima and maxima (whiskers) (gl, n = 5). **P < 0.01; ***P < 0.001; ****P < 0.0001
Fig. 5
Fig. 5
TRIM27 stabilizes β-catenin to activate Wnt/β-catenin signaling in ISCs. a Immunoprecipitation (IP) of β-catenin, TCF-1, LEF-1, TCF-3 and TCF-4 by Trim27 in crypts from 16-week-old Trim27+/+ mice. Crypts were lysed and immunoprecipitated with an anti-Trim27 antibody. b Immunoblot analysis of phospho-β-catenin (Ser33/37/Thr41), β-catenin, Trim27 and GAPDH protein levels in crypts from 2–16-week-old Trim27+/+ and Trim27-/- mice. c Immunoblot analysis of β-catenin, Trim27 and GAPDH protein levels in crypts from 16-week-old Trim27+/+ and Trim27-/- mice after treatment with cycloheximide (CHX, 10 μM), CHX in combination with MG132 (5 μM) or CHX in combination with chloroquine (CQ, 20 μM) for 8 h. d Pulldown of Myc-tagged Trim27 (5 μg) or its truncations (3 μg each) by GST (3 μg) or GST-β-catenin (10 μg each). e Pulldown of His-tagged Trim27 (5 μg each) by GST (3 μg), GST-β-catenin (10 μg), GST-β-catenin ARM (8 μg), GST-β-catenin N (4 μg) or GST-β-catenin C (3 μg). f Pulldown of His-tagged Axin1 (10 μg each) by GST-β-catenin (10 μg each) in the presence or absence of Myc-tagged Trim27 (5 μg each). g Immunoblot analysis of phospho-β-catenin (Ser33/37/Thr41), β-catenin, Trim27 and GAPDH protein levels in crypts infected with control, Trim27 or Trim27 C16,31A lentivirus. h Representative images of organoids formed by crypts from 16-week-old Trim27+/+ and Trim27-/- mice in the presence of control, Trim27 or Trim27 C16,31A lentivirus. Scale bars, 200 μm. i Quantification of the surface area of organoids formed by crypts as described in h. Eight randomly selected organoids were analyzed per group. In i, statistical analyses were performed using two-way ANOVA with Sidak’s multiple comparisons test. The data are presented as the means ± SEMs (i, n = 8). P > 0.05, not significant (ns); ****P < 0.0001
Fig. 6
Fig. 6
TRIM27 maintains Lgr5+ ISC homeostasis. a H&E staining of the SI from 16-week-old Trim27fl/fl and trim27[Lgr5] mice. Bottom, enlarged images of the regions outlined in the upper panels. Scale bars, 300 μm. The white dashed lines mark crypt borders. bd Crypt depth (b), crypt number per mm (c) and villus height (d) in the SI from mice as described in a. At least 20 randomly selected crypts (b, d) or randomly selected fields (c) from the SI of each mouse were analyzed, and the average was calculated. Five mice per group were analyzed. e H&E staining of the LI from 16-week-old Trim27fl/fl and trim27[Lgr5] mice. Bottom, enlarged images of the regions outlined in the upper panels. Scale bars, 300 μm. The white dashed lines mark crypt borders. fh Crypt depth (f), crypt number per mm (g) and villus height (h) in the LI from mice as described in e. At least 20 randomly selected crypts (f, h) or randomly selected fields (g) from the LI of each mouse were analyzed, and the average was calculated. Five mice per group were analyzed. i The AWR scores of 16-week-old Trim27fl/fl and trim27[Lgr5] mice in response to graded colorectal distention (0, 0.2, 0.3 and 0.4 mL). j GITT of 16-week-old Trim27fl/fl and trim27[Lgr5] mice. k The number of fecal pellets excreted from Trim27fl/fl and trim27[Lgr5] mice every hour. l, m qPCR analysis of Tnf mRNA expression in the SI (l) and LI (m) from 16-week-old Trim27fl/fl and trim27[Lgr5] mice. n, o qPCR analysis of Il1b mRNA expression in the SI (n) and LI (o) from mice as described in l. p, q ELISA of 5-HT in the SI (p) and LI (q) from 16-week-old Trim27fl/fl and trim27[Lgr5] mice. r The ratio of Firmicutes to Bacteroidetes in the colonic contents from 16-week-old Trim27fl/fl and trim27[Lgr5] mice. s Representative images of organoids formed by crypts of 16-week-old Trim27fl/fl and trim27[Lgr5] mice in the presence of control-, β-catenin-, Trim27-, Trim27 C16,31A or Trim27 ΔCC lentivirus. Scale bars, 200 μm. t Quantification of the surface area of organoids formed by crypts from mice as described in s. Five randomly selected organoids were analyzed per group. u Representative images of organoids formed by crypts of 16-week-old Trim27fl/fl and trim27[Lgr5] mice treated with DMSO or various concentrations of SKL2001. Scale bars, 200 μm. v Quantification of the surface area of organoids formed by crypts from mice as described in u. Five randomly selected organoids were analyzed per group. In bd, fr, t and v, statistical analyses were performed using unpaired two-tailed Student’s t test (bd, fh and jr) or two-way ANOVA with Sidak’s multiple comparisons test (i, t and v). The data are presented as the means ± SEMs (bd, fi, t and v, n = 5; r, n = 3) or in box-and-whisker plots displaying the medians, interquartile ranges (boxes) and minima and maxima (whiskers) (j, n = 6; k, n = 9; lq, n = 5). P > 0.05, not significant (ns); *P < 0.05; **P < 0.01; ***P < 0.001; ****P < 0.0001
Fig. 7
Fig. 7
Treatment with a Wnt/β-catenin signaling activator alleviates TRIM27 deficiency-induced IBS symptoms. a H&E staining of the SI from 16-week-old Trim27fl/fl and trim27[Lgr5] mice fed corn oil or SKL2001. Bottom, enlarged images of the regions outlined in the upper panels. Scale bars, 300 μm. The white dashed lines mark crypt borders. bd Crypt depth (b), crypt number per mm (c) and villus height (d) in the SI from mice as described in a. At least 20 randomly selected crypts (b, d) or randomly selected fields (c) from the SI of each mouse were analyzed, and the average was calculated. Five mice per group were analyzed. e H&E staining of the LI from 16-week-old Trim27fl/fl and trim27[Lgr5] mice fed corn oil or SKL2001. Bottom, enlarged images of the regions outlined in the upper panels. Scale bars, 300 μm. The white dashed lines mark crypt borders. fh Crypt depth (f), crypt number per mm (g) and villus height (h) of the LI from mice as described in e. At least 20 randomly selected crypts (f, h) or randomly selected fields (g) from the LI of each mouse were analyzed, and the average was calculated. Five mice per group were analyzed. i, j qPCR analysis of Tnf mRNA expression in the SI (i) and LI (j) from mice as described in a. k, l qPCR analysis of Il1b mRNA expression in the SI (k) and LI (l) from mice as described in a. m, n ELISA of 5-HT in the SI (m) and LI (n) from mice as described in a. In bd and fn, statistical analyses were performed using two-way ANOVA with Sidak’s multiple comparisons test. The data are presented as the means ± SEMs (bd and fh, n = 5) or in box-and-whisker plots displaying the medians, interquartile ranges (boxes) and minima and maxima (whiskers) (in, n = 5). P > 0.05, not significant (ns); *P < 0.05; **P < 0.01; ***P < 0.001; ****P < 0.0001
Fig. 8
Fig. 8
Probiotic supplementation alleviates TRIM27 deficiency-induced IBS symptoms. a H&E staining of the SI from 16-week-old Trim27fl/fl and trim27[Lgr5] mice fed VSL#3 daily. Bottom, enlarged images of the regions outlined in the upper panels. Scale bars, 300 μm. The white dashed lines mark crypt borders. bd Crypt depth (b), crypt number per mm (c) and villus height (d) in the SI from mice as described in a. At least 20 randomly selected crypts (b, d) or randomly selected fields (c) from the SI of each mouse were analyzed, and the average was calculated. Five mice per group were analyzed. e H&E staining of the LI from 16-week-old Trim27fl/fl and trim27[Lgr5] mice fed VSL#3 daily. Bottom, enlarged images of the regions outlined in the upper panels. Scale bars, 300 μm. The white dashed lines mark crypt borders. fh Crypt depth (f), crypt number per mm (g) and villus height (h) in the LI from mice as described in e. At least 20 randomly selected crypts (f, h) or randomly selected fields (g) from the LI of each mouse were analyzed, and the average was calculated. Five mice per group were analyzed. i, j qPCR analysis of Tnf mRNA expression in the SI (i) and LI (j) from mice as described in a. k, l qPCR analysis of Il1b mRNA expression in the SI (k) and LI (l) from mice as described in a. m, n ELISA of 5-HT in the SI (m) and LI (n) from mice as described in a. o The ratio of Firmicutes to Bacteroidetes in the colonic contents from mice as described in a. In bd and fo, statistical analyses were performed using two-way ANOVA with Sidak’s multiple comparisons test. The data are presented as the means ± SEMs (bd and fh, n = 5; o, n = 3) or in box-and-whisker plots displaying the medians, interquartile ranges (boxes) and minima and maxima (whiskers) (in, n = 5). P > 0.05, not significant (ns); *P < 0.05; **P < 0.01; ****P < 0.0001
Fig. 9
Fig. 9
Proposed model showing the mechanism underlying TRIM27-mediated IBS symptoms. In the setting of intestinal homeostasis, TRIM27 competitively binds to the conserved Armadillo (ARM) repeat domain of β-catenin to disrupt the interaction between Axin and β-catenin, thus promoting the stabilization of β-catenin, followed by its transport from the cytoplasm to the nucleus to activate Wnt/β-catenin signaling pathway-mediated self-renewal of Lgr5+ ISC and the ensuing development and regeneration of the intestinal epithelium to maintain intestinal epithelial barrier integrity and gut homeostasis. In the absence of TRIM27, Axin directly interacts with the ARM domain of β-catenin to promote its phosphorylation and ubiquitination-mediated proteasomal and autophagic degradation, leading to suppression of the Wnt/β-catenin signaling pathway and defects in Lgr5+ ISC self-renewal. In turn, the defective self-renewal of Lgr5+ ISCs causes the disruption of intestinal epithelial barrier integrity and gut homeostasis, leading to the occurrence of IBS symptoms, including reduced goblet and Paneth cell numbers, elevated Tnf, Il1b and 5-hydroxytryptamine (5-HT) levels, a decreased gastrointestinal transit time (GITT) and dysregulation of the gut microbiota

References

    1. Sperber AD. Epidemiology and burden of irritable bowel syndrome: an international perspective. Gastroenterol Clin North Am. 2021;50:489–503. - PubMed
    1. Ng SC, Shi HY, Hamidi N, Underwood FE, Tang W, Benchimol EI, et al. Worldwide incidence and prevalence of inflammatory bowel disease in the 21st century: a systematic review of population-based studies. Lancet. 2017;390:2769–78. - PubMed
    1. Kaplan GG, Windsor JW. The four epidemiological stages in the global evolution of inflammatory bowel disease. Nat Rev Gastroenterol Hepatol. 2021;18:56–66. - PMC - PubMed
    1. Hanning N, Edwinson AL, Ceuleers H, Peters SA, De Man JG, Hassett LC, et al. Intestinal barrier dysfunction in irritable bowel syndrome: a systematic review. Ther Adv Gastroenterol. 2021;14:1756284821993586. - PMC - PubMed
    1. Spiller R, Major G. IBS and IBD – separate entities or on a spectrum? Nat Rev Gastroenterol Hepatol. 2016;13:613–21. - PubMed

Publication types