. 2023 Feb;20(2):143-157.
doi: 10.1038/s41423-022-00966-y. Epub 2023 Jan 4.

Type I interferon signaling facilitates resolution of acute liver injury by priming macrophage polarization

Affiliations

Type I interferon signaling facilitates resolution of acute liver injury by priming macrophage polarization

Qiaoling Song et al. Cell Mol Immunol. 2023 Feb.

Abstract

Due to their broad functional plasticity, myeloid cells contribute to both liver injury and recovery during acetaminophen overdose-induced acute liver injury (APAP-ALI). A comprehensive understanding of cellular diversity and intercellular crosstalk is essential to elucidate the mechanisms and to develop therapeutic strategies for APAP-ALI treatment. Here, we identified the function of IFN-I in the myeloid compartment during APAP-ALI. Utilizing single-cell RNA sequencing, we characterized the cellular atlas and dynamic progression of liver CD11b+ cells post APAP-ALI in WT and STAT2 T403A mice, which was further validated by immunofluorescence staining, bulk RNA-seq, and functional experiments in vitro and in vivo. We identified IFN-I-dependent transcriptional programs in a three-way communication pathway that involved IFN-I synthesis in intermediate restorative macrophages, leading to CSF-1 production in aging neutrophils that ultimately enabled Trem2+ restorative macrophage maturation, contributing to efficient liver repair. Overall, we uncovered the heterogeneity of hepatic myeloid cells in APAP-ALI at single-cell resolution and the therapeutic potential of IFN-I in the treatment of APAP-ALI.

Keywords: APAP-ALI; CSF1+ neutrophil; IFN-I; Macrophage polarization; STAT2 T403 phosphorylation; scRNA-seq.


Conflict of interest statement

The authors declare no competing interests.

Figures
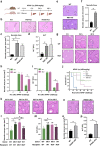
Fig. 1
Fig. 1
IFN-I production and activation are critical for the resolution of APAP-ALI. a Study design of recoverable APAP-ALI (300 mg/kg, i.p.). b Representative liver histological staining from WT, TRIF KO and IFNAR KO mice (n = 9 for each genotype) 48 h after APAP injection (i.p., 300 mg/kg in saline), necrosis area quantification (c) and plasma ALT levels (d) are shown. One-way ANOVA. e Representative liver histological staining of WT and IRF3 KO (n = 9 for each genotype) and f necrosis area quantification. Two-sided t-test. g Representative liver histological staining from WT (n = 45) and T403A (MUT) (n = 45) mice post APAP injection (i.p., 300 mg/kg) at the indicated time, necrosis area quantification (h) and plasma ALT levels (i) are shown. Two-way ANOVA. j Survival rates of WT (n = 8), MUT (n = 8), TRIF KO (n = 18) and IFNAR KO (n = 16) mice post-APAP injection at a half-lethal dose (i.p., 450 mg/kg). km Recoverable APAP-ALI experiment of bone marrow chimeric mice. APAP-ALI of recipient mice (n = 5 for each genotype) was assessed 48 h post APAP by representative liver histological staining (k), necrosis quantification (l) and plasma ALT levels (m). WT to MUT means donor bone marrow was from WT mice and recipient mice were MUT. So do other labels in (k). One-way ANOVA. n Representative liver histological staining of WT and IFNARflox/floxLysMCre (IFNAR cKO) (n = 8 for each genotype) 48 h post APAP injection (i.p., 300 mg/kg), necrosis area quantification (o) and plasma ALT levels (p) are shown. Two-sided t-test. Scale bar, 100 μm. *p < 0.05
Fig. 2
Fig. 2
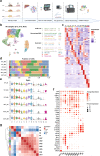
Comprehensive cellular overview of CD11b+ liver nonparenchymal cells post APAP-ALI. a Schematic diagram of the scRNA-seq workflow. b UMAP plots for the cell type identification of 26,758 high-quality single cells from WT and MUT littermates pooled from 3 mice per genotype per time point (0, 24 and 48 h post APAP-ALI). c Heatmap showing the top 10 DEGs in each cell type in (b). d Bar plots showing the proportion of cell types in each sample. e Violin plots showing CD11b (Itgam) gene expression in 15 distinct cell types. f Dot plot of the mean expression of canonical marker genes for the 11 major lineages as indicated. g Correlation heatmap and hierarchical clustering of the 11 major lineages
Fig. 3
Fig. 3
Transcriptomic heterogeneity of liver infiltrated myeloid cells post APAP-ALI. a Illustration of the identified liver infiltrated neutrophil populations (N1 and N8) and Mo-MFs (MΦ2, MΦ7, MΦ0 and MΦ3). b Functional analysis of marker genes for N8 by Metascape. c Heatmap showing different functions and pathways enriched in N1 and N8 by GSVA. d Enrichment of the top 30 DEGs of G5a, b, and c in DEGs of N1 and N8. e Monocle trajectories of N1 and N8 colored by pseudotime (left) or cluster identity (right). f Total cell counts of the 4 types of infiltrated Mo-MFs 0, 24 or 48 h post APAP injection in WT mice. g Heatmap showing different functions and pathways enriched in MΦ2, MΦ7, MΦ0 and MΦ3 by GSVA. h Monocle trajectories of MΦ2, MΦ7, MΦ0 and MΦ3 colored by pseudotime (left) or cluster identity (right). i Correlation matrix of bulk RNA-seq of sorted macrophages published (GSE55606) and identified 4 types of macrophages (MΦ2, MΦ7, MΦ0 and MΦ3)
Fig. 4
Fig. 4
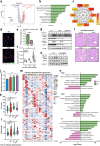
IFN-I signaling is attenuated in MUT mice post APAP-ALI. a Volcano plot showing DEGs of the purified whole CD11b+ nonparenchymal cells between WT and MUT mice. b Functional enrichment and c top 10 hub genes in the downregulated DEGs of MUT cells. d Immunofluorescence imaging of CD11b (red) and phospho-STAT2 (pY690) (green) in liver with DAPI (blue) 24 h post APAP. Scale bar, 100 μm. e Quantification of p-STAT2+ cells in CD11b+ cells in (d). Two-sided t-test. f Relative expression of IFIT1 in liver tissue of APAP-ALI. Two-way ANOVA. g Western blot of phospho-STAT1 (pY701), phospho-STAT2 (pY690), STAT1, and STAT2 expression in M-BMDMs from WT, MUT and IFNAR KO mice treated with LPS (100 ng/ml) at the indicated times. h M-BMDMs from WT mice were treated with vehicle or anti-IFNAR antibody (5 μg/ml) for 30 min, followed by LPS treatment for the indicated times. Phospho-STAT2 (pY690) and STAT2 expression were analyzed using western blotting. il WT mice (n = 10 for each group) were injected with anti-IFNβ antibody (1 μg/20 g b.w. in 200 μl sterile saline, i.p.) or isotype control post APAP-ALI at 12 h and/or 24 h before sacrifice at 36 h. Representative liver histological staining (i) and necrotic area quantification (j). Plasma ALT (k) and GDH (l) are shown. One-way ANOVA. m Heatmap showing representative ISG gene expression in 11 major clusters of WT and MUT mice. n Functional enrichment in the selected clusters of WT and MUT mice. *p < 0.05
Fig. 5
Fig. 5
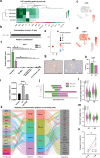
Impaired efferocytosis due to STAT2 phosphorylation deficiency at T403. a Violin plot of lysosome and phagosome scores for liver Mo-MFs (MΦ2, MΦ7, MΦ0 and MΦ3) 0, 24 or 48 h post-APAP. # for the comparison of MΦ0, MΦ3 and MΦ7 vs. MΦ2, and * for comparison of WT and MUT samples of the indicated MΦ cells. Two-way ANOVA. b, c Schematic diagram of the macrophage efferocytotic procedure in vitro (b). M-BMDMs were incubated with apoptotic Jurkat cells for 6 h. The percentage of BMDMs engulfing Jurkat cells was analyzed by flow cytometry (c). Two-way ANOVA. d Hierarchical plot shows the inferred intercellular communication network for GAS signaling 48 h post APAP-ALI (upper panel). Relative contribution of each ligand‒receptor pair to the GAS signaling pathway (bottom panel). e Immunofluorescence imaging of Gas6, Trem2, MerTK and AXL in the liver with DAPI 48 h post APAP-ALI. Scale bar, 100 μm. f Dot plot of the mean expression of GAS signaling (Gas6, Axl and Mertk) for MΦ3 in WT and MUT mice. g Immunohistochemical staining of Gas6 in the livers of WT and MUT mice 48 h post APAP-ALI. h Quantification of Gas6+ cells in (g). Two-sided t-test. i MΦ3-related significant signaling pathways are ranked based on their differences in overall information flow within the inferred networks between WT and MUT mice 48 h post APAP-ALI. GALECTIN represents Lgals9 signaling, GDF represents Gdf15, SPP1 represents Spp1, and ANGPTL represents Angptl4, as shown in Supplementary Fig. 7. # and *indicate p < 0.05
Fig. 6
Fig. 6
Neutrophil-derived CSF1 expression was inhibited in MUT mice post APAP-ALI. a Heatmap and hierarchical clustering showing the relative importance of each cell group based on the computed four network centrality measures of CSF signaling of WT mice 24 h post APAP-ALI. b Relative contribution of each ligand‒receptor pair to the CSF signaling pathway. c, d Feature plots of Csf1 and Csf1r gene expression 24 h post APAP-ALI. e Dot plot of the mean expression of Csf1 and Csf1r for N1. f Neutrophils (CD11b+Ly6G+), Mo-MFs (CD11b+Ly6G-), nonmyeloid immune cells (CD45+CD11b-Ly6G-) and nonimmune cells (CD45-) were sequentially isolated from cell suspensions of liver tissues from WT and MUT mice 24 h post APAP-ALI using magnetic bead separation. The relative mRNA levels of Csf1 were analyzed using RT‒PCR. Two-way ANOVA. g Immunohistochemical staining of CSF1 in the livers of WT and MUT mice 24 h post APAP-ALI. h Quantification of CSF1+ cells in (g). IOD: integral optical density. Two-sided t-test. i WT mice were injected with anti-IFNβ antibody (1 μg/20 g b.w. in 200 μl sterile saline, i.p.) or vehicle 6 h post APAP-ALI. Mice were sacrificed 24 h post-APAP. The relative mRNA levels of Csf1 in liver samples were analyzed using RT‒PCR. One-way ANOVA. j N1-related significant signaling pathways are ranked within the inferred networks 24 h post APAP-ALI. k Alluvial plot showing outgoing signaling patterns of secreting cells. Violin plot of neutrophil degranulation (l) and aging score (m) for infiltrated neutrophils. n Neutrophils were treated with IFNβ or vehicle, and the percentage of Annexin-V+ cells was calculated. Two-way ANOVA. *p < 0.05
Fig. 7
Fig. 7
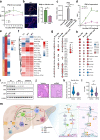
The STAT2 T403A mutation led to diminished IFNβ production by decreasing IRF3/7 activities. a IFNβ concentration was determined by ELISA in the supernatant of liver post APAP-ALI. Two-way ANOVA. b Immunofluorescence imaging of CD11b (red) and IFNβ (green) with DAPI (blue) in the livers of WT and MUT mice 24 h post APAP. Scale bar, 100 μm. Quantification of IFNβ+ cells in CD11b+ cells is shown in the right panel. Two-sided t-test. c The relative IFNβ mRNA levels of the isolated neutrophils (CD11b+Ly6G+), Mo-MFs (CD11b+Ly6G-), nonmyeloid immune cells (CD45+CD11b-Ly6G-) and nonimmune cells (CD45-) from cell suspensions of liver tissues 24 h post APAP-ALI using a magnetic bead separation approach. One-way ANOVA. d IFNβ concentration was determined by ELISA in the media of LPS-challenged M-BMDMs from WT and MUT mice. Two-way ANOVA. e Heatmap showing IFN-I-related functions and pathways enriched in MΦ0 in WT and MUT mice 24 h post APAP-ALI by GSVA analysis. f Heatmap of the t values representing regulon activity change of MΦ0 between WT and MUT at 0, 24, and 48 h post APAP-ALI by SCENIC analysis. g, h Bone marrow cells (BM) were isolated and differentiated with GM-CSF (GM) or M-CSF (CSF1) (M) for 7 days. Cells were then harvested and processed for RNA-seq analysis. g Dot plot of the response to IFNβ-related gene expression of DEGs between the indicated comparisons. h IPA upstream analysis comparison of DEGs between the indicated groups. i Bone marrow cells of WT, MUT and IFNAR KO mice were primed by M-CSF (CSF1) for 7 days, followed by LPS challenge (100 ng/ml) at the indicated times. IRFs expression in M-BMDMs was determined using western blotting. jl WT mice were injected with mIFNβ (50 ng/20 g b.w. in 200 μl sterile saline, i.p.) or vehicle 12 h post APAP-ALI before sacrifice at 36 h. Representative liver histological staining (j), necrotic area quantification (k) and plasma ALT (l) are shown. Scale bar, 100 μm. Two-sided t-test. m Schematic illustration of intercellular crosstalk between the major infiltrated myeloid lineages during the resolution phase of APAP-ALI (left) and IFN-I production and activation signaling pathways (right). The protein or phosphorylation marked in red represents the authorized targets, which is essential for the resolution phase of APAP-ALI. *p < 0.05

References

    1. Horvatits T, Drolz A, Trauner M, Fuhrmann V. Liver injury and failure in critical illness. Hepatology. 2019;70:2204–15. doi: 10.1002/hep.30824.. - DOI - PubMed
    1. McGill MR, Sharpe MR, Williams CD, Taha M, Curry SC, Jaeschke H. The mechanism underlying acetaminophen-induced hepatotoxicity in humans and mice involves mitochondrial damage and nuclear DNA fragmentation. J Clin Invest. 2012;122:1574–83. doi: 10.1172/JCI59755.. - DOI - PMC - PubMed
    1. Prescott LF, Illingworth RN, Critchley JA, Stewart MJ, Adam RD, Proudfoot AT. Intravenous N-acetylcystine: the treatment of choice for paracetamol poisoning. Br Med J. 1979;2:1097–100. doi: 10.1136/bmj.2.6198.1097.. - DOI - PMC - PubMed
    1. Chopyk DM, Grakoui A. Contribution of the intestinal microbiome and gut barrier to hepatic disorders. Gastroenterology. 2020;159:849–63. doi: 10.1053/j.gastro.2020.04.077.. - DOI - PMC - PubMed
    1. Benard A, Sakwa I, Schierloh P, Colom A, Mercier I, Tailleux L, et al. B cells producing type I IFN modulate macrophage polarization in tuberculosis. Am J Respir Crit Care Med. 2018;197:801–13. doi: 10.1164/rccm.201707-1475OC.. - DOI - PMC - PubMed

Publication types