. 2023 Jan 3;6(1):6.
doi: 10.1038/s42003-022-04323-7.

Rare variant analyses across multiethnic cohorts identify novel genes for refractive error

Collaborators, Affiliations

Rare variant analyses across multiethnic cohorts identify novel genes for refractive error

Anthony M Musolf et al. Commun Biol. .

Abstract

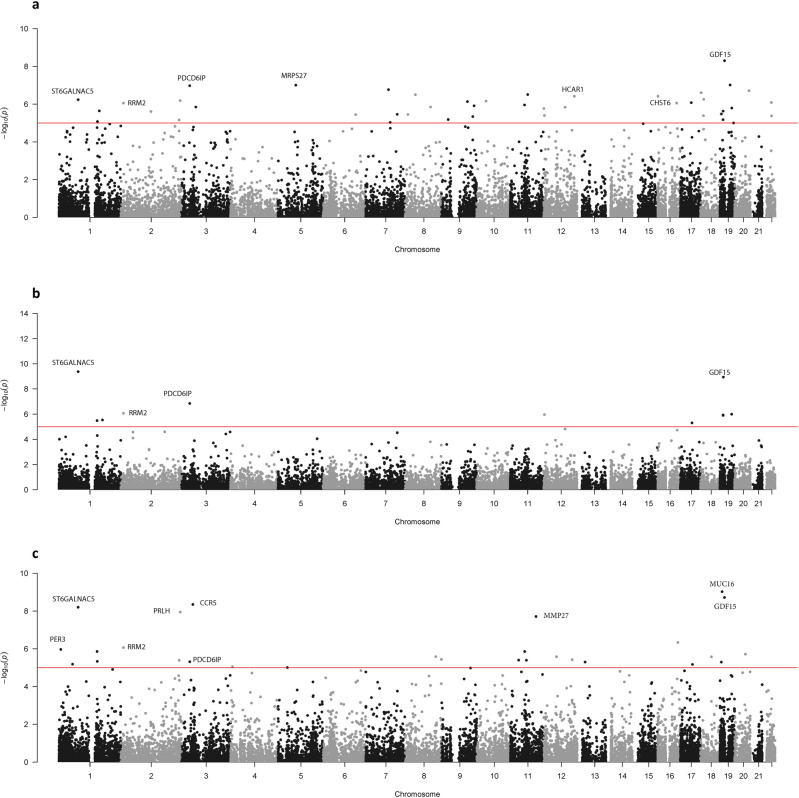
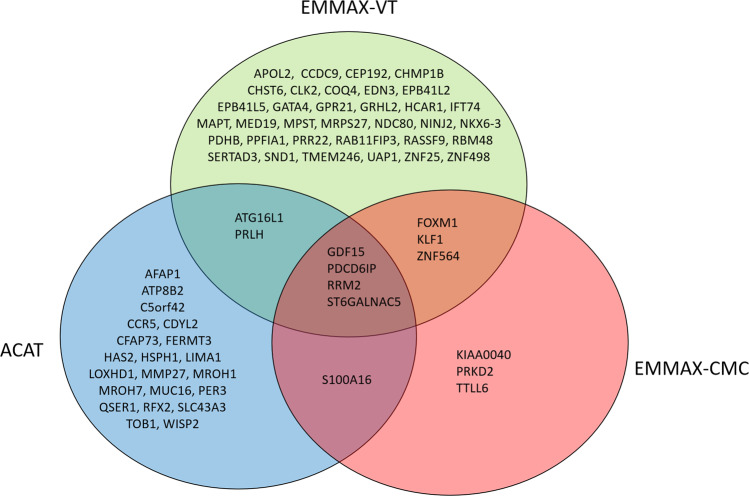
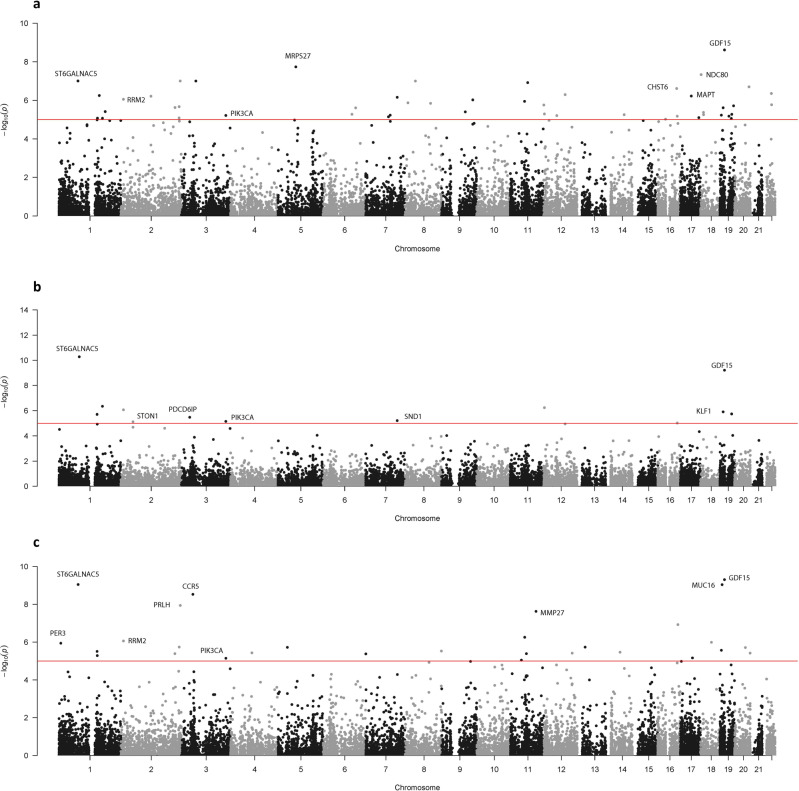
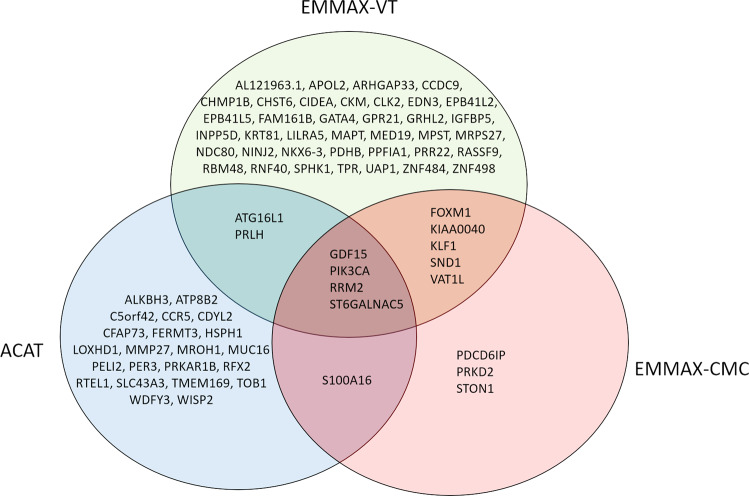
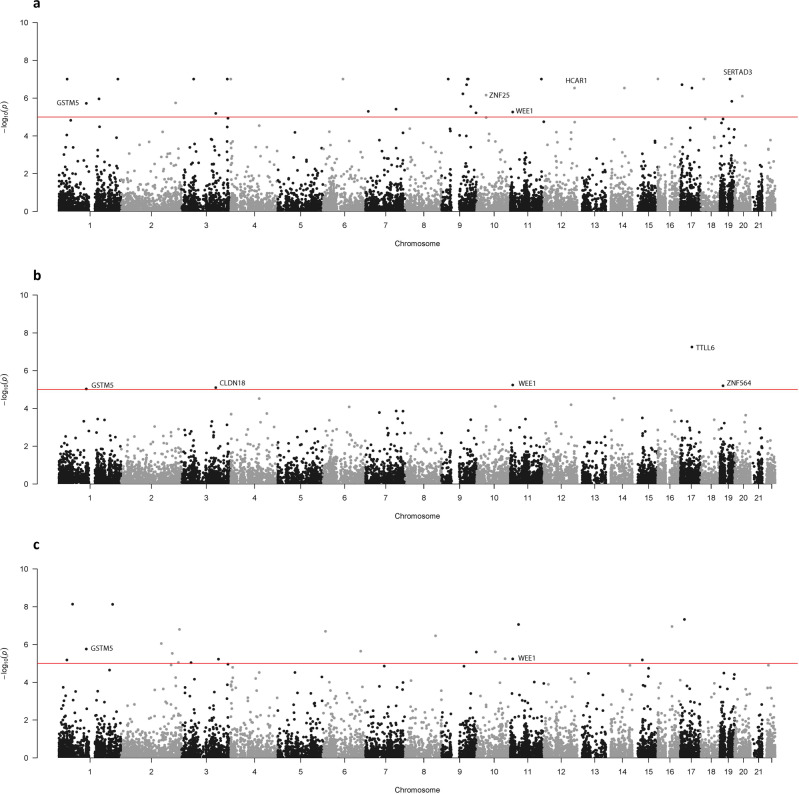
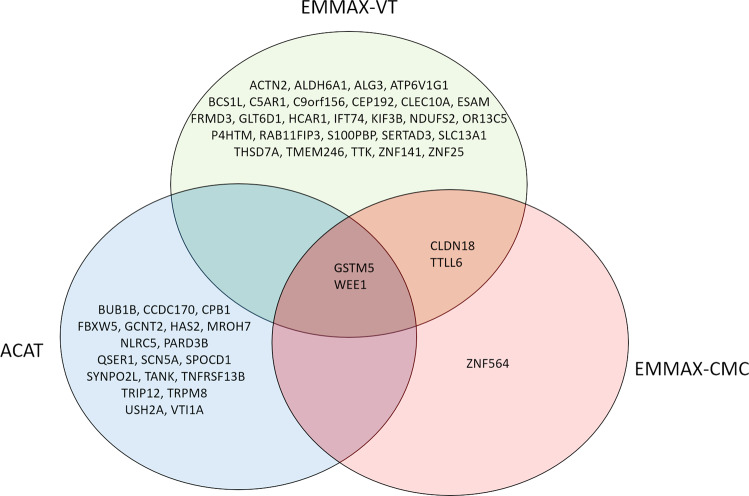
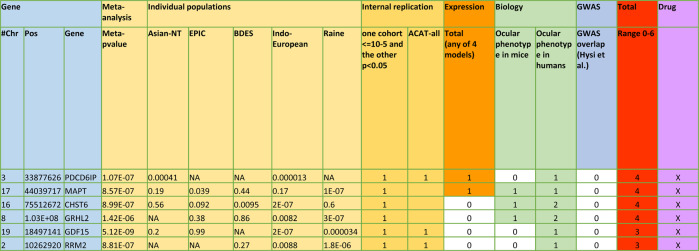
Refractive error, measured here as mean spherical equivalent (SER), is a complex eye condition caused by both genetic and environmental factors. Individuals with strong positive or negative values of SER require spectacles or other approaches for vision correction. Common genetic risk factors have been identified by genome-wide association studies (GWAS), but a great part of the refractive error heritability is still missing. Some of this heritability may be explained by rare variants (minor allele frequency [MAF] ≤ 0.01.). We performed multiple gene-based association tests of mean Spherical Equivalent with rare variants in exome array data from the Consortium for Refractive Error and Myopia (CREAM). The dataset consisted of over 27,000 total subjects from five cohorts of Indo-European and Eastern Asian ethnicity. We identified 129 unique genes associated with refractive error, many of which were replicated in multiple cohorts. Our best novel candidates included the retina expressed PDCD6IP, the circadian rhythm gene PER3, and P4HTM, which affects eye morphology. Future work will include functional studies and validation. Identification of genes contributing to refractive error and future understanding of their function may lead to better treatment and prevention of refractive errors, which themselves are important risk factors for various blinding conditions.


Conflict of interest statement

The authors declare no competing interests.

Figures

Fig. 1
Fig. 1. P-values of the multiethnic meta-analysis.
The gene-based p-values of the meta-analysis association study combining all five cohorts (N = 27,006) using the (a) EMMAX-VT test, (b) EMMAX-CMC test, and (c) ACAT. The line represents the genome-wide significant threshold of 1 ×10⁻⁵. These plots are based on results in Supplementary Data 9–11, respectively.
Fig. 2
Fig. 2. Overlap between three tests in the multiethnic meta-analysis.
A Venn diagram showing the overlap and unique significant genes in the multiethnic meta-analysis using the three different tests: EMMAX-VT (green), EMMAX-CMC (red), and ACAT (blue). These plots are based on results in Supplementary Data 6–8.
Fig. 3
Fig. 3. P-values of the Indo-European meta-analysis.
The gene-based p-values of the meta-analysis association study (N = 22,139) combining the four Indo-European derived cohorts using the (a) EMMAX-VT test, (b) EMMAX-CMC test, and (c) ACAT. The line represents the genome-wide significant threshold of 1 ×10⁻⁵. These plots are based on results in Supplementary Data 15–17, respectively.
Fig. 4
Fig. 4. Overlap between three tests in the Indo-European meta-analysis.
A Venn diagram showing the overlap and unique significant genes in the Indo-European cohorts meta-analysis using the three different tests: EMMAX-VT (green), EMMAX-CMC (red), and ACAT (blue). These plots are based on results in Supplementary Data 12–14.
Fig. 5
Fig. 5. P-values of the analysis using the Eastern Asian EACC only.
The gene-based p-values of the EACC association analysis (N = 4867) using the (a) EMMAX-VT test, (b) EMMAX-CMC test, and (c) ACAT. The line represents the genome-wide significant threshold of 1 ×10⁻⁵. These plots are based on results in Supplementary Data 9–11 respectively.
Fig. 6
Fig. 6. Overlap between three tests in the Eastern Asian EACC analysis.
A Venn diagram showing the overlap and unique significant genes in the EACC analysis using the three different tests: EMMAX-VT (green), EMMAX-CMC (red), and ACAT (blue). These plots are based on results in Supplementary Data 18–20.
Fig. 7
Fig. 7. Prioritization of top genes from all 129 genome-wide significant genes.
The top genes ranked by our prioritization schema. The figure contains the chromosome, basepair position, gene name, as well as the meta-analysis p-value and the individual cohort p-values for each gene. It also contains which test the given significant meta-analysis p-value refers to, and how many times the gene replicated in our internal analyses. Finally, it contains information regarding gene expression, whether the gene has a known ocular phenotype in mice or humans, overlap with the GWAS performed by Hysi et al., and the final overall prioritization score. This figure is based on results shown in Supplementary Data 26.

References

    1. Vitale S, Sperduto RD, Ferris FL., 3rd Increased prevalence of myopia in the United States between 1971-1972 and 1999-2004. Arch. Ophthalmol. 2009;127:1632–1639. doi: 10.1001/archophthalmol.2009.303. - DOI - PubMed
    1. Williams KM, et al. Increasing prevalence of myopia in Europe and the impact of education. Ophthalmology. 2015;122:1489–1497. doi: 10.1016/j.ophtha.2015.03.018. - DOI - PMC - PubMed
    1. Morgan IG, Ohno-Matsui K, Saw SM. Myopia. Lancet. 2012;379:1739–1748. doi: 10.1016/S0140-6736(12)60272-4. - DOI - PubMed
    1. Wang J, et al. Prevalence of myopia and vision impairment in school students in Eastern China. BMC Ophthalmol. 2020;20:2. doi: 10.1186/s12886-019-1281-0. - DOI - PMC - PubMed
    1. Verhoeven VJ, et al. Visual consequences of refractive errors in the general population. Ophthalmology. 2015;122:101–109. doi: 10.1016/j.ophtha.2014.07.030. - DOI - PubMed

Publication types