. 2023 Jan 4;22(1):1.
doi: 10.1186/s12943-022-01695-6.

MicroRNA-1 attenuates the growth and metastasis of small cell lung cancer through CXCR4/FOXM1/RRM2 axis

Affiliations

MicroRNA-1 attenuates the growth and metastasis of small cell lung cancer through CXCR4/FOXM1/RRM2 axis

Parvez Khan et al. Mol Cancer. .

Abstract

Background: Small cell lung cancer (SCLC) is an aggressive lung cancer subtype that is associated with high recurrence and poor prognosis. Due to lack of potential drug targets, SCLC patients have few therapeutic options. MicroRNAs (miRNAs) provide an interesting repertoire of therapeutic molecules; however, the identification of miRNAs regulating SCLC growth and metastasis and their precise regulatory mechanisms are not well understood.

Methods: To identify novel miRNAs regulating SCLC, we performed miRNA-sequencing from donor/patient serum samples and analyzed the bulk RNA-sequencing data from the tumors of SCLC patients. Further, we developed a nanotechnology-based, highly sensitive method to detect microRNA-1 (miR-1, identified miRNA) in patient serum samples and SCLC cell lines. To assess the therapeutic potential of miR-1, we developed various in vitro models, including miR-1 sponge (miR-1Zip) and DOX-On-miR-1 (Tet-ON) inducible stable overexpression systems. Mouse models derived from intracardiac injection of SCLC cells (miR-1Zip and DOX-On-miR-1) were established to delineate the role of miR-1 in SCLC metastasis. In situ hybridization and immunohistochemistry were used to analyze the expression of miR-1 and target proteins (mouse and human tumor specimens), respectively. Dual-luciferase assay was used to validate the target of miR-1, and chromatin immunoprecipitation assay was used to investigate the protein-gene interactions.

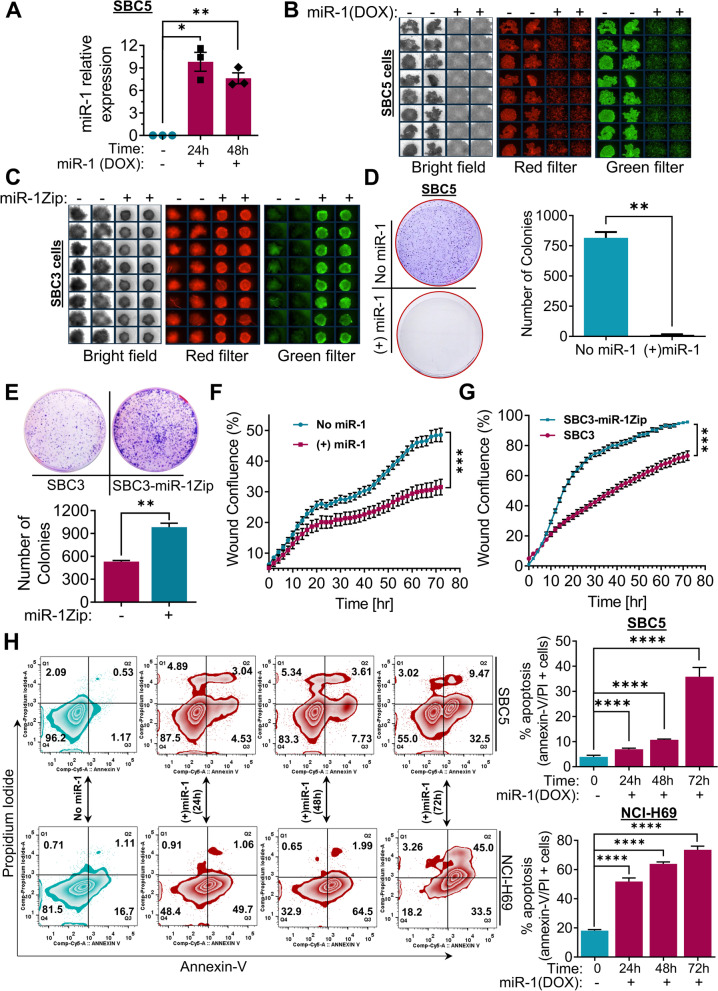
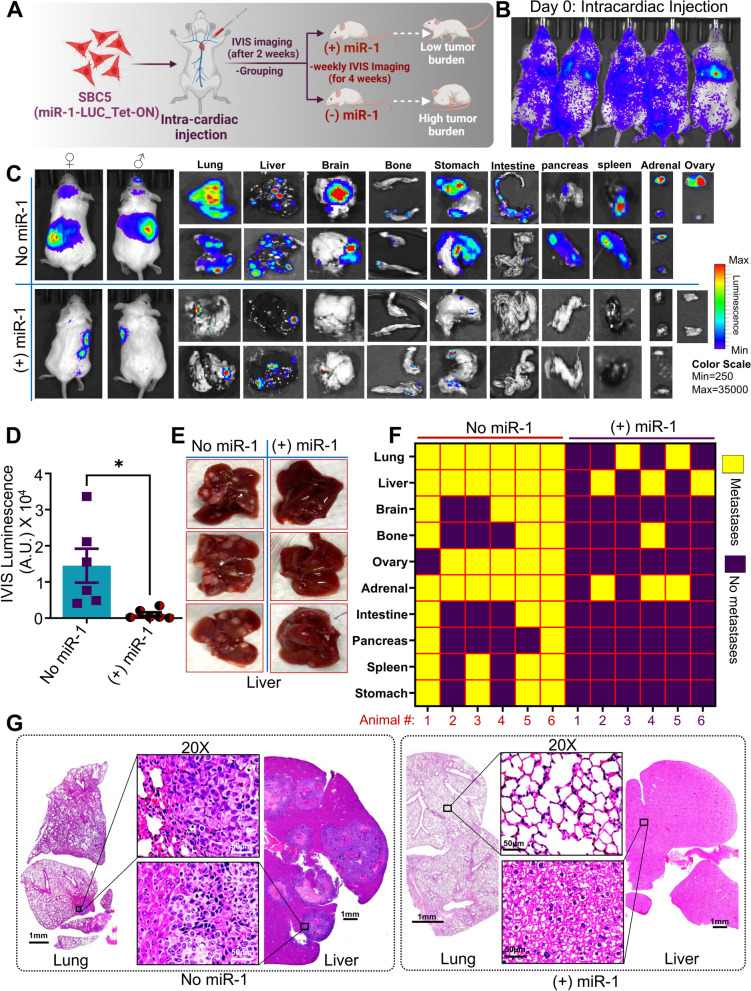
Results: A consistent downregulation of miR-1 was observed in tumor tissues and serum samples of SCLC patients compared to their matched normal controls, and these results were recapitulated in SCLC cell lines. Gain of function studies of miR-1 in SCLC cell lines showed decreased cell growth and oncogenic signaling, whereas loss of function studies of miR-1 rescued this effect. Intracardiac injection of gain of function of miR-1 SCLC cell lines in the mouse models showed a decrease in distant organ metastasis, whereas loss of function of miR-1 potentiated growth and metastasis. Mechanistic studies revealed that CXCR4 is a direct target of miR-1 in SCLC. Using unbiased transcriptomic analysis, we identified CXCR4/FOXM1/RRM2 as a unique axis that regulates SCLC growth and metastasis. Our results further showed that FOXM1 directly binds to the RRM2 promoter and regulates its activity in SCLC.

Conclusions: Our findings revealed that miR-1 is a critical regulator for decreasing SCLC growth and metastasis. It targets the CXCR4/FOXM1/RRM2 axis and has a high potential for the development of novel SCLC therapies. MicroRNA-1 (miR-1) downregulation in the tumor tissues and serum samples of SCLC patients is an important hallmark of tumor growth and metastasis. The introduction of miR-1 in SCLC cell lines decreases cell growth and metastasis. Mechanistically, miR-1 directly targets CXCR4, which further prevents FOXM1 binding to the RRM2 promoter and decreases SCLC growth and metastasis.

Keywords: CXCR4; FOXM1; Neuroendocrine carcinoma; RRM2; Small cell lung cancer; microRNAs.


Conflict of interest statement

SKB is co-founder of Sanguine Diagnostics and Therapeutics, Inc. AKG has served on Advisory Boards for AstraZeneca, Jazz pharmaceuticals, Sanofi–Genzyme, Beigene; received research support from Takeda Pharmaceuticals, Merck, TAB Biosciences, IOVANCE, and Mirati Therapeutics; is a consultant for Flagship Biosciences and serves on the DSMC for Y-mAbs Therapeutics. Other authors declare no competing interests.

Figures

Fig. 1
Fig. 1
MicroRNA profiling in SCLC patient serum identifies miR-1-3p (miR-1) is downregulated in SCLC and validated by DNA-AuNP˗based in situ detection and quantification of serum miR-1. A The clustered heatmap of top differentially expressed genes for microRNAs in the serum samples of 6 healthy donors and 8 SCLC patient samples. The red and blue strips indicate upregulated and downregulated miRNAs. B The volcano plot showed that miR-1 was one of the downregulated miRNAs. C Comparison of log2 fold change expression of miR-1 in the serum samples of 6 healthy donors and 8 SCLC patient samples. D Violin plots comparing the expression profile of miR-1 between normal lung tissues (n = 8) and SCLC tumor tissues (n = 35) in the publicly available gene expression data of human cancers (GSE19945). E Schematic of Au-nanoprobe (DNA-AuNPs) mediated detection of serum miR-1 in the denatured human serum samples. F Violin with point graph representing the quantitative expression of serum miR-1 in the donor (normal control) serum vs SCLC patient serum. p-values are the results of Welch’s t-test. G Representative in situ hybridization of miR-1 on SCLC tissue microarray (BS04116a, US Biomax, Inc., representing the pathology grade tumor tissues of 55 cases/100 cores for SCLC and ten cores for normal lung tissues), stained with RNAscope miR-1 detection probe. H Expression of miR-1 in a panel of human SCLC cell lines analyzed by Taq-man qPCR assay
Fig. 2
Fig. 2
miR-1 modulates growth and migration of SCLC cells. A miR-1 expression in DOX-On-miR-1 SBC5 cells induced with DOX for 24–48 h assessed by TaqMan-based qPCR assay. RNU6B was used to normalize the gene expression. Representative images from sphere formation assay from, (B) SBC5 no miR-1(-DOX-Off) and + miR-1 (+ DOX-On), (C) SBC3 and SBC3-miR-1Zip cells. Representative images for colony formation assay from, (D) SBC5 no miR-1(-DOX-Off) and + miR-1 (+ DOX-On) cells, the right panel showed the quantification of number of colonies from n = 3 biological replicates, (E) SBC3 and SBC3-miR-1Zip cells, the lower panel showed the quantification of the number of colonies from n = 3 biological replicates. Quantification of percent wound closure area from real-time monitoring for cell migration assay of, (F) SBC5 no miR-1(-DOX-Off) and + miR-1 (+ DOX-On) cells, (G) SBC3 and SBC3-miR-1Zip cells. H FACS analysis of the apoptotic potential of miR-1 in SBC5/NCI-H69 cells under no miR-1(-DOX-Off) and + miR-1 (+ DOX-On) conditions as monitored for 24–72 h. The cells were induced for miR-1 expression for the indicated period (24-72 h) and stained with annexin-V/PI to analyze apoptosis induction by flow cytometry. Quantification of apoptosis was presented in the right panels (from n = 3 biological replicates). Statistical significance was considered using a two-tailed Student’s t-test, except in H, where ordinary one-way ANOVA was used. *, p < 0.05; **, p < 0.01; ***, p < 0.001; ****, p < 0.0001
Fig. 3
Fig. 3
Downregulation of miR-1 or sponging drives a highly aggressive phenotype in SCLC cells. A Schematic of SBC3 and SBC3-miR-1Zip subcutaneous and intracardiac xenografts in NSG mice for tumorigenesis and metastasis studies. B Representative IVIS image of NSG mice injected with subcutaneous xenografts of SBC3 and SBC3-miR-1Zip cells expressing luciferase. C Ex-vivo images of tumors from SBC3 and SBC3-miR-1Zip xenografts. D Quantification of time-dependent tumor growth (SBC3 and SBC3-miR-1Zip tumors) in volume as obtained from caliper measurements. E Quantification of tumor growth in terms of weight (g) at the end of experiments. F Representative IVIS images of mice bearing intracardiac xenografts on the end day of the experiment just before the time of sacrifice (one female and one male mice), with ex-vivo IVIS imaging of major organs for the metastasis of SBC3 and SBC3-miR-1Zip cells such as lung, liver, brain, bone, stomach, intestine, pancreas, spleen, adrenal and ovary. Mice were injected with luciferin i.p. (150 mg/kg in sterile PBS) 5 min before euthanasia; following that the major organs were collected and scanned for metastatic lesions using IVIS imaging. G Quantification of the IVIS luminescence and number of metastases sites from each mouse intracardially injected with SBC3 and SBC3-miR-1Zip group. H Representative IHC of SBC3 and SBC3-miR-1Zip tumor sections for Ki67 and CD31, highlighted with red box provided in higher-magnification or zoom inset. Scale bars represent 200 µm (with successive magnification)
Fig. 4
Fig. 4
Ectopic overexpression of miR-1 decreases tumor growth and metastasis of intracardiac xenografts. A Schematic of SBC5 (-DOX-Off/ + DOX-On) intracardiac xenografts in NSG mice. B Representative IVIS images of NSG mice intracardially injected with SBC5 cells expressing luciferase (Day 0). C Representative IVIS images of mice bearing intracardiac xenografts on the end day of the experiment just before the time of sacrifice (one female and one male mice), with ex-vivo IVIS imaging of major organs showing SCLC metastasis such as lung, liver, brain, bone, stomach, intestine, pancreas, spleen, adrenal and ovary. Mice were injected with luciferin i.p. (150 mg/kg in sterile PBS) 5 min before euthanasia; following that the major organs were collected and scanned for metastatic lesions using IVIS imaging. D Quantification of the IVIS luminescence for each mice from no miR-1 and ( +)miR-1 group. E Representative ex-vivo images of liver showing metastasis nodules excised from no miR-1 and ( +)miR-1 groups. F Checkerboard representation of metastasis in the major organs of NSG mice as collected from SBC5 intracardiac xenografts of no miR-1(-DOX-Off) and + miR-1 (+ DOX-On) groups (data from n = 6 mice). Metastasis was studied using IVIS imaging and H&E analysis. G Representative H&E of liver and lung tissues having metastasis with an area highlighted with a box provided in higher-magnification or zoom inset. Scale bars represent 1 mm and 50 µm (with successive 20X magnification)
Fig. 5
Fig. 5
miR-1 modulates the CXCR4/FOXM1/RRM2 axis in SCLC. Heatmap of top differentially expressed genes from (A) miR-1(-DOX-Off) and + miR-1 (+ DOX-On) SBC5 cells, (B) SBC3 and SBC3-miR-1Zip cells. C-D Clustering and gene interaction network analysis (http://string-db.org/) of top differentially expressed genes from RNA-Seq analysis of miR-1 sponging and overexpression models. E Heatmap for normalized expression of CXCR4, FOXM1, and RRM2 in a panel of NCI SCLC cell lines data sets (https://discover.nci.nih.gov/rsconnect/SclcCellMinerCDB/). F Cell surface expression analysis of CXCR4 in SBC3, SBC3-miR-1Zip, SBC5, and NCI-H69 cells under no miR-1(-DOX-Off) and + miR-1 (+ DOX-On) conditions through FACS analysis
Fig. 6
Fig. 6
miR-1 targets CXCR4/FOXM1/RRM2, alters FOXM1 accessibility to RRM2 promoter, and modulates downstream signaling. A Schematic for the cloning of 3'-UTR sequences for dual luciferase assay. The upper panel of the inset shows the alignment of mature miR-1 sequences with 3'-UTR of CXCR4, and the lower panel shows the CXCR4 UTR residues mutated to abrogate the miR-1 binding. Primer sequences used to amplify 3'-UTR of CXCR4 were presented next to the inset. B Dual-luciferase assay validating CXCR4 as a target of miR-1. SBC5 cells were co-transfected with the luciferase-3'-UTR construct of CXCR4 (wild type/mutant), and miR-1 mimic, or scramble (SCR) and luciferase activity was measured. Chromatin immunoprecipitation of FOXM1 and RRM2 qPCR confirming the binding of FOXM1 with RRM2 promoter, (C) miR-1 decreased the interaction of FOXM1 with RRM2 promoter, (D) miR-1 sponging (miR-1Zip) enhances the accessibility of RRM2 promoter to FOXM1. E FOXM1 binding to RRM2 promoter in the presence of CXCL12 (100 ng/ml for 48-72 h), higher binding in miR-1Zip cells is due to high CXCR4 expression in these cells. F miR-1 sponging increased the expression of FOXM1 and RRM2 in SBC3 cells. G Immunoblotting studies showed that overexpression of miR-1 decreased the expression of FOXM1 and RRM2 in SBC5 and NCI-H69 cells. H Schematic to understand the viability of the CXCR4-FOXM1-RRM2 axis in SCLC cell lines. I-J SBC3-miR-1Zip and SBC5 cells were treated with AMD3100 (CXCR4 inhibitor) and FDI-6 (FOXM1 inhibitor) and analyzed for the expression of FOXM1 and RRM2 by Western blot. AMD3100 or FDI-6 treatment decreased the expression of FOXM1 and RRM2, like miR-1. Immunoblotting analysis demonstrated that; (K) miR-1 sponging increased the activation of AKT and ERK, and expression of epithelial to mesenchymal markers snail and Zeb-1 in SBC3 cells, (L) miR-1 overexpression decreased AKT and ERK activation in SBC5 and NCI-H69 cells. miR-1 also decreased the expression of snail in SBC5 cells. Statistical significance was calculated using two-tailed Student’s t-test for C-D, and one-way ANOVA for E. *, p < 0.05; **, p < 0.01; ***, p < 0.001; ns, non-significant
Fig. 7
Fig. 7
miR-1 modulates the CXCR4/FOXM1/RRM2 axis and enhances survival. A Representative H&E and IHC of serial sections of same liver tissue having metastasis for CXCR4, FOXM1, and RRM2 from SBC5 no miR-1(-DOX-Off) and + miR-1 (+ DOX-On) intracardiac xenografts. Image of whole liver tissue sections having metastasis with an area highlighted with a box provided in higher-magnification or zoom inset. Scale bars represent 1 mm (with successive magnification). B IHC quantification for respective proteins was presented in the right panels (n = 6 liver sections). C Representative H&E and IHC of the same liver tissue having metastasis for CXCR4, FOXM1, and RRM2 from intracardiac xenografts of SBC3 and SBC3-miR-1Zip cells. Scale bars represent 400 µm (with successive magnification). D IHC quantification for respective proteins was presented in the right panels (n = 6 liver sections). E Kaplan–Meier survival analysis of NSG mice bearing metastatic SCLC xenografts under no miR-1 and + miR-1 conditions for 24 weeks (n = 10 mice in each group). F Violin with point graph representing the quantitative expression of serum miR-1 in -DOX-Off/ + DOX-On group of NSG mice. Statistical significance was calculated using two-tailed Student’s t-test for unpaired samples, where ***, p < 0.001. G Overall postulated mechanism of miR-1 mediated attenuation of SCLC cell growth and metastasis. Low miR-1 and high CXCR4 were associated with SCLC and proposed therapeutic activation or overexpression of miR-1 in SCLC target 3'-UTR of CXCR4, resulting in decreased CXCR4 expression. In addition, miR-1 mediated CXCR4 targeting inhibited FOXM1/RRM2 axis responsible for SCLC growth and metastasis. Schematic created with BioRender.com

References

    1. George J, et al. Comprehensive genomic profiles of small cell lung cancer. Nature. 2015;524(7563):47–53. doi: 10.1038/nature14664. - DOI - PMC - PubMed
    1. van Meerbeeck JP, Ball D. Small-cell lung cancer: local therapy for a systemic disease? Lancet. 2015;385(9962):9–10. doi: 10.1016/S0140-6736(14)61252-6. - DOI - PubMed
    1. van Meerbeeck JP, Fennell DA, De Ruysscher DK. Small-cell lung cancer. Lancet. 2011;378(9804):1741–1755. doi: 10.1016/S0140-6736(11)60165-7. - DOI - PubMed
    1. Li L, et al. Identification of DHODH as a therapeutic target in small cell lung cancer. Sci Transl Med. 2019;11(517):eaaw7852. doi: 10.1126/scitranslmed.aaw7852. - DOI - PMC - PubMed
    1. Byers LA, Rudin CM. Small cell lung cancer: where do we go from here? Cancer. 2015;121(5):664–672. doi: 10.1002/cncr.29098. - DOI - PMC - PubMed

Publication types