

Unsupervised title and abstract screening for systematic review: a retrospective case-study using topic modelling methodology
- PMID: 36597132
- PMCID: PMC9811792
- DOI: 10.1186/s13643-022-02163-4
Unsupervised title and abstract screening for systematic review: a retrospective case-study using topic modelling methodology
Abstract
Background: The importance of systematic reviews in collating and summarising available research output on a particular topic cannot be over-emphasized. However, initial screening of retrieved literature is significantly time and labour intensive. Attempts at automating parts of the systematic review process have been made with varying degree of success partly due to being domain-specific, requiring vendor-specific software or manually labelled training data. Our primary objective was to develop statistical methodology for performing automated title and abstract screening for systematic reviews. Secondary objectives included (1) to retrospectively apply the automated screening methodology to previously manually screened systematic reviews and (2) to characterize the performance of the automated screening methodology scoring algorithm in a simulation study.
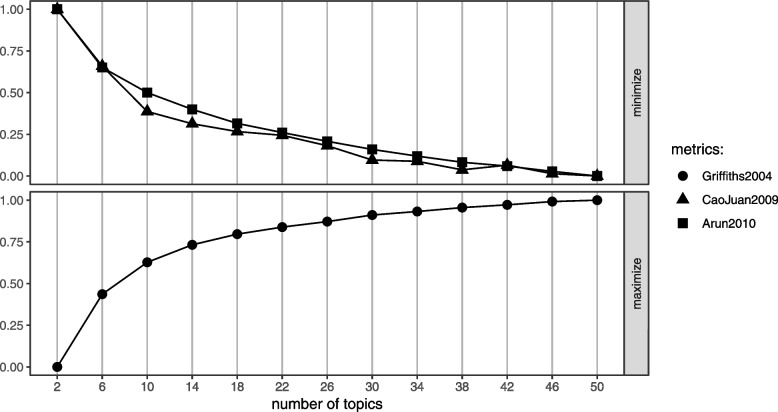
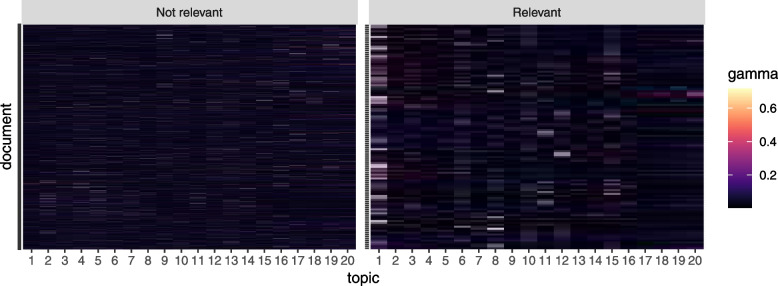
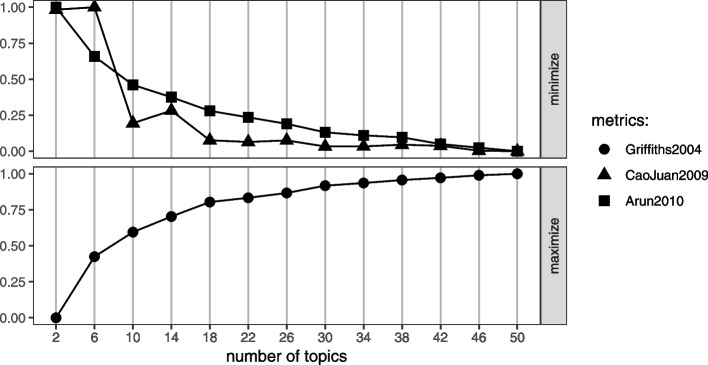
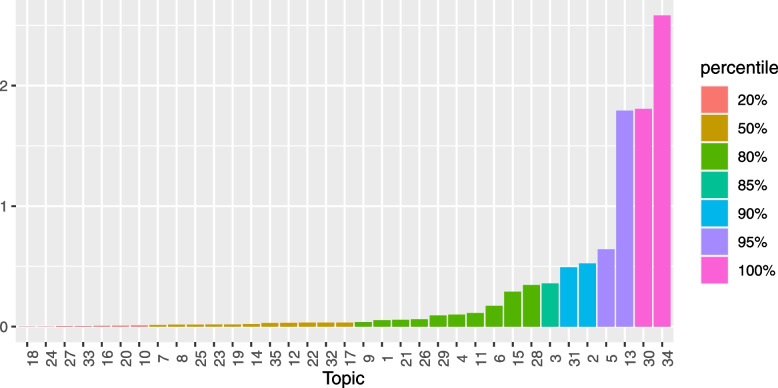
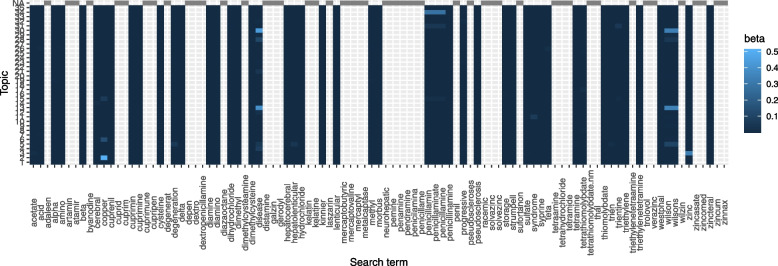
Methods: We implemented a Latent Dirichlet Allocation-based topic model to derive representative topics from the retrieved documents' title and abstract. The second step involves defining a score threshold for classifying the documents as relevant for full-text review or not. The score is derived based on a set of search keywords (often the database retrieval search terms). Two systematic review studies were retrospectively used to illustrate the methodology.
Results: In one case study (helminth dataset), [Formula: see text] sensitivity compared to manual title and abstract screening was achieved. This is against a false positive rate of [Formula: see text]. For the second case study (Wilson disease dataset), a sensitivity of [Formula: see text] and specificity of [Formula: see text] were achieved.
Conclusions: Unsupervised title and abstract screening has the potential to reduce the workload involved in conducting systematic review. While sensitivity of the methodology on the tested data is low, approximately [Formula: see text] specificity was achieved. Users ought to keep in mind that potentially low sensitivity might occur. One approach to mitigate this might be to incorporate additional targeted search keywords such as the indexing databases terms into the search term copora. Moreover, automated screening can be used as an additional screener to the manual screeners.
Keywords: Abstract screening; Automated systematic review; Latent Dirichlet Allocation; Topic modelling; Unsupervised learning.
© 2022. The Author(s).
Conflict of interest statement
The authors declare that they have no competing interests.
Figures


References
-
- JPT H, J T, J C, M C, T L, MJ P, et al., editors. Cochrane Handbook for Systematic Reviews of Interventions. 2nd ed. Chichester: Wiley; 2019.
-
- Kwon HR, Silva EA. Mapping the Landscape of Behavioral Theories: Systematic Literature Review. J Plan Lit. 2019;35(2):161–179. doi: 10.1177/0885412219881135. - DOI
-
- Bilotta GS, Milner AM, Boyd I. On the use of systematic reviews to inform environmental policies. Environ Sci Policy. 2014;42:67–77. doi: 10.1016/j.envsci.2014.05.010. - DOI
-
- Zawacki-Richter O, Kerres M, Bedenlier S, Bond M, Buntins K, editors. Systematic Reviews in Educational Research. USA: Springer Fachmedien Wiesbaden; 2020. 10.1007/978-3-658-27602-7.
MeSH terms
LinkOut - more resources
Full Text Sources
