

Multinucleation resets human macrophages for specialized functions at the expense of their identity
- PMID: 36597777
- PMCID: PMC9986822
- DOI: 10.15252/embr.202256310
Multinucleation resets human macrophages for specialized functions at the expense of their identity
Erratum in
-
Multinucleation resets human macrophages for specialized functions at the expense of their identity.EMBO Rep. 2023 Apr 5;24(4):e57070. doi: 10.15252/embr.202357070. EMBO Rep. 2023. PMID: 37016941 Free PMC article.
Abstract
Macrophages undergo plasma membrane fusion and cell multinucleation to form multinucleated giant cells (MGCs) such as osteoclasts in bone, Langhans giant cells (LGCs) as part of granulomas or foreign-body giant cells (FBGCs) in reaction to exogenous material. How multinucleation per se contributes to functional specialization of mature mononuclear macrophages remains poorly understood in humans. Here, we integrate comparative transcriptomics with functional assays in purified mature mononuclear and multinucleated human osteoclasts, LGCs and FBGCs. Strikingly, in all three types of MGCs, multinucleation causes a pronounced downregulation of macrophage identity. We show enhanced lysosome-mediated intracellular iron homeostasis promoting MGC formation. The transition from mononuclear to multinuclear state is accompanied by cell specialization specific to each polykaryon. Enhanced phagocytic and mitochondrial function associate with FBGCs and osteoclasts, respectively. Moreover, human LGCs preferentially express B7-H3 (CD276) and can form granuloma-like clusters in vitro, suggesting that their multinucleation potentiates T cell activation. These findings demonstrate how cell-cell fusion and multinucleation reset human macrophage identity as part of an advanced maturation step that confers MGC-specific functionality.
Keywords: Langhans giant cells; foreign body giant cells; macrophages; multinucleation; osteoclasts.
© 2023 The Authors. Published under the terms of the CC BY 4.0 license.
Figures
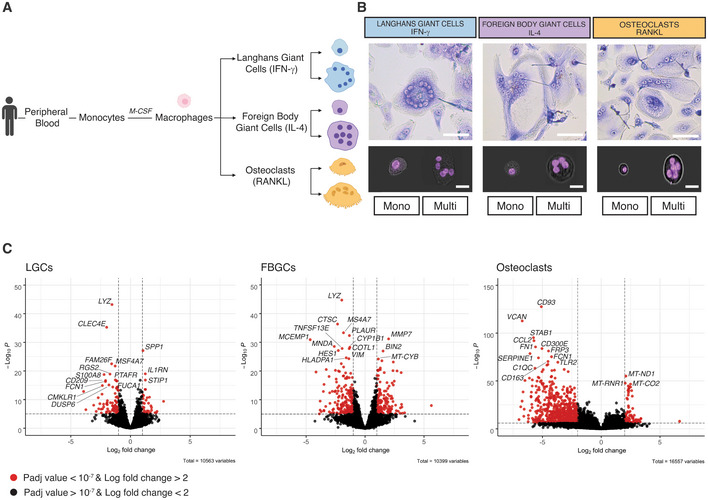
Schematic overview of the PBMC‐derived generation of differentiated mononuclear and multinucleated LGCs, FBGCs and osteoclasts using IFN‐γ, IL‐4 and RANKL, respectively.
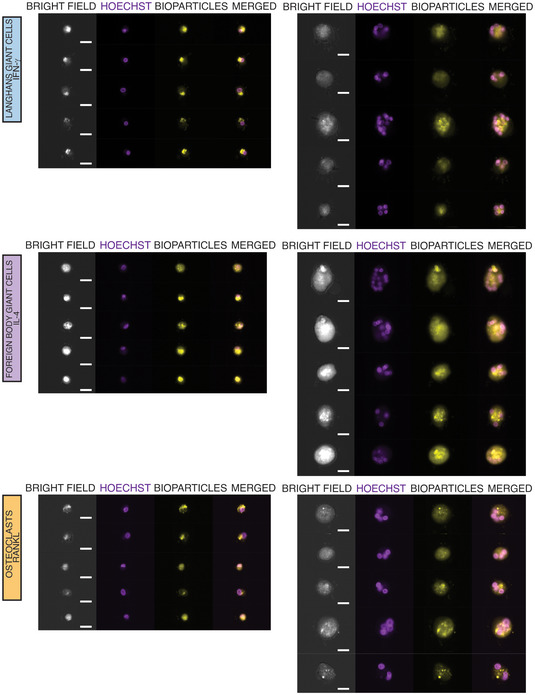
Light microscopy images of LGCs, FBGCs and osteoclasts stained with Giemsa staining (upper panel). Representative Hoechst dye images acquired by ImageStream (lower panel) of sorted cells showing mononuclear (mono) and multinucleated (multi) populations for each cell type.
RNA‐seq volcano plots highlighting the top 15 differentially expressed genes between mononuclear and multinucleated populations for each cell type.
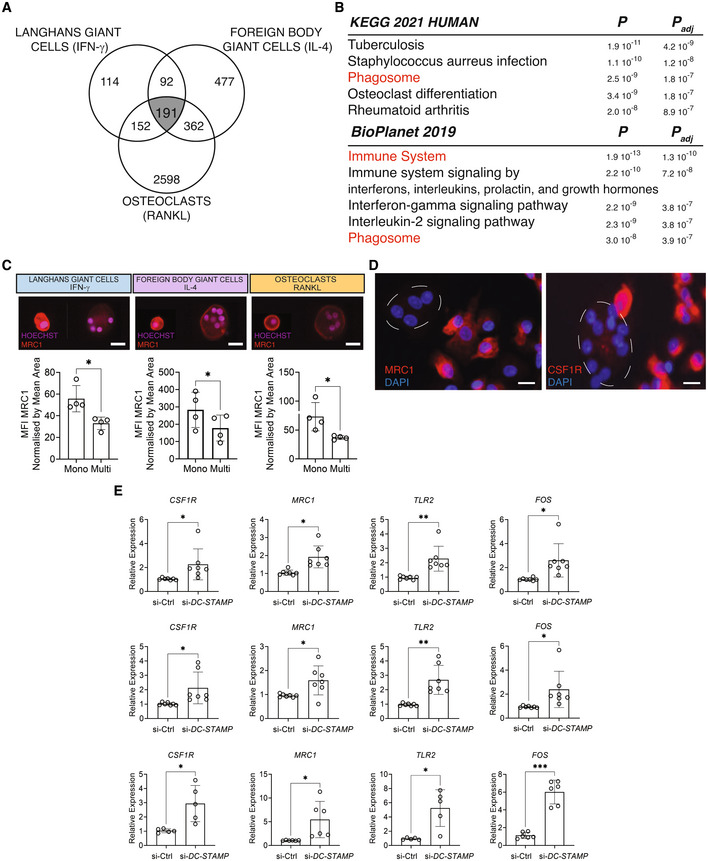
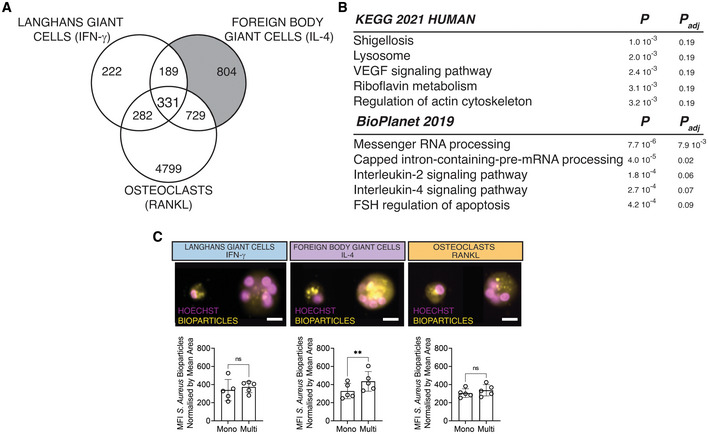
Venn diagram showing the commonly downregulated transcripts (n = 191) as a result of multinucleation in LGCs, FBGCs and osteoclasts (in gray).
KEGG and BioPlanet 2019 pathway analyses on the 191 commonly downregulated genes. Pathways in red are shared between KEGG and BioPlanet.
MRC1 surface marker expression (red) acquired by ImageStream in mononuclear (mono) and multinucleated (multi) LGCs, FBGCs and osteoclasts stained for Hoechst. Bar graphs (lower panel) represent normalized MRC1 mean fluorescence intensity (MFI), measured by ImageStream; n = 4 donors.
Representative MRC1 (left panel) and CSF1R (right panel) immunofluorescence in mononuclear and multinucleated osteoclasts stained for DAPI (blue). Note the dim MRC1 and CSF1R in multinucleated osteoclasts (dashed lines) compared to surrounding mononucleated ones.
CSF1R, MRC1, TLR2 and FOS relative expression measured by qRT–PCR for LGCs (upper), FBGCs (middle) and osteoclasts (lower), following the cell membrane fusion regulator DC‐STAMP knockdown. si‐Ctrl, scrambled siRNA; si‐DC‐STAMP, DC‐STAMP siRNA; at least n = 5 donors.
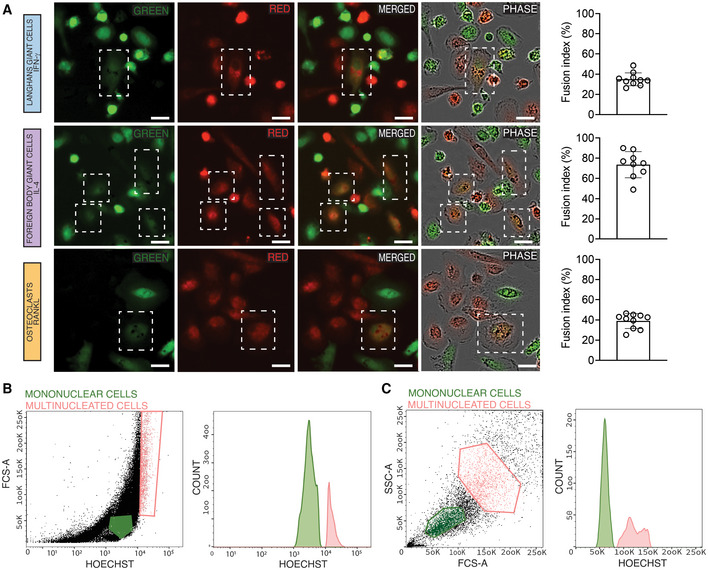
Isolated monocytes were labeled with either green or red dyes and stimulated with IFN‐γ (LGCs), IL‐4 (FBGC), or RANKL (osteoclasts) for giant cell formation. Cell–cell fusion was monitored with live cell imaging system (Incucyte). Orange dye‐labeled giant cells (fusion between red and green) are shown within dotted white boxes. The fusion index is calculated for each cell type (right panel). The data are representative of three biological replicates (donors) and 3–4 technical replicates per donor.
FACS sorting strategy for mononuclear and multinucleated (> 2 nuclei) LGCs and FBGCs based on size and Hoechst (DNA content as a readout of multinucleation).
FACS sorting strategy for mononuclear and multinucleated (> 2 nuclei) osteoclasts based on size and Hoechst (DNA content as a readout of multinucleation).
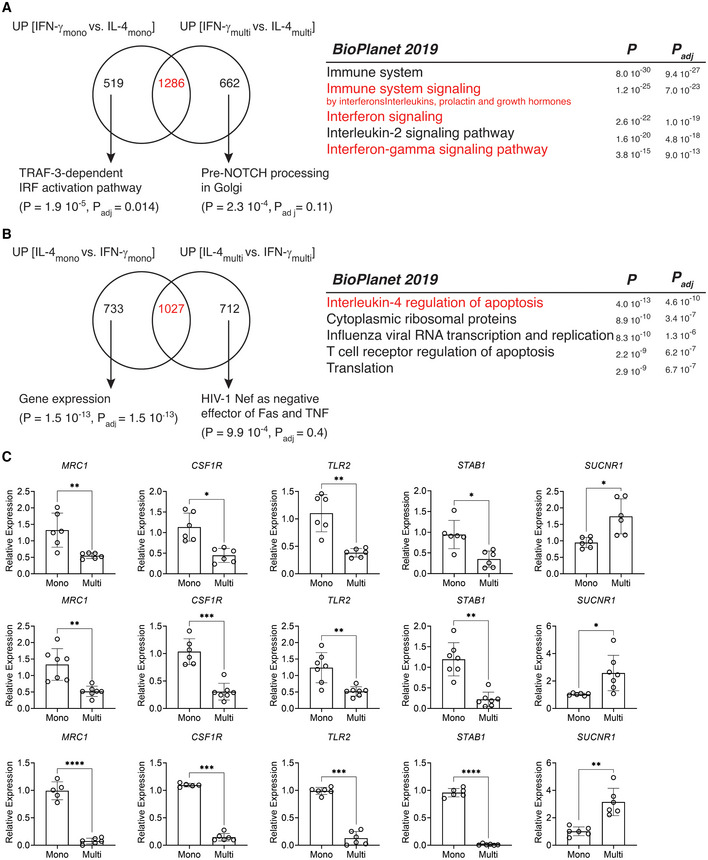
Venn diagram showing the trancriptomic comparison between genes upregulated in mononucleated IFN‐γ vs. IL‐4 stimulated cells (designated as UP [IFN‐γmono vs. IL‐4mono]) and in multinucleated LGCs vs. FBGCs (designated as UP [IFN‐γmulti vs. IL‐4multi]). The most significant group‐specific pathways (BioPlanet 2019) are shown with arrows. The right panel shows the 5 most significant pathways for commonly upregulated 1,286 transcripts. Relevant pathways to IFN‐ γ are shown in red.
Venn diagram showing the trancriptomic comparison between genes upregulated in mononucleated IL‐4 vs. IFN‐γ stimulated cells (designated as UP [IL‐4mono vs. IFN‐γmono]) and in multinucleated FBGCs vs. LGCs (designated as UP [IL‐4multi vs. IFN‐γmulti]). The most significant group‐specific pathways are shown with arrows whereas. The right panel shows the 5 most significant pathways for commonly upregulated 1,027 transcripts. Relevant pathways to IL‐4 are shown in red. Data information: n = 6 donors (LGCs), n = 7 donors (FBGCs).
MRC1, CSF1R, TLR2, STAB1 and SUCNR1 relative expression measured by qRT–PCR in LGCs (upper), FBGCs (middle) and osteoclasts (lower), in sorted mononuclear and multinucleated cells; at least n = 6 donors. Error bars are mean ± SD; significance tested by paired t‐test; *P < 0.05; **P < 0.01; ***P < 0.001; ****P < 0.0001.
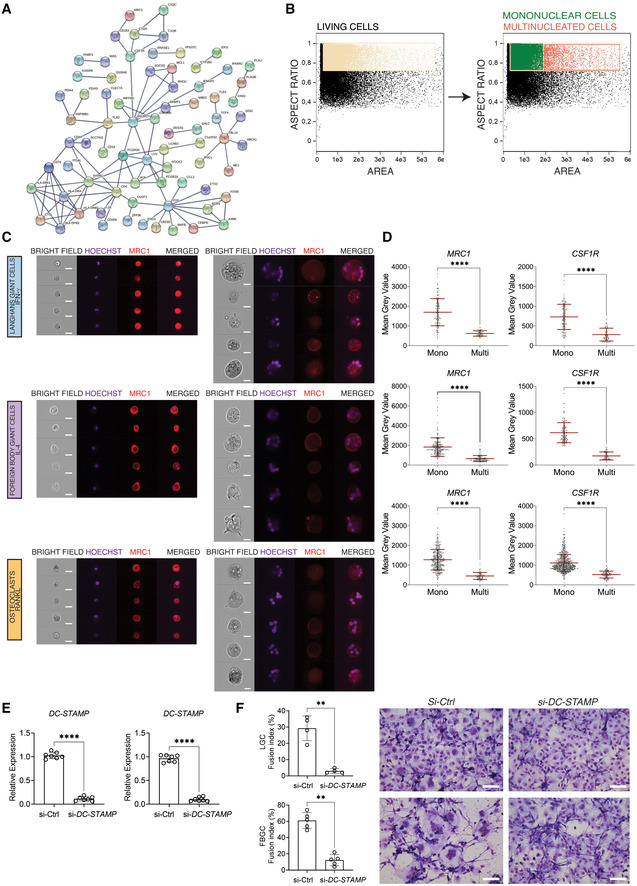
Protein–protein interaction (PPI) network of 191 commonly downregulated genes in LGCs, FBGCs and osteoclasts illustrated by STRING (high confidence score = 0.9, only connected nodes are shown).
ImageStream gating for mononuclear and multinucleated cells shown in LGCs. The gating strategy for FBGCs and osteoclasts is similar.
ImageStream showing bright field, nuclei staining (Hoechst), and MRC1 (red) staining in mononuclear and multinucleated LGCs, FBGCs and osteoclasts.
MRC1 and CSF1R immunofluorescence quantification in mononuclear and multinucleated LGCs (upper), FBGCs (middle) and osteoclasts (lower); n = 2 donors (biological replicates), n > 48 technical replicates per cell type, condition (mono or multi) and surface marker (MRC1 or CSF1R).
DC‐STAMP expression following its knockdown in LGCs (left) and FBGCs (right). si‐Ctrl, scrambled siRNA; si‐DC‐STAMP, DC‐STAMP siRNA; n = 7 donors.
Fusion index following DC‐STAMP knockdown in human LGCs (upper panel) and FBGCs (lower panel); n = 4 donors. Fusion was measured in cells stained with Giemsa in both conditions (right panel).
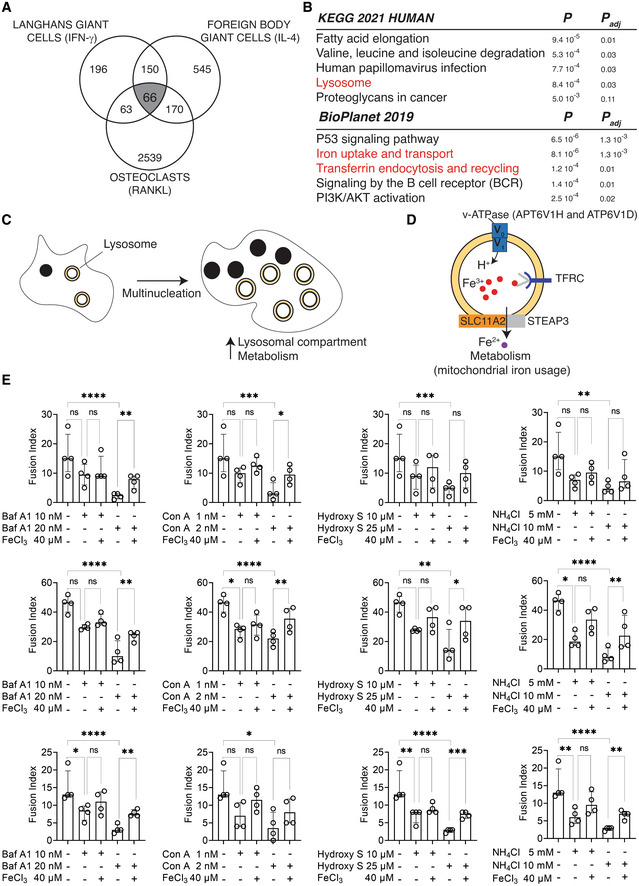
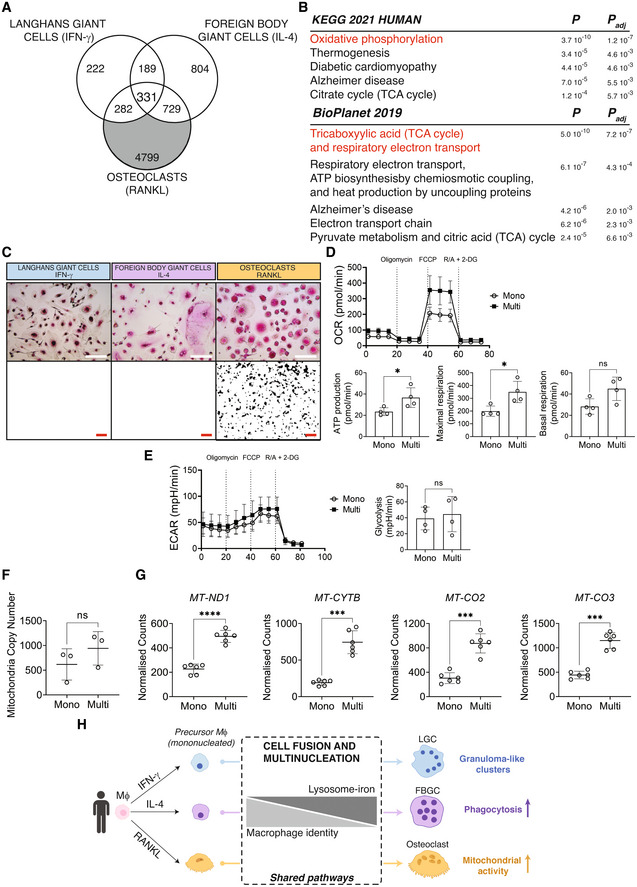
Venn diagram showing the commonly upregulated transcripts (n = 66) in LGCs, FBGCs and osteoclasts (in gray).
KEGG and BioPlanet 2019 pathway analyses on the 66 commonly upregulated genes. Pathways in red are connected.
Macrophage fusion and multinucleation causes an increased lysosomal compartment and cell metabolism.
The commonly upregulated genes in LGCs, FBGCs and osteoclasts (ATP6V1H, ATP6V1D, TFRC and SLC11A2) and their role in the lysosome‐iron pathway.
The effect of lysosomotropic agents (hydroxychloroquine, hydroxy S; ammonium chloride, NH4Cl) and v‐ATPase inhibitors (Bafilomycin A1, Baf A1; Concanamycin A, Con A) on fusion and multinucleation in LGCs (upper panel), FBGCs (middle panel) and osteoclasts (lower panel). To test the effect of lysosome dysfunction on cellular iron, FeCl3 was supplemented. Error bars are median with interquartile range; significance tested by one‐way Anova followed by Sídák's multiple comparisons on log transformed data; n = 4 donors; *P < 0.05; **P < 0.01; ***P < 0.001; ****P < 0.0001.
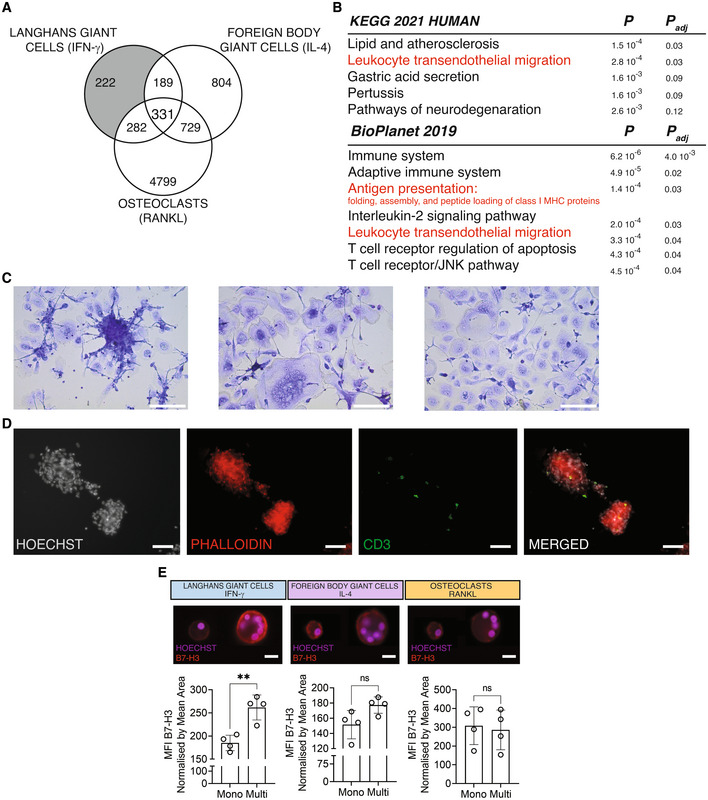
Venn diagram showing the uniquely differentially expressed transcripts in LGCs (in gray).
KEGG and BioPlanet 2019 pathway analyses on the differentially expressed transcripts in LGCs only. Pathways in red are in common in KEGG and BioPlanet or relevant for LGC function.
Giemsa stained LGCs (left), FBGCs (middle) and osteoclasts (right) differentiated from PBMCs. Note the cell cluster formation in LGCs only.
CD3 immunofluorescence (green) in PBMC‐derived LGCs. Hoechst (gray) and phalloidin (red) staining show the nuclei and cytoskeleton, respectively. Merged (CD3, Hoechst, phalloidin) image shows CD3+ T cells in the granuloma‐like clusters.
B7‐H3 surface marker expression (red) acquired by ImageStream in mononuclear and multinucleated LGCs, FBGCs and osteoclasts stained for Hoechst. Bar graphs (lower panel) show normalized B7‐H3 mean fluorescence intensity (MFI), measured by ImageStream; n = 4 donors. Error bars are mean ± SD; significance tested by paired t‐test; **P < 0.01; ns, non‐significant.
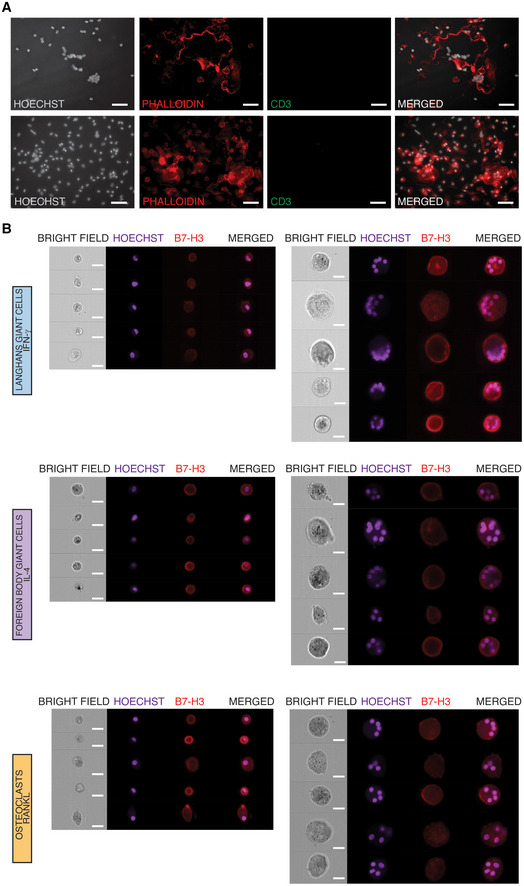
CD3 immunofluorescence in PBMC‐derived FBGCs (upper panel) and osteoclasts (lower panel). Hoechst (gray) and phalloidin (red) staining show the nuclei and cytoskeleton, respectively.
LGCs show increased membrane expression of B7‐H3. ImageStream showing bright field, nuclei staining (Hoechst), and B7‐H3 (red) staining in mononuclear and multinucleated LGCs, FBGCs and osteoclasts.
Venn diagram showing uniquely differentially expressed transcripts in FBGCs (in gray).
KEGG and BioPlanet 2019 pathway analyses on differentially expressed transcripts in FBGCs only.
Phagocytosis quantified by ImageStream analysis in LGCs, FBGCs and osteoclasts. Representative images showing the uptake of S. aureus bioparticles (yellow) in mononuclear (mono) and multinucleated (multi) cells. Bar graphs (lower panel) show normalized S. aureus bioparticles mean fluorescence intensity (MFI) measured by ImageStream; n = 5 donors. Error bars are mean ± SD; significance tested by paired t‐test; **P < 0.01; ns, non‐significant. Scale bars, 20 μm.
Venn diagram showing uniquely differentially expressed transcripts in osteoclasts (in gray).
KEGG and BioPlanet 2019 pathway analyses on differentially expressed transcripts in osteoclasts only. Pathways in red overlap between KEGG and BioPlanet.
TRAP immunohistochemistry (upper panel) and hydroxyapatite resorption (lower panel) in LGCs, FBGCs and osteoclasts. Note the presence of TRAP+ MGCs in all cell types and hydroxyapatite resorption only in osteoclasts.
Oxygen consumption rate (OCR, upper panel) and its related readout (lower panel) measured by extracellular flux analysis in sorted mononuclear and multinucleated osteoclasts; n = 4 donors.
Extracellular acidification rate (ECAR, left) and glycolysis (right) in mononuclear and multinucleated osteoclasts; n = 4 donors.
Mitochondria copy number measured by qPCR in mononuclear and multinucleated osteoclasts; n = 3 donors.
Expression of mitochondrial transcripts in sorted mononuclear and multinucleated osteoclasts after normalization by mitochondrial copy number; n = 6 donors.
Cartoon illustrating human macrophage multinucleation, its shared and lineage‐specific pathways.
References
-
- Amaral A, Ramalho‐Santos J, St John JC (2007) The expression of polymerase gamma and mitochondrial transcription factor a and the regulation of mitochondrial DNA content in mature human sperm. Hum Reprod 22: 1585–1596 - PubMed
-
- Aziz A, Soucie E, Sarrazin S, Sieweke MH (2009) MafB/c‐Maf deficiency enables self‐renewal of differentiated functional macrophages. Science 326: 867–871 - PubMed
Publication types
MeSH terms
Substances
Associated data
- Actions
Grants and funding
LinkOut - more resources
Full Text Sources
Molecular Biology Databases
Research Materials
