. 2023 Apr;78(4):335-343.
doi: 10.1136/thorax-2021-217736. Epub 2022 Dec 7.

Th2 high and mast cell gene signatures are associated with corticosteroid sensitivity in COPD

Affiliations

Th2 high and mast cell gene signatures are associated with corticosteroid sensitivity in COPD

Alen Faiz et al. Thorax. 2023 Apr.

Abstract

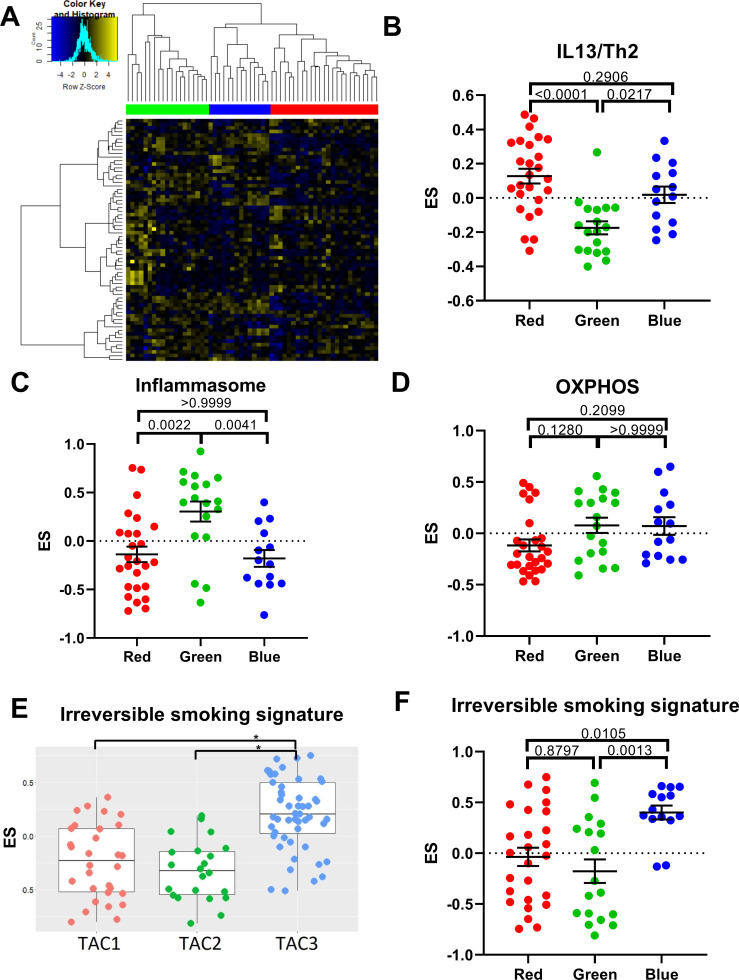
Rationale: Severe asthma and chronic obstructive pulmonary disease (COPD) share common pathophysiological traits such as relative corticosteroid insensitivity. We recently published three transcriptome-associated clusters (TACs) using hierarchical analysis of the sputum transcriptome in asthmatics from the Unbiased Biomarkers for the Prediction of Respiratory Disease Outcomes (U-BIOPRED) cohort comprising one Th2-high inflammatory signature (TAC1) and two Th2-low signatures (TAC2 and TAC3).

Objective: We examined whether gene expression signatures obtained in asthma can be used to identify the subgroup of patients with COPD with steroid sensitivity.

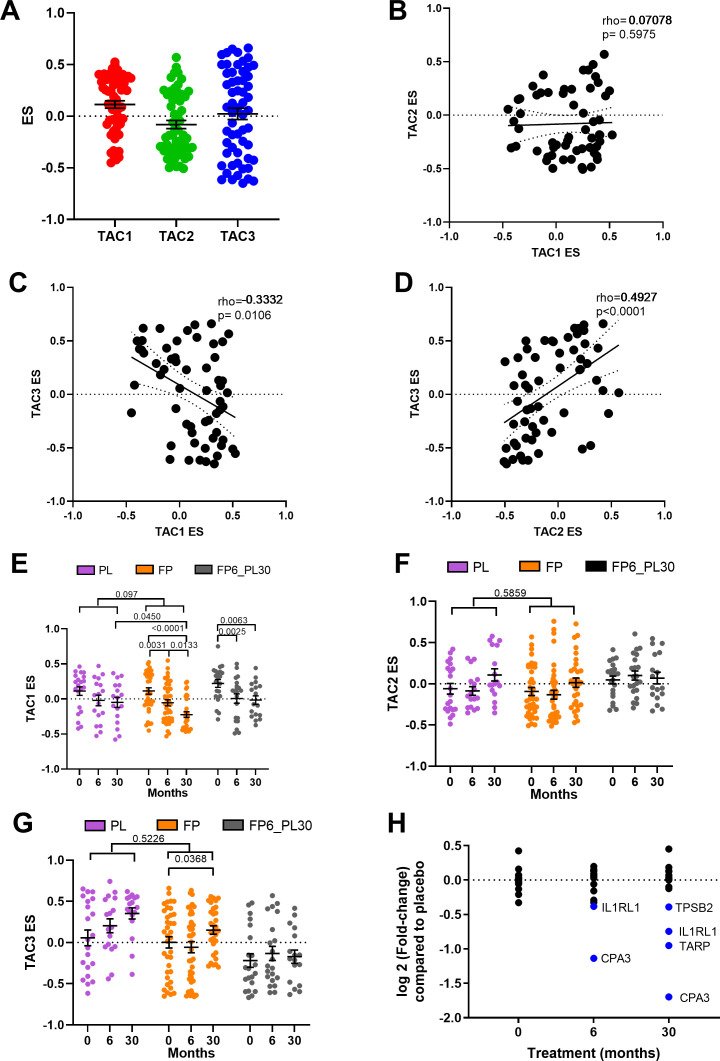
Methods: Using gene set variation analysis, we examined the distribution and enrichment scores (ES) of the 3 TACs in the transcriptome of bronchial biopsies from 46 patients who participated in the Groningen Leiden Universities Corticosteroids in Obstructive Lung Disease COPD study that received 30 months of treatment with inhaled corticosteroids (ICS) with and without an added long-acting β-agonist (LABA). The identified signatures were then associated with longitudinal clinical variables after treatment. Differential gene expression and cellular convolution were used to define key regulated genes and cell types.

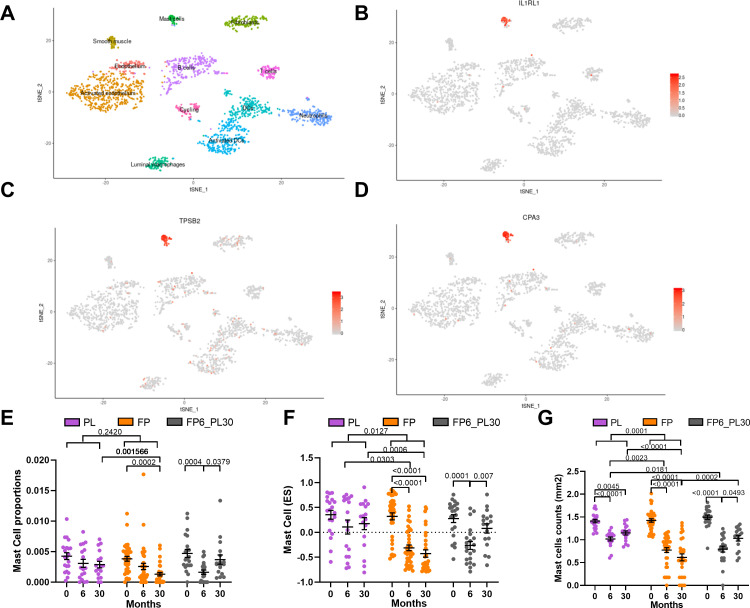
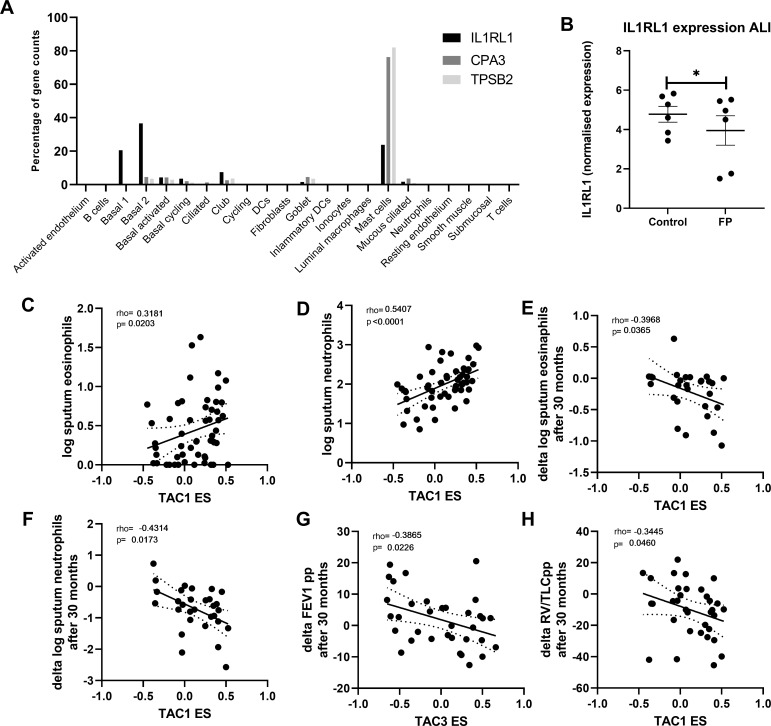
Measurements and main results: Bronchial biopsies in patients with COPD at baseline showed a wide range of expression of the 3 TAC signatures. After ICS±LABA treatment, the ES of TAC1 was significantly reduced at 30 months, but those of TAC2 and TAC3 were unaffected. A corticosteroid-sensitive TAC1 signature was developed from the TAC1 ICS-responsive genes. This signature consisted of mast cell-specific genes identified by single-cell RNA-sequencing and positively correlated with bronchial biopsy mast cell numbers following ICS±LABA. Baseline levels of gene transcription correlated with the change in RV/TLC %predicted following 30-month ICS±LABA.

Conclusion: Sputum-derived transcriptomic signatures from an asthma cohort can be recapitulated in bronchial biopsies of patients with COPD and identified a signature of airway mast cells as a predictor of corticosteroid responsiveness.

Keywords: COPD pathology; airway epithelium; oxidative stress.


Conflict of interest statement

Competing interests: None declared.

Figures

Figure 1
Figure 1
Identification of transcriptome-associated cluster (TAC) signatures in bronchial biopsies. (A) Heatmap of genes that best discriminate each bronchial-derived TAC (TAC) signature (n=58). Columns represent subjects with COPD and rows represent genes. Association of TAC groups 1–3 with gene signatures derived from interleukin (IL)13/T helper (Th)2-stimulated epithelial cells (B), inflammasome activation (C), oxidative phosphorylation (OXPHOS) (D), cigarette smoke irreversibly upregulated signature in sputum samples from U-BIOPRED (E) and cigarette smoke irreversibly upregulated signatures in bronchial brushes in Groningen Leiden Universities Corticosteroids in Obstructive Lung Disease TAC groups (F). A one-way analysis of variance was used to compare each TAC group. A Bonferroni adjusted p value <0.05 was considered significant. *P<0.05. ES, enrichment score.
Figure 2
Figure 2
Relationship between bronchial-derived transcriptome-associated cluster (TAC) signatures and the influence of inhaled corticosteroid (ICS) treatment. (A) Box plot of the expression of TAC signatures across all patients at baseline (median±95% CI). Correlations of the expression signatures between (B) TAC1 and TAC2, (C) TAC1 and TAC3 and (D) TAC2 and TAC3 (n=58). The influence of ICS treatment on (E) TAC1, (F) TAC2 and (G) TAC3. (H) Fold-change of TAC1 genes comparing bronchial expression profiles of treatment arms to time match placebo of the Groningen Leiden Universities Corticosteroids in Obstructive Lung Disease study at baseline, 6 months and 30 months. Blue represents significant downregulated genes (adjusted p value <0.05). Mean±SEM is presented in the figures. For two-way analysis of variance, a Benjamini-Hochberg adjusted p value <0.05 was considered significant. An interaction analysis was conducted on TAC signatures using an LME model investigating the interaction between time and treatment with patient ID as the random factor. ES, enrichment score; FP, fluticasone propionate; FP6_PL30, FP for 6 months and then 24 months with placebo; LME, linear mixed effect; PL, placebo±salmeterol.
Figure 3
Figure 3
Determining the basis of inhaled corticosteroids (ICS) sensitivity of the TAC1 signature. tSNE plots for ICS-sensitive TAC1 genes (interleukin 1 receptor like 1 (IL1RL1), tryptase beta-2 (TPSB2) and carboxypeptidase A3 (CPA3)), obtained from of single-cell sequencing data obtained from asthmatic (n=4) and healthy controls (n=4) (A–D). The tSNE plot shows the expression of the selected gene across cell types identified in the single-cell sequencing data with each dot representing a single cell. Panel A highlights the position of each cell type. Analysis of mast cell quantification in bronchial biopsies derived from patients with COPD treated with either placebo, ICS for 6-month then 24-month withdrawal or ICS±long-acting β-agonist (LABA) for 30 months ICS treatment using (E) cellular deconvolution. (F) Gene set variation analysis (GSVA) analysis of a 11 gene mast cell signature derived from single-cell sequencing and (G) histological measurement of log mast cell counts (AA1-positive cells) in bronchial biopsies (mm2). ES, enrichment score; FP, fluticasone propionate±salmeterol; FP6_PL30, FP for 6 months and then 24 months with placebo; PL, placebo. For two-way analysis of variance (ANOVA), a Benjamini-Hochberg adjusted p value <0.05 was considered significant. An interaction analysis was conducted on mast cell signatures using an LME model investigating the interaction between time and treatment with patient ID as the random factor. Mean±SEM is presented in the figures.
Figure 4
Figure 4
Correlation of bronchial-derived transcriptome-associated cluster (TAC) signatures and inflammatory cell counts. (A) Expression distribution of interleukin 1 receptor like 1 (IL1RL1), carboxypeptidase A3 (CPA3) and tryptase beta-2 (TPSB2)from single-cell sequencing data from bronchial biopsies (n=8). (B) IL1RL1 expression from primary airway epithelial cells grown at air-liquid interface, quiesced overnight and then treated with fluticasone propionate (FP; 10−8 M) for 24 hours (n=6 donors). Correlation of TAC1 signature at baseline with sputum (C) log eosinophil counts and (D) log neutrophil counts (n=58). Correlation of TAC1 signature at baseline with (E) change in log eosinophil counts and (F) delta log neutrophil counts after 30 months inhaled corticosteroids (ICS)±long-acting β-agonist (LABA). (G) Correlation of TAC3 signature at baseline with delta forced expiratory volume in 1 s (FEV1) %predicted. (H) Correlation of ICS-sensitive TAC1 signature at baseline with delta FEV1 %predicted. ES, enrichment score.

Comment in

References

    1. Postma DS, Rabe KF. The asthma-COPD overlap syndrome. N Engl J Med 2015;373:1241–9. 10.1056/NEJMra1411863 - DOI - PubMed
    1. Cosio BG, Soriano JB, López-Campos JL, et al. . Defining the asthma-COPD overlap syndrome in a COPD cohort. Chest 2016;149:45–52. 10.1378/chest.15-1055 - DOI - PubMed
    1. Christenson SA, Steiling K, van den Berge M, et al. . Asthma–COPD overlap. Clinical relevance of genomic signatures of type 2 inflammation in chronic obstructive pulmonary disease. Am J Respir Crit Care Med 2015;191:758–66. 10.1164/rccm.201408-1458OC - DOI - PMC - PubMed
    1. Vestbo J, Søorensen T, Lange P, et al. . Long-term effect of inhaled budesonide in mild and moderate chronic obstructive pulmonary disease: a randomised controlled trial. The Lancet 1999;353:1819–23. 10.1016/S0140-6736(98)10019-3 - DOI - PubMed
    1. Burge PS, Calverley PM, Jones PW, et al. . Randomised, double blind, placebo controlled study of fluticasone propionate in patients with moderate to severe chronic obstructive pulmonary disease: the ISOLDE trial. BMJ 2000;320:1297–303. 10.1136/bmj.320.7245.1297 - DOI - PMC - PubMed

Publication types

MeSH terms