. 2023 Jan 31;97(1):e0143022.
doi: 10.1128/jvi.01430-22. Epub 2023 Jan 4.

Combined Immune Checkpoint Blockade Enhances Antiviral Immunity against Bovine Leukemia Virus

Affiliations

Combined Immune Checkpoint Blockade Enhances Antiviral Immunity against Bovine Leukemia Virus

Hayato Nakamura et al. J Virol. .

Abstract

Bovine leukemia virus (BLV) is a retrovirus that causes enzootic bovine leukosis (EBL) in cattle and is widespread in many countries, including Japan. Recent studies have revealed that the expression of immunoinhibitory molecules, such as programmed death-1 (PD-1) and PD-ligand 1, plays a critical role in immunosuppression and disease progression during BLV infection. In addition, a preliminary study has suggested that another immunoinhibitory molecule, T-cell immunoglobulin domain and mucin domain-3 (TIM-3), is involved in immunosuppression during BLV infection. Therefore, this study was designed to further elucidate the immunoinhibitory role of immune checkpoint molecules in BLV infection. TIM-3 expression was upregulated on peripheral CD4+ and CD8+ T cells in BLV-infected cattle. Interestingly, in EBL cattle, CD4+ and CD8+ T cells infiltrating lymphomas expressed TIM-3. TIM-3 and PD-1 were upregulated and coexpressed in peripheral CD4+ and CD8+ T cells from BLV-infected cattle. Blockade by anti-bovine TIM-3 monoclonal antibody increased CD69 expression on T cells and gamma interferon (IFN-γ) production from peripheral blood mononuclear cells from BLV-infected cattle. A syncytium formation assay also demonstrated the antiviral effects of TIM-3 blockade against BLV infection. The combined inhibition of TIM-3 and PD-1 pathways significantly enhanced IFN-γ production and antiviral efficacy compared to inhibition alone. In conclusion, the combined blockade of TIM-3 and PD-1 pathways shows strong immune activation and antiviral effects and has potential as a novel therapeutic method for BLV infection. IMPORTANCE Enzootic bovine leukosis caused by bovine leukemia virus (BLV) is an important viral disease in cattle, causing severe economic losses to the cattle industry worldwide. The molecular mechanisms of BLV-host interactions are complex. Previously, it was found that immune checkpoint molecules, such as PD-1, suppress BLV-specific Th1 responses as the disease progresses. To date, most studies have focused only on how PD-1 facilitates escape from host immunity in BLV-infected cattle and the antiviral effects of the PD-1 blockade. In contrast, how T-cell immunoglobulin domain and mucin domain-3 (TIM-3), another immune checkpoint molecule, regulates anti-BLV immune responses is rarely reported. It is also unclear why PD-1 inhibition alone was insufficient to exert anti-BLV effects in previous clinical studies. In this study, the expression profile of TIM-3 in T cells derived from BLV-infected cattle suggested that TIM-3 upregulation is a cause of immunosuppression in infected cattle. Based on these results, anti-TIM-3 antibody was used to experimentally evaluate its function in influencing immunity against BLV. Results indicated that TIM-3 upregulation induced by BLV infection suppressed T-cell activation and antiviral cytokine production. Some T cells coexpressed PD-1 and TIM-3, indicating that simultaneous inhibition of PD-1 and TIM-3 with their respective antibodies synergistically restored antiviral immunity. This study could open new avenues for treating bovine chronic infections.

Keywords: PD-L1; TIM-3; bovine leukemia virus; cattle; lymphoma.


Conflict of interest statement

The authors declare no conflict of interest.

Figures
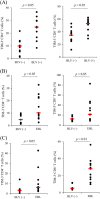
FIG 1
FIG 1
Percentages of TIM-3+ CD4+ or TIM-3+ CD8+ T cells from BLV-infected and uninfected cattle. (A) TIM-3 expression on CD4+ and CD8+ T cells in PBMCs from uninfected cattle [BLV (−); n = 11] and BLV-infected cattle [BLV (+); n = 10] was measured by flow cytometry. (B and C) TIM-3 expression was measured in infiltrating CD4+ or CD8+ T cells from tumorigenic shallow cervical lymph nodes (B) or tumorigenic mesenteric lymph nodes (C) in EBL cattle (n = 12). TIM-3 expression on CD4+ or CD8+ T cells in superficial cervical lymph nodes (B) or mesenteric lymph nodes (C) from uninfected bovines is shown as controls [BLV (−); n = 7]. Statistical significance was determined using the Mann-Whitney U test. The median values for each group are indicated by red bars.
FIG 2
FIG 2
Effects of T-cell activation by inhibiting the TIM-3 pathway using PBMCs derived from healthy cattle. Bovine PBMCs stimulated with anti-bovine CD3 and CD28 MAbs were cultured with anti-TIM-3 antibody for 24 h. CD69 expression (A; n = 9) and IFN-γ intracellular expression (B; n = 18) were measured by flow cytometry. The number of IFN-γ+ CD4+ T cells was reported relative to T-cell stimulation alone. After 3 days of cultivation, IFN-γ in the culture supernatant was measured by ELISA (C; n = 9). Mouse IgG1 antibody was used as a negative control (Cont.). Each antibody was added to a final concentration of 10 μg/mL. Statistical significance was determined by the Wilcoxon signed-rank test.
FIG 3
FIG 3
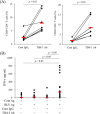
Effects of T-cell activation by inhibiting the TIM-3 pathway using PBMCs derived from BLV-infected cattle. PBMCs derived from BLV-infected cattle were incubated with anti-TIM-3 antibody in the presence of BLV antigen (Ag) for 24 h. CD69 expression on CD4+ and CD8+ T cells was measured by flow cytometry (A; n = 8). IFN-γ production in the culture supernatant was measured by ELISA (B; n = 18). Mouse IgG1 antibody was used as a negative control. Each antibody was added to a final concentration of 10 μg/mL.
FIG 4
FIG 4
TIM-3/PD-1 coexpression in CD4+ and CD8+ T cells in PBMCs derived from BLV-infected cattle. (A) Gating strategy used for TIM-3 and PD-1 staining. Total lymphocytes were first gated in a forward scatter (FSC)/side scatter (SSC) plot and then in a single population. Cells were subsequently gated for the CD3+ population and further gated for CD4 or CD8 expression. Gated CD4+ and CD8+ T cells were analyzed for TIM-3 and PD-1 coexpression, respectively. (B) Percentage of TIM-3+ PD-1+ CD4+ or TIM-3+ PD-1+ CD8+ T cells in uninfected cattle [BLV (−); n = 10] and BLV-infected cattle [BLV (+); n = 13]. The Steel-Dwass test was used for statistical analysis.
FIG 5
FIG 5
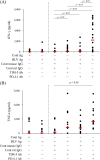
Effects of the dual inhibition of TIM-3 and PD-1 pathways on antiviral cytokine production using PBMCs derived from BLV-infected cattle. PBMCs from BLV-infected cattle (n = 20) were cultured with anti-TIM-3 and/or anti-PD-L1 antibodies in the presence of BLV antigen. IFN-γ (A) and TNF-α (B) concentrations in culture supernatants were measured by ELISA. Statistical significance was determined by the Steel-Dwass test.
FIG 6
FIG 6
Antiviral effects of the dual inhibition of TIM-3 and PD-1 pathways using PBMCs derived from BLV-infected cattle. Indicator cells (CC81+; 0.6 × 105) were cultured at 37°C for 24 h in the presence of 5% CO2. Anti-TIM-3 and anti-PD-L1 antibodies were added simultaneously with PBMCs derived from BLV-infected cattle (n = 12; 5.0 × 105 cells) and cultured for 3 days. Mouse and rat IgG antibodies were used as negative controls. Each antibody was added at a final concentration of 10 μg/mL. After incubation, Giemsa staining was performed, and the number of syncytia containing >10 nuclei was measured. (A) Representative pictures of syncytium formation in each treatment. (B) Number of syncytia in each treatment. Three wells were cultured with PBMCs from each specimen bovine, and results were expressed as the mean from three wells. The Steel-Dwass test was used for statistical analysis. Median values for each group are indicated by red bars.

References

    1. Wherry EJ. 2011. T cell exhaustion. Nat Immunol 12:492–499. 10.1038/ni.2035. - DOI - PubMed
    1. Nguyen LT, Ohashi PS. 2015. Clinical blockade of PD1 and LAG3 — potential mechanisms of action. Nat Rev Immunol 15:45–56. 10.1038/nri3790. - DOI - PubMed
    1. Schietinger A, Greenberg PD. 2014. Tolerance and exhaustion: defining mechanisms of T cell dysfunction. Trends Immunol 35:51–60. 10.1016/j.it.2013.10.001. - DOI - PMC - PubMed
    1. Monney L, Sabatos CA, Gaglia JL, Ryu A, Waldner H, Chernova T, Manning S, Greenfield EA, Coyle AJ, Sobel RA, Freeman GJ, Kuchroo VK. 2002. Th1-specific cell surface protein Tim-3 regulates macrophage activation and severity of an autoimmune disease. Nature 415:536–541. 10.1038/415536a. - DOI - PubMed
    1. Jones RB, Ndhlovu LC, Barbour JD, Sheth PM, Jha AR, Long BR, Wong JC, Satkunarajah M, Schweneker M, Chapman JM, Gyenes G, Vali B, Hyrcza MD, Yue FY, Kovacs C, Sassi A, Loutfy M, Halpenny R, Persad D, Spotts G, Hecht FM, Chun TW, McCune JM, Kaul R, Rini JM, Nixon DF, Ostrowski MA. 2008. Tim-3 expression defines a novel population of dysfunctional T cells with highly elevated frequencies in progressive HIV-1 infection. J Exp Med 205:2763–2779. 10.1084/jem.20081398. - DOI - PMC - PubMed

Publication types

MeSH terms