. 2023 Jan;131(1):17002.
doi: 10.1289/EHP10391. Epub 2023 Jan 4.

Long-Term Air Pollution, Genetic Susceptibility, and the Risk of Depression and Anxiety: A Prospective Study in the UK Biobank Cohort

Affiliations

Long-Term Air Pollution, Genetic Susceptibility, and the Risk of Depression and Anxiety: A Prospective Study in the UK Biobank Cohort

Xu Gao et al. Environ Health Perspect. 2023 Jan.

Abstract

Background: Depression and anxiety are two mental disorders that are often comorbid. However, the associations of long-term air pollution exposure with depression and anxiety remain inconclusive.

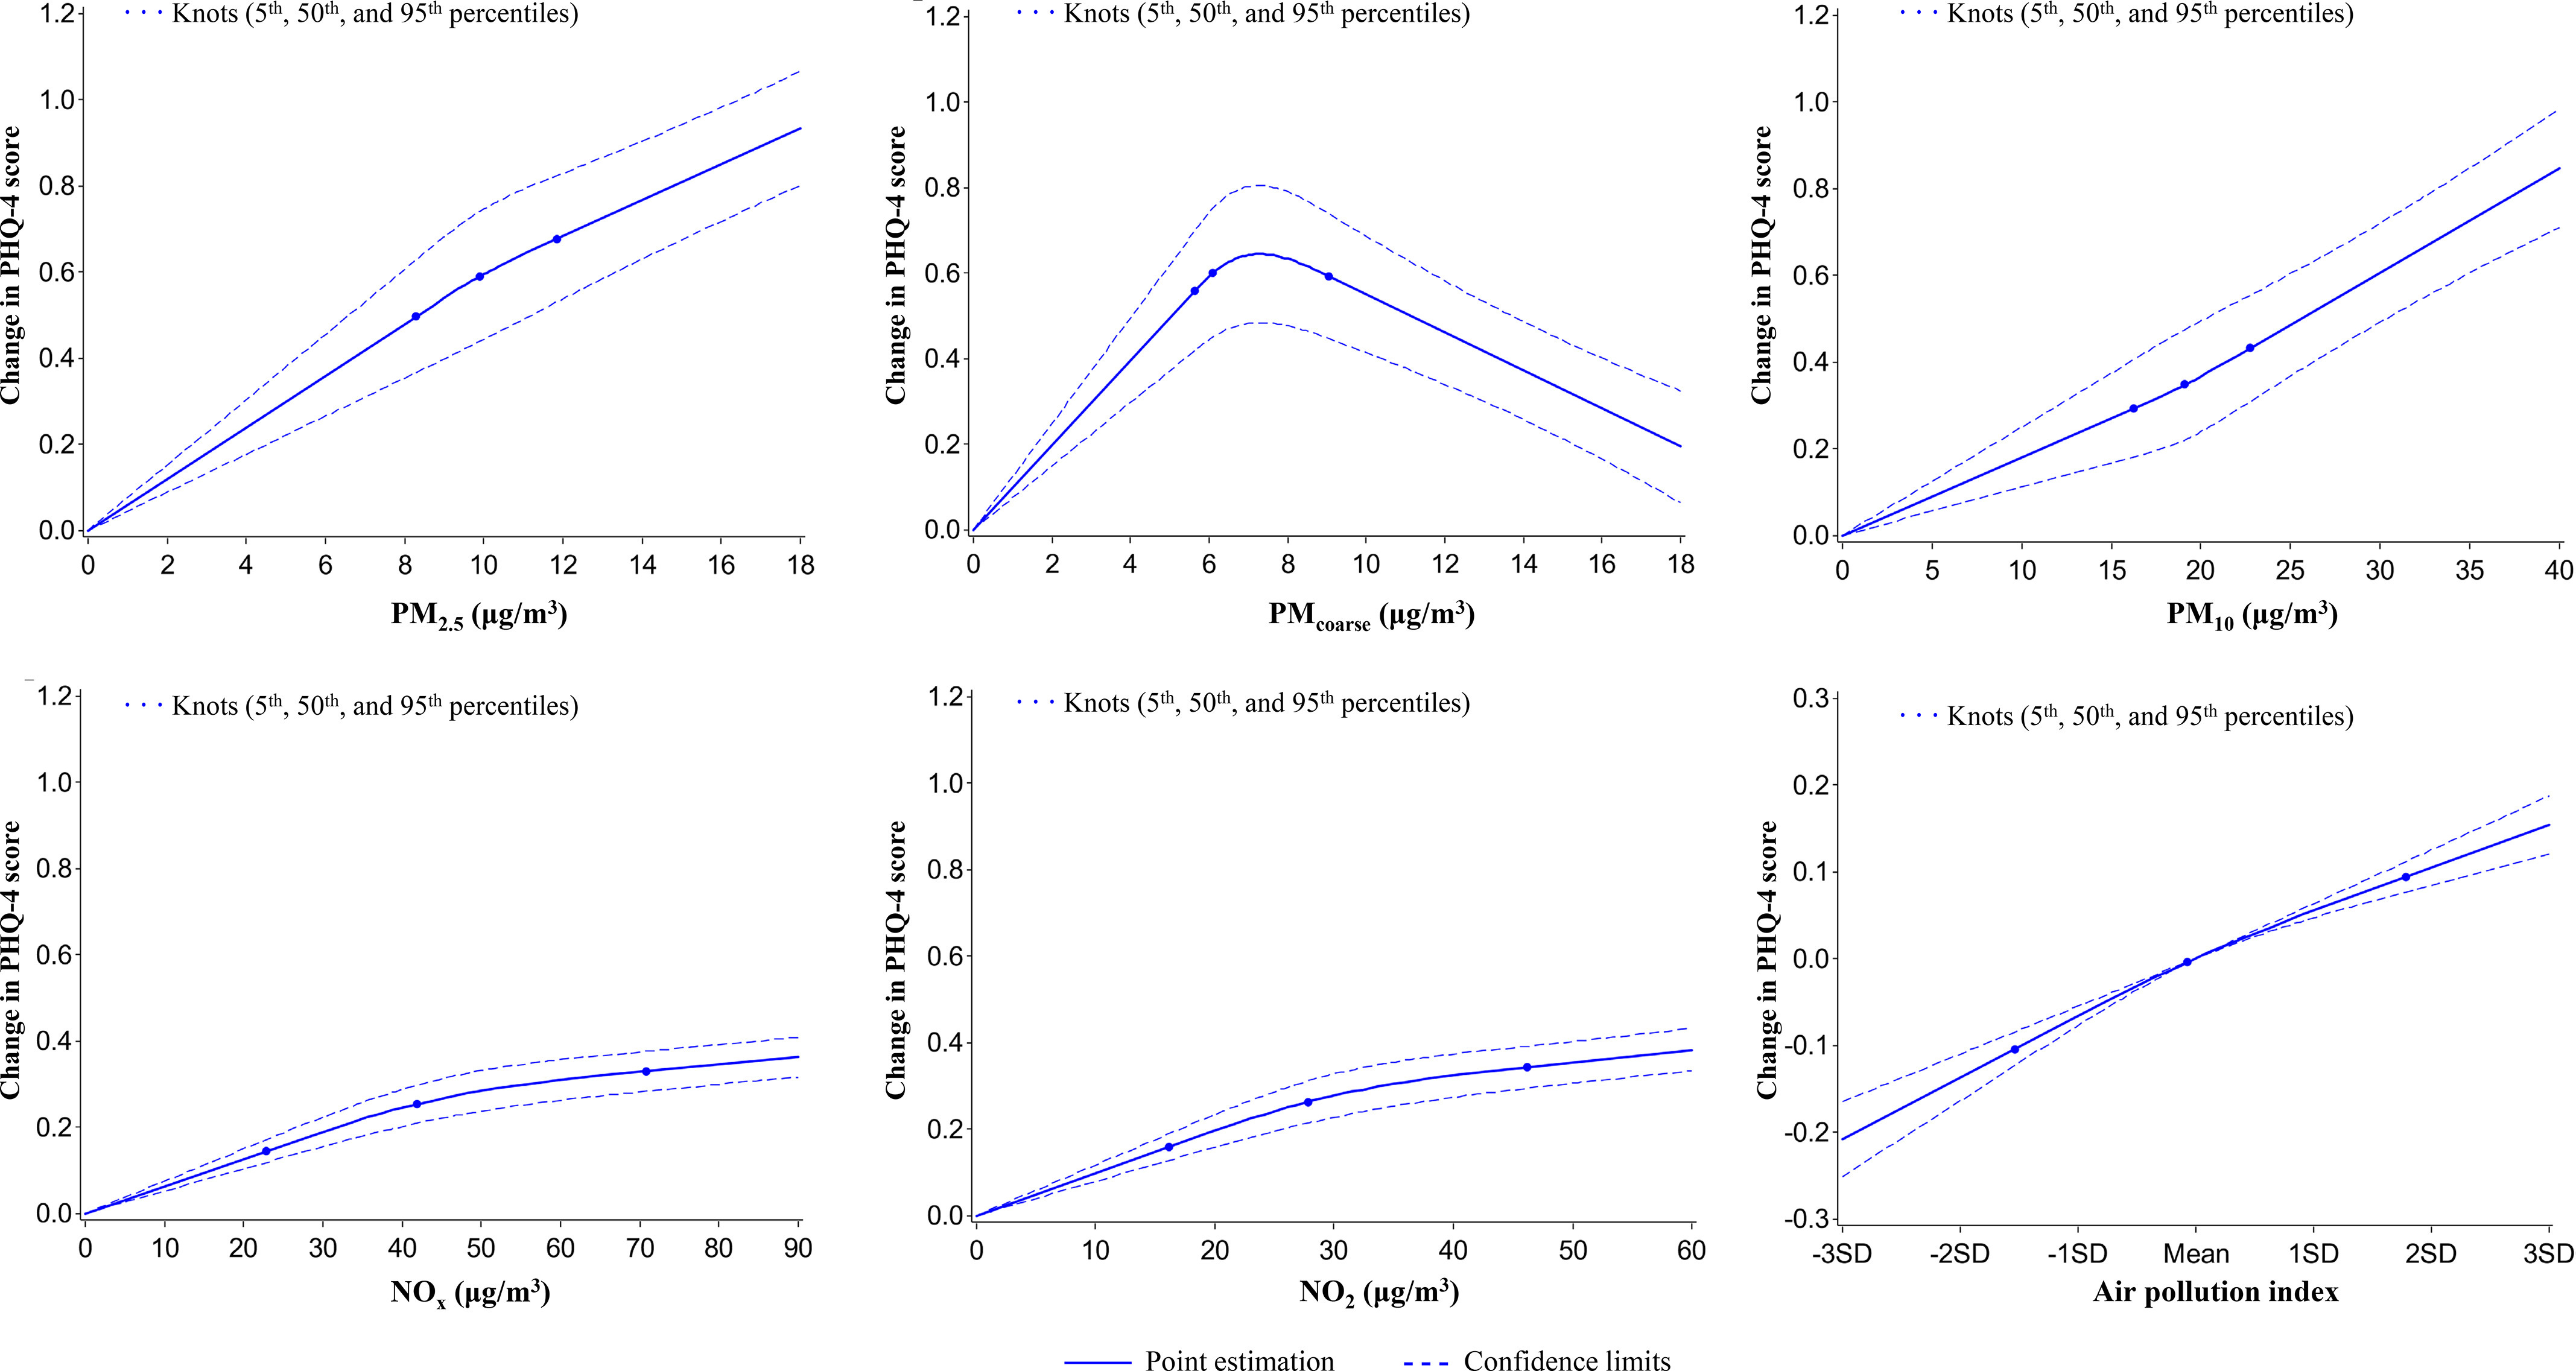
Objective: We conducted a cross-sectional and prospective study to examine the associations of ambient exposure to particulate matter (PM) with a diameter of 2.5μm (PM2.5), 10μm (PM10), and 2.5-10μm (PMcoarse), nitrogen oxides (NOx), and nitrogen dioxide (NO2) with the risk of depression and anxiety in the UK Biobank.

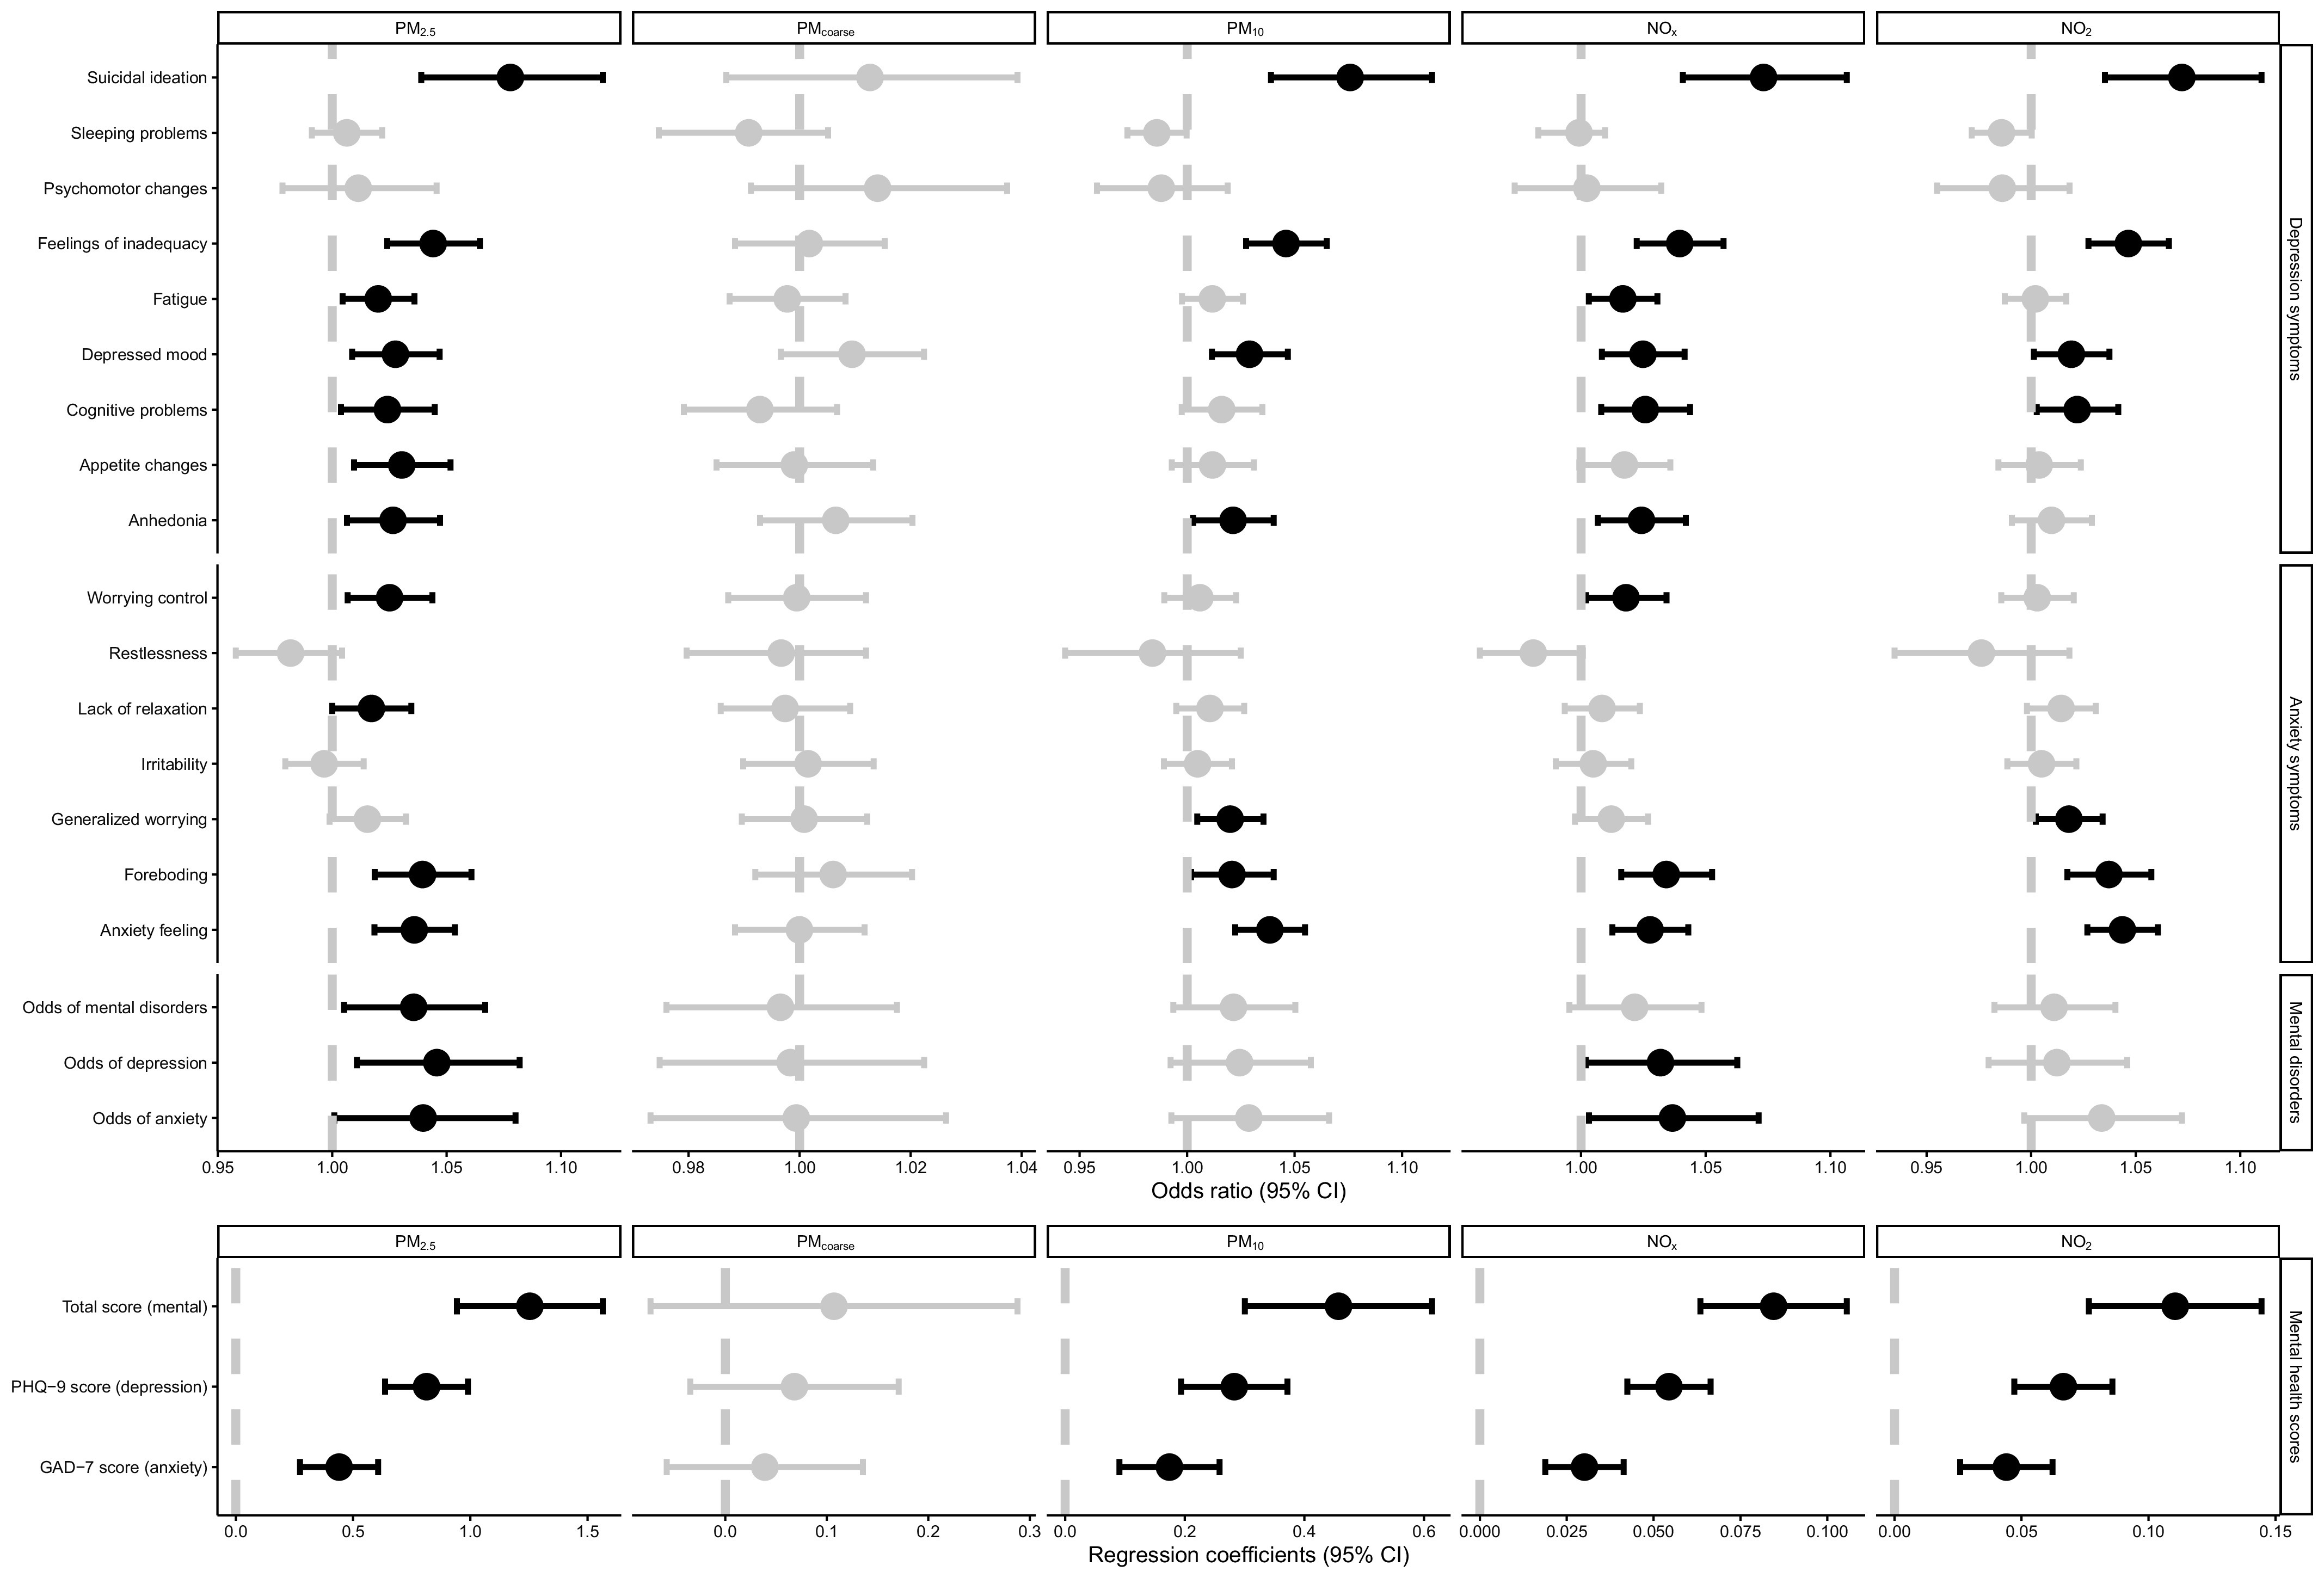
Methods: This study included 398,241 participants from the UK Biobank, 128,456 of whom participated the 7-y online mental health survey. A total of 345,876 individuals were free of depression and anxiety at baseline; of those, 16,185 developed incident mental disorders during a median of 8.7 y of follow-up. Depression and anxiety were assessed using hospital admission records and mental health questionnaires. Associations of air pollution with prevalent and incident mental disorders were examined using logistic regression and Cox regression models, respectively.

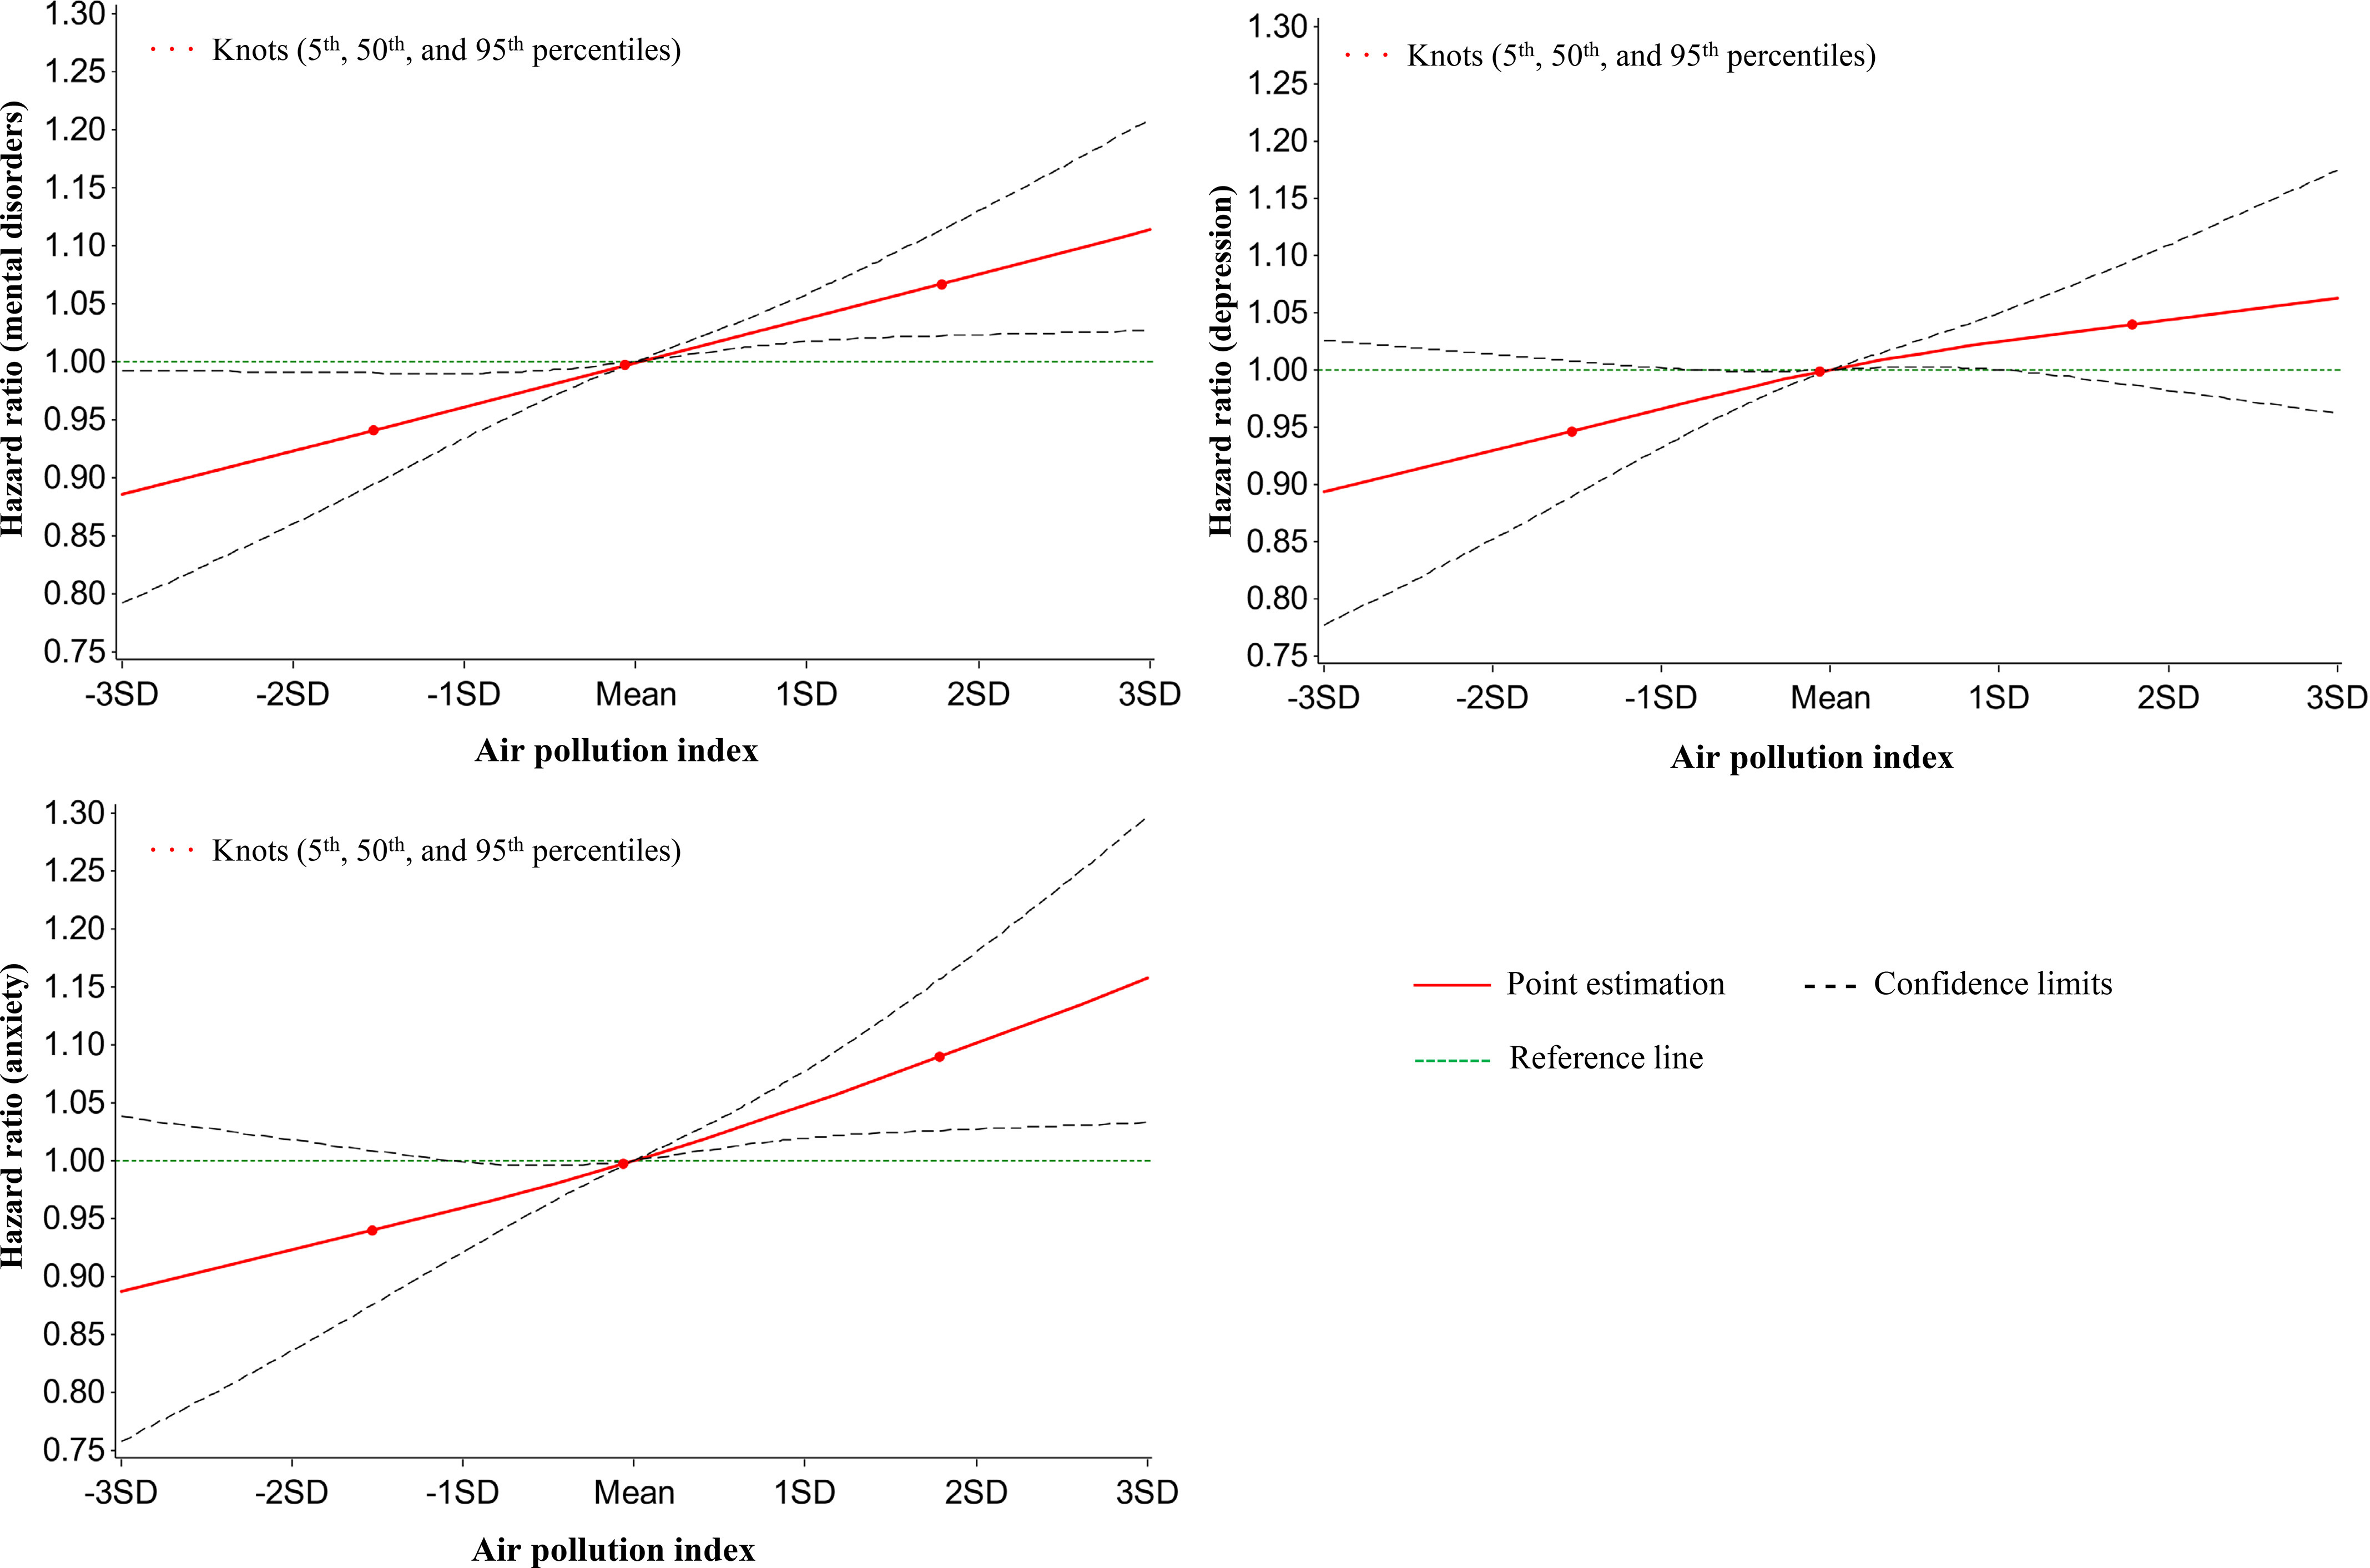
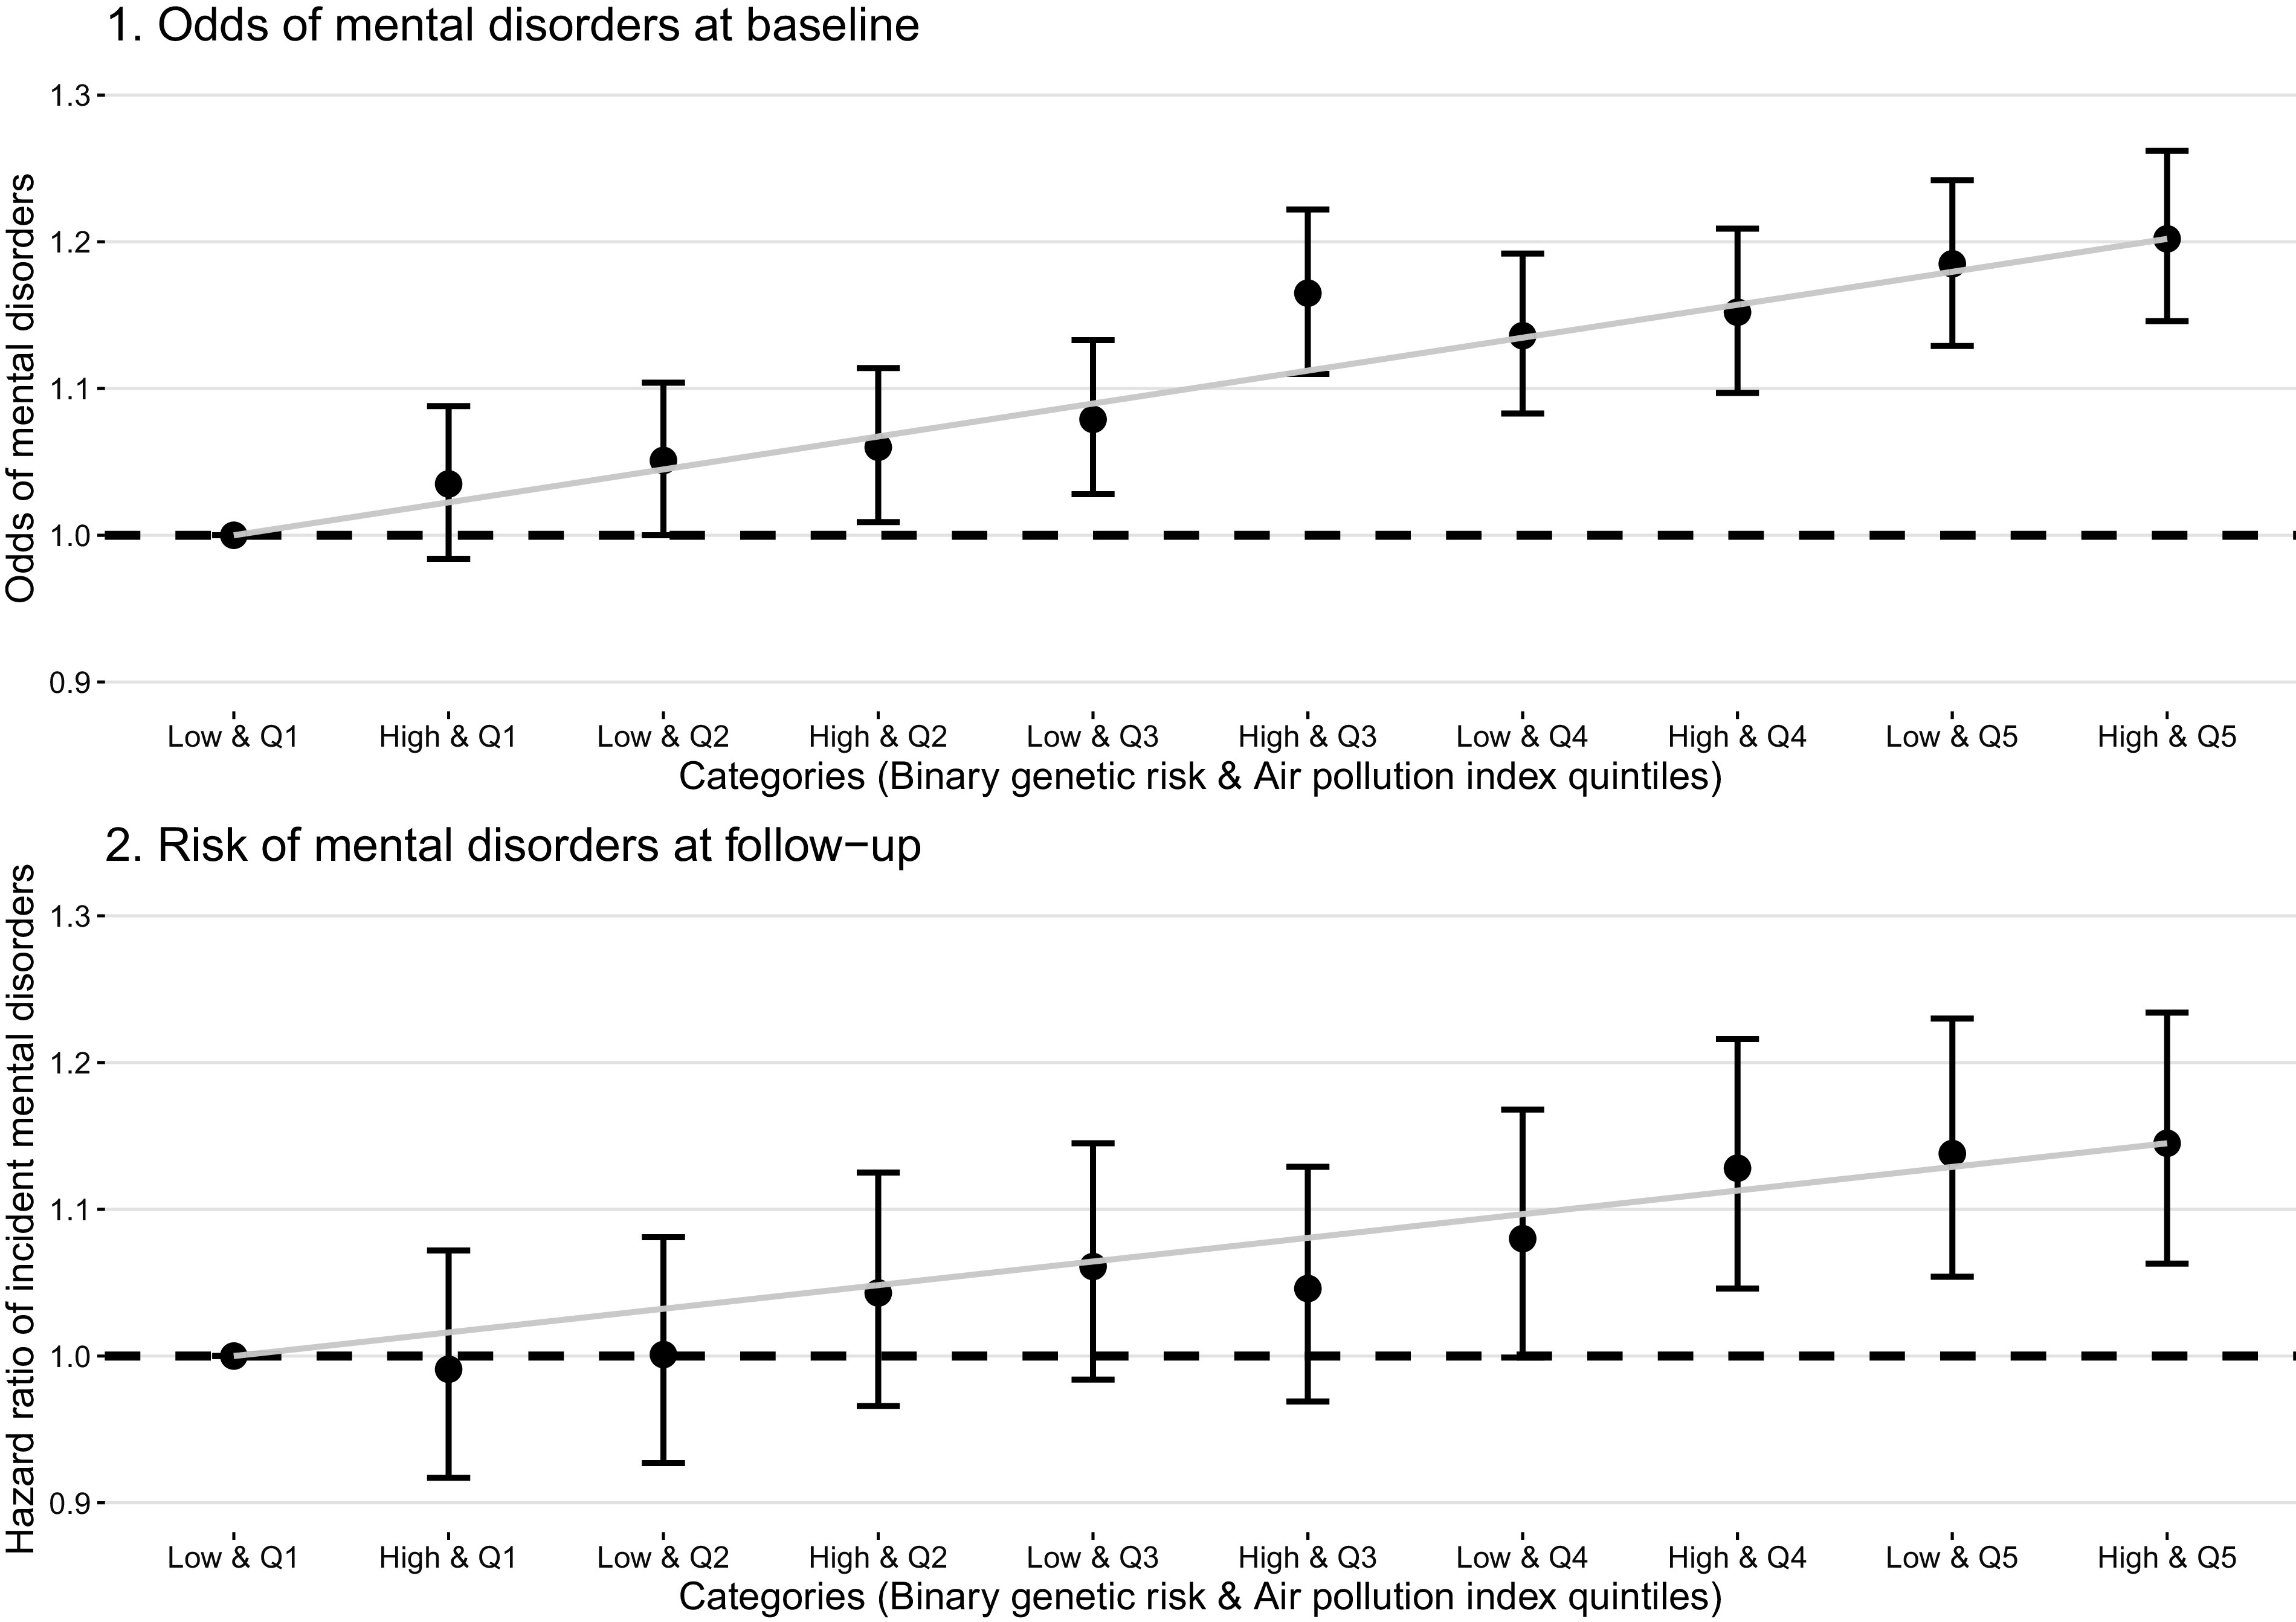
Results: Elevated levels of the five air pollutants were associated with higher odds of mental disorders at baseline. Levels of four pollutants but not PMcoarse were also associated with higher odds and risks of mental disorders during follow-up; specifically, hazard ratios [HR, 95% confidence interval (CI)] of an interquartile range increase in PM2.5, PM10, NOx, and NO2 for incident mental disorders were 1.03 (95% CI: 1.01, 1.05), 1.06 (95% CI: 1.04, 1.08), 1.03 (95% CI: 1.01, 1.05), and 1.06 (95% CI: 1.04, 1.09), respectively. An air pollution index reflecting combined effects of pollutants also demonstrated a positive association with the risk of mental disorders. HR (95% CI) of incident mental disorders were 1.11 (95% CI: 1.05, 1.18) in the highest quintile group in comparison with the lowest quintile of the air pollution index. We further observed that the associations between air pollution and mental disorders differed by a genetic risk score based on single nucleotide polymorphisms previously associated with genetic susceptibility to mental disorders in the UK Biobank cohort.

Discussion: To our knowledge, this research is one of the largest cohort studies that demonstrates an association between mental health disorders and exposure to long-term air pollution, which could be further enhanced by genetic predisposition. https://doi.org/10.1289/EHP10391.


Figures

Figure 1 is a set of six line graphs, plotting change in patient health questionnaire-4 score, ranging from 0.0 to 1.2 in increments of 0.2; 0.0 to 1.2 in increments of 0.2; 0.0 to 1.2 in increments of 0.2; 0.0 to 1.2 in increments of 0.2; 0.0 to 1.2 in increments of 0.2; and negative 0.3 to 0.3 in increments of 0.1 (y-axis) across particulate matter begin subscript 2.5 end subscript (microgram per meter cubed), ranging from 0 to 18 in increments of 2; particulate matter begin subscript coarse end subscript (microgram per meter cubed), ranging from 0 to 18 in increments of 2; particulate matter begin subscript 10 end subscript (microgram per meter cubed), ranging from 0 to 40 in increments of 5; Nitrogen oxide (microgram per meter cubed), ranging from 0 to 90 in increments of 10; Nitrogen dioxide (microgram per meter cubed), ranging from 0 to 60 in increments of 10; and Air pollution index, ranging as negative 3 standard deviation, negative 2 standard deviation, negative 1 standard deviation, mean, 1 standard deviation, 2 standard deviation, and 3 standard deviation (x-axis) for knots, including fifth, fiftieth, and ninety-fifth percentiles.
Figure 1.
Graphs of the best fitting models for relationships of air pollutants and air pollution index with PHQ-4 score for 398,241 participants at baseline. Solid line: Point estimation; Dash line: Confidence limits; Dots: Knots (5th, 50th, and 95th percentiles). The restricted cubic spline regression model adjusted for age, sex, BMI, race (White, Black, Asian, and other), smoking status (current/former/never), healthy alcohol intake status (male: <28g/day; female: <14g/day), healthy physical activity status [150 min/wk moderate or 75 min/wk vigorous or 150 min/wk mixed (moderate + vigorous) activity], years of education (<10 y), FEV1, FVC, Townsend deprivation index, live in urban area (yes/no), and prevalent hypertension, CHD, and diabetes (yes/no). Point estimates and corresponding confidence intervals were shown in Table S10. Note: BMI, body mass index; CHD, coronary heart disease; FEV1, forced expiratory volume in 1 second; FVC, forced vital capacity; min, minutes; NOx, nitrogen oxides; NO2, nitrogen dioxide; PHQ-4, Patient Health Questionnaire-4 questionnaire; PM2.5, particulate matter with diameter of2.5μm; PMcoarse, particulate matter with diameters of 2.510μm; PM10, particulate matter with diameter of10μm.
Figure 2 is a set of two forest plots. On the top, the forest plot, plotting Odds of anxiety, odds of depression, odds of mental disorders, anxiety feeling, foreboding, generalized worrying, irritability, lack of relaxation, restlessness, worrying control, anhedonia, appetite changes, cognitive problems, depressed mood, fatigue, feelings of inadequacy, psychomotor changes, sleeping problems, and suicidal ideation (left y-axis) and mental disorders, anxiety symptoms, depression symptoms (right y-axis) across odds ratio (95 percent confidence intervals), ranging from 0.95 to 1.10 in increments of 0.05 (x-axis) for particulate matter begin subscript 2.5 end subscript, particulate matter begin subscript coarse end subscript, particulate matter begin subscript 10 end subscript, nitrogen oxide, and nitrogen dioxide. At the bottom, a forest plot, plotting generalized anxiety disorder-7 score (anxiety), patient health questionnaire-9 score (depression), and total score (mental) (left y-axis) and mental health scores (right y-axis) across Regression coefficients, ranging from 0.0 to 1.5 in increments of 0.5; 0.0 to 0.3 in increments of 0.1; 0.0 to 0.6 in increments of 0.2; 0.000 to 0.100 in increments of 0.025; and 0.00 to 0.15 in increments of 0.05 (x-axis) for particulate matter begin subscript 2.5 end subscript, particulate matter begin subscript coarse end subscript, particulate matter begin subscript 10 end subscript, nitrogen oxide, and nitrogen dioxide.
Figure 2.
Prospective associations of baseline levels of air pollutants with odds of mental disorders and mental health scores at 7-y survey for the 128,456 participants with available data. Dots: Point estimate; Error bar: 95% confidence limits; Dash line: Reference line. Upper part is the odds ratios of logistic regression; lower part is the coefficients of linear regression. Dots and error bars colored in black are statistically significant, otherwise are colored in gray. Associations of air pollution with mental health scores were tested with mixed-effect linear regression models and associations with the odds of mental disorders, depression, and anxiety at 7-y survey were tested with logistic regression models. Point estimates and corresponding confidence intervals were shown in Table S3. Models adjusted for age, sex, BMI, race (White, Black, Asian, and other), smoking status (current/former/never), healthy alcohol intake status (male: <28g/day; female: <14g/day), healthy physical activity status (150 min/wk moderate or 75 min/wk vigorous or 150 min/wk mixed [(moderate + vigorous) activity], years of education (<10y), FEV1, FVC, Townsend deprivation index, live in urban area (yes/no), and prevalent hypertension, CHD, diabetes (yes/no), and PHQ-4 score at baseline. The examination center was controlled for as a random effect. Note: BMI, body mass index; CHD, coronary heart disease; CI, confidence interval; FEV1, forced expiratory volume in 1 second; FVC, forced vital capacity; min, minutes; GAD-7, General Anxiety Disorder-7; min, minutes; NOx, nitrogen oxides; NO2, nitrogen dioxide; PHQ-4, Patient Health Questionnaire-4 questionnaire; PHQ-9, Patient Health Questionnaire-9 questionnaire; PM2.5, particulate matter with diameter of2.5μm; PMcoarse, particulate matter with diameters of 2.510μm; PM10, particulate matter with diameter of10μm.
Figure 3 is a set of three line graphs, plotting Hazard ratio (mental disorders), ranging from 0.75 to 1.30 in increments of 0.05; hazard ratio (depression), ranging from 0.75 to 1.30 in increments of 0.05; and hazard ratio (anxiety), ranging from 0.75 to 1.30 in increments of 0.05 (y-axis) across air pollution index, ranging as negative 3 standard deviation, negative 2 standard deviation, negative 1 standard deviation, mean, 1 standard deviation, 2 standard deviation, and 3 standard deviation (x-axis) for knots, including fifth, fiftieth, and ninety-fifth percentiles, point estimation, confidence limits, and reference line.
Figure 3.
Graphs of the best fitting models for relationships between air pollution index at baseline and incident mental disorders at follow-up for 345,876 mental disorder-free participants. Solid line: Point estimation; Black dash line: Confidence limits; Green dash line: Reference line; Dots: Knots (5th, 50th, and 95th percentiles). The restricted cubic spline regression model adjusted for age, sex, BMI, race (White, Black, Asian, and other), smoking status (current/former/never), healthy alcohol intake status (male: <28g/day; female: <14g/day), healthy physical activity status [150 min/wk moderate or 75 min/wk vigorous or 150 min/wk mixed (moderate + vigorous) activity], years of education (<10y), FEV1, FVC, Townsend deprivation index, live in urban area (yes/no), and prevalent hypertension, CHD, and diabetes (yes/no). Point estimates and corresponding confidence intervals were shown in Table S11. Note: BMI, body mass index; CHD, coronary heart disease; CI, confidence interval; FEV1, forced expiratory volume in 1 second; FVC, forced vital capacity; min, minutes; NOx, nitrogen oxides; NO2, nitrogen dioxide; PM2.5, particulate matter with diameter of2.5μm; PMcoarse, particulate matter with diameters of 2.510μm; PM10, particulate matter with diameter of10μm; SD, standard deviation.
Figures 4(1) and (2) are error bar graphs titled Odds of mental disorders at baseline and Risk of mental disorders at follow-up, plotting odds of mental disorders, ranging from 0.9 to 1.3 in increments of 0.1 and hazard ratio of incident mental disorders, ranging from 0.9 to 1.3 in increments of 0.1 (y-axis) across categories (binary genetic risk and air pollution index quintiles, ranging as Low and quintile 1, high and quintile 1, low and quintile 2, high and quintile 2, low and quintile 3, high and quintile 3, low and quintile 4, high and quintile 4, low and quintile 5, and high and quintile 5 (x-axis), respectively.
Figure 4.
Joint associations of genetic risk and air pollution levels on the odds of mental disorders for total 398,241 participants and at baseline and incident mental disorders for 345,876 mental disorder-free participants at follow-up. Dots: Point estimate; Error bar: 95% confidence limits; Dash line: Reference line. Associations of air pollution with the odds of mental disorders, depression, and anxiety at baseline were tested with logistic regression models, and associations with the incident mental disorders, depression, and anxiety during the follow-up were tested with Cox proportional hazards models. Models adjusted age, sex, BMI, race (White, Black, Asian, and other), smoking status (current/former/never), healthy alcohol intake status (male: <28g/day; female: <14g/day), healthy physical activity status [150 min/wk moderate or 75 min/wk vigorous or 150 min/wk mixed (moderate + vigorous) activity], years of education (<10y), FEV1, FVC, Townsend deprivation index, live in urban area (yes/no), and prevalent hypertension, CHD, and diabetes (yes/no). The examination center was controlled for as a random effect. Point estimates and corresponding confidence intervals were shown in Table S9. Note: BMI, body mass index; CHD, coronary heart disease; FEV1, forced expiratory volume in 1 second; FVC, forced vital capacity; min, minutes; High, high genetic risk score; Low, low genetic risk score; Q1–Q5, air pollution index quintiles 1st–5th.

Similar articles

Cited by

References

    1. Verhoeven JE, Révész D, van Oppen P, Epel ES, Wolkowitz OM, Penninx BW. 2015. Anxiety disorders and accelerated cellular ageing. Br J Psychiatry 206(5):371–378, PMID: , 10.1192/bjp.bp.114.151027. - DOI - PubMed
    1. Révész D, Verhoeven JE, Milaneschi Y, Penninx BW. 2016. Depressive and anxiety disorders and short leukocyte telomere length: mediating effects of metabolic stress and lifestyle factors. Psychol Med 46(11):2337–2349, PMID: , 10.1017/S0033291716000891. - DOI - PubMed
    1. Cuijpers P, Beekman AT, Reynolds CF 3rd.. 2012. Preventing depression: a global priority. JAMA 307(10):1033–1034, PMID: , 10.1001/jama.2012.271. - DOI - PMC - PubMed
    1. Beaudreau SA, O’Hara R. 2008. Late-life anxiety and cognitive impairment: a review. Am J Geriatr Psychiatry 16(10):790–803, PMID: , 10.1097/JGP.0b013e31817945c3. - DOI - PubMed
    1. Liu Q, Wang W, Gu X, Deng F, Wang X, Lin H, Guo X. 2021. Association between particulate matter air pollution and risk of depression and suicide: a systematic review and meta-analysis. Environ Sci Pollut Res Int 28(8):9029–9049, PMID: , 10.1007/s11356-021-12357-3. - DOI - PubMed

Publication types