Single-cell high-dimensional imaging mass cytometry: one step beyond in oncology
- PMID: 36598557
- PMCID: PMC9812013
- DOI: 10.1007/s00281-022-00978-w
Single-cell high-dimensional imaging mass cytometry: one step beyond in oncology
Abstract
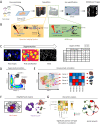
Solid tumors have a dynamic ecosystem in which malignant and non-malignant (endothelial, stromal, and immune) cell types constantly interact. Importantly, the abundance, localization, and functional orientation of each cell component within the tumor microenvironment vary significantly over time and in response to treatment. Such intratumoral heterogeneity influences the tumor course and its sensitivity to treatments. Recently, high-dimensional imaging mass cytometry (IMC) has been developed to explore the tumor ecosystem at the single-cell level. In the last years, several studies demonstrated that IMC is a powerful tool to decipher the tumor complexity. In this review, we summarize the potential of this technology and how it may be useful for cancer research (from preclinical to clinical studies).
Keywords: Cellular network; Hyperion Imaging System; Imaging mass cytometry; MIBI-TOF; Tumor microenvironment.
© 2023. The Author(s).
Conflict of interest statement
The authors declare no competing interests.
Figures

Similar articles
-
From surfing to diving into the tumor microenvironment through multiparametric imaging mass cytometry.Front Immunol. 2025 Apr 11;16:1544844. doi: 10.3389/fimmu.2025.1544844. eCollection 2025. Front Immunol. 2025. PMID: 40292277 Free PMC article. Review.
-
A 31-plex panel for high-dimensional single-cell analysis of murine preclinical models of solid tumors by imaging mass cytometry.Front Immunol. 2023 Jan 19;13:1011617. doi: 10.3389/fimmu.2022.1011617. eCollection 2022. Front Immunol. 2023. PMID: 36741363 Free PMC article.
-
Imaging mass cytometry: High-dimensional and single-cell perspectives on the microenvironment of solid tumours.Prog Biophys Mol Biol. 2022 Nov;175:140-146. doi: 10.1016/j.pbiomolbio.2022.10.003. Epub 2022 Oct 15. Prog Biophys Mol Biol. 2022. PMID: 36252872 Review.
-
High Dimensional Imaging Mass Cytometry Panel to Visualize the Tumor Immune Microenvironment Contexture.Front Immunol. 2021 Apr 16;12:666233. doi: 10.3389/fimmu.2021.666233. eCollection 2021. Front Immunol. 2021. PMID: 33936105 Free PMC article.
-
Application of High-Throughput Imaging Mass Cytometry Hyperion in Cancer Research.Front Immunol. 2022 Mar 31;13:859414. doi: 10.3389/fimmu.2022.859414. eCollection 2022. Front Immunol. 2022. PMID: 35432353 Free PMC article. Review.
Cited by
-
Development of a high dimensional imaging mass cytometry panel to investigate spatial organization of tissue microenvironment in formalin-fixed archival clinical tissues.Heliyon. 2024 May 14;10(10):e31191. doi: 10.1016/j.heliyon.2024.e31191. eCollection 2024 May 30. Heliyon. 2024. PMID: 38803925 Free PMC article.
-
Spatial Proximity of Immune Cell Pairs to Cancer Cells in the Tumor Microenvironment as Biomarkers for Patient Stratification.Cancers (Basel). 2025 Jul 14;17(14):2335. doi: 10.3390/cancers17142335. Cancers (Basel). 2025. PMID: 40723219 Free PMC article.
-
Multiplexed Imaging Mass Cytometry Analysis in Preclinical Models of Pancreatic Cancer.Int J Mol Sci. 2024 Jan 23;25(3):1389. doi: 10.3390/ijms25031389. Int J Mol Sci. 2024. PMID: 38338669 Free PMC article.
-
Spatial-Omics Methods and Applications.Methods Mol Biol. 2025;2880:101-146. doi: 10.1007/978-1-0716-4276-4_5. Methods Mol Biol. 2025. PMID: 39900756 Review.
-
DCLK1 isoform (DCLK1-S) as a critical player in promoting inflammation, tissue remodeling, and EMT in mouse models of colitis.PLoS Pathog. 2025 Aug 21;21(8):e1013360. doi: 10.1371/journal.ppat.1013360. eCollection 2025 Aug. PLoS Pathog. 2025. PMID: 40839695 Free PMC article.
References
-
- Vitale I, Shema E, Loi S, Galluzzi L (2021) Intratumoral heterogeneity in cancer progression and response to immunotherapy. Nat Med 27:212–224. 10.1038/s41591-021-01233-9 - PubMed
Publication types
MeSH terms
LinkOut - more resources
Full Text Sources
Medical

