. 2023 Mar;155(3):247-270.
doi: 10.1007/s11120-022-00994-9. Epub 2023 Jan 4.

Light-induced changes of far-red excited chlorophyll fluorescence: further evidence for variable fluorescence of photosystem I in vivo

Affiliations

Light-induced changes of far-red excited chlorophyll fluorescence: further evidence for variable fluorescence of photosystem I in vivo

Ulrich Schreiber. Photosynth Res. 2023 Mar.

Abstract

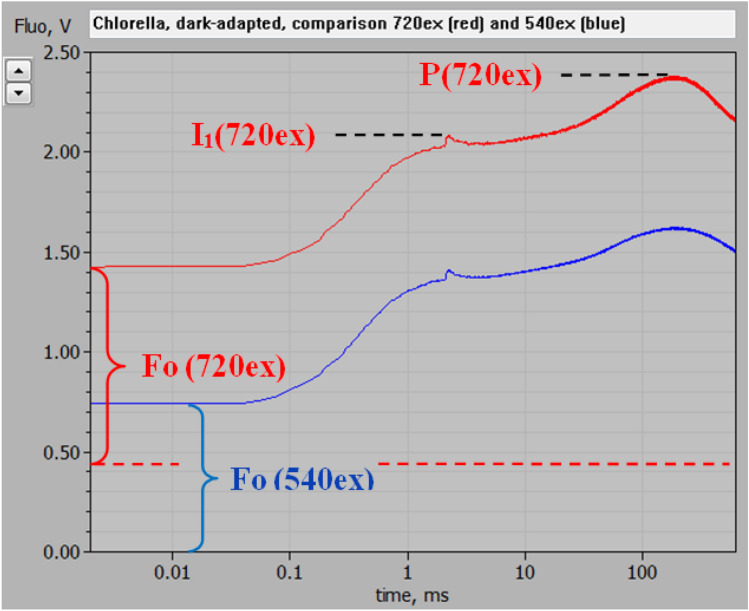
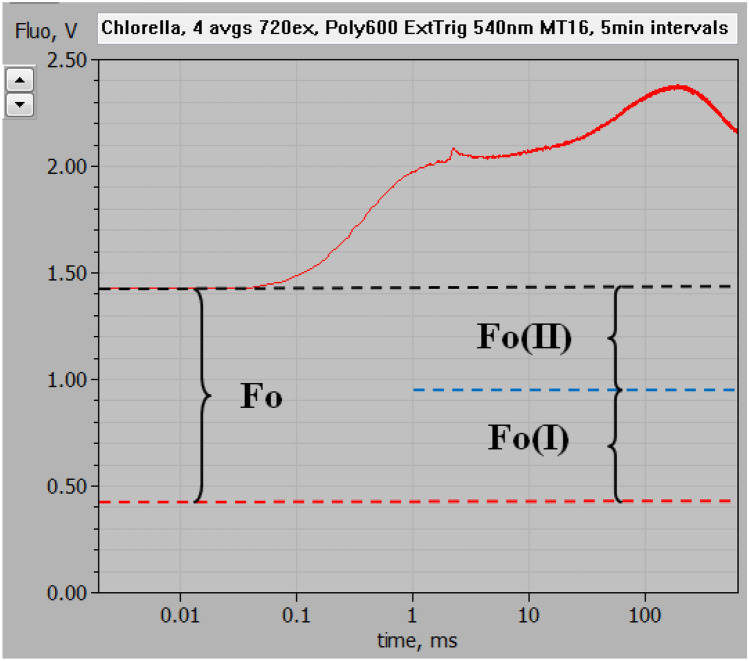
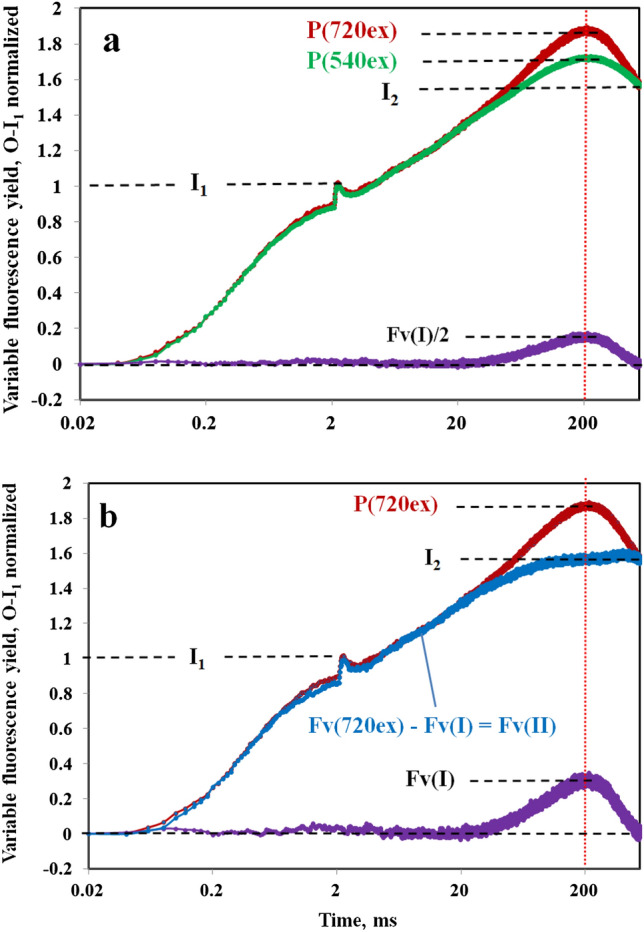
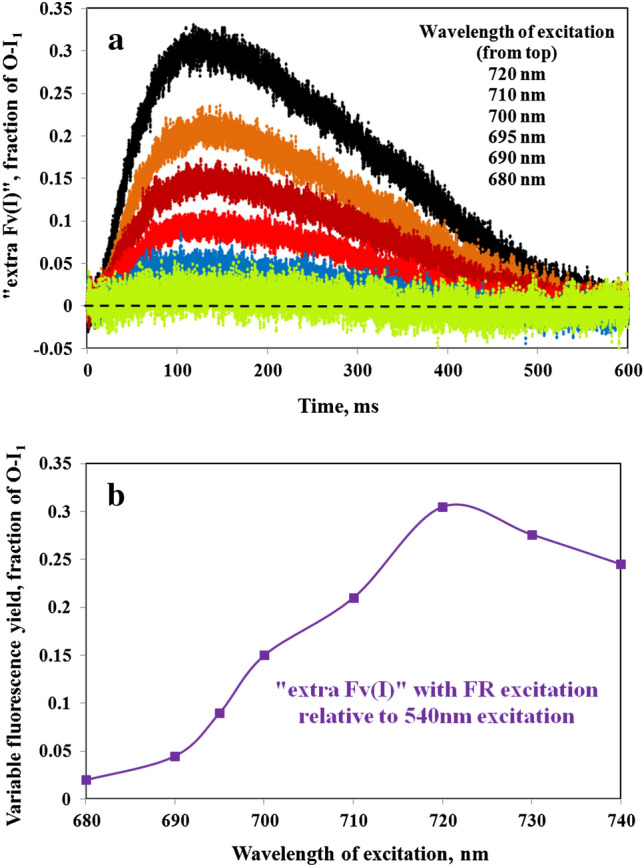
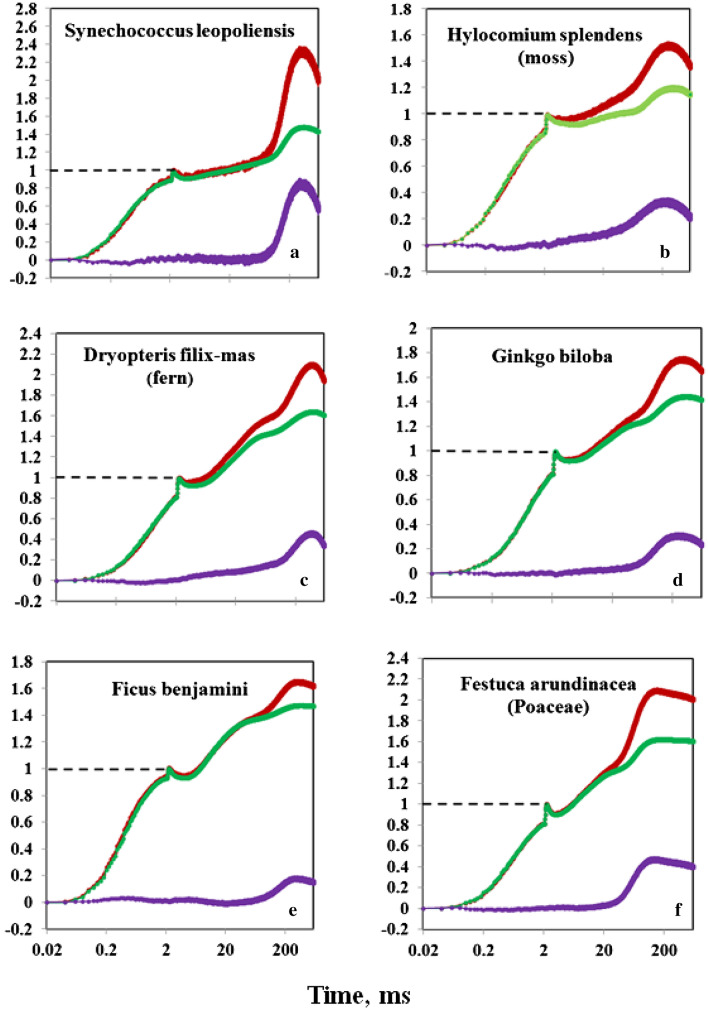
Recently, the long-standing paradigm of variable chlorophyll (Chl) fluorescence (Fv) in vivo originating exclusively from PSII was challenged, based on measurements with green algae and cyanobacteria (Schreiber and Klughammer 2021, PRES 149, 213-231). Fv(I) was identified by comparing light-induced changes of Fv > 700 nm and Fv < 710 nm. The Fv(I) induced by strong light was about 1.5 × larger in Fv > 700 nm compared to Fv < 710 nm. In the present communication, concentrating on the model green alga Chlorella vulgaris, this work is extended by comparing the light-induced changes of long-wavelength fluorescence (> 765 nm) that is excited by either far-red light (720 nm, mostly absorbed in PSI) or visible light (540 nm, absorbed by PSI and PSII). Polyphasic rise curves of Fv induced by saturating 540 nm light are measured, which after normalization of the initial O-I1 rises, assumed to reflect Fv(II), display a 2 × higher I2-P transient with 720 nm excitation (720ex) compared with 540ex. Analysis of the Fo(I) contributions to Fo(720ex) and Fo(540ex) reveals that also Fo(I)720ex is 2 × higher than Fo(I)540ex, which supports the notion that the whole I2-P transient is due to Fv(I). The twofold increase of the excitation ratio of F(I)/F(II) from 680 to 720 nm is much smaller than the eight-tenfold increase of PSI/PSII known from action spectra. It is suggested that the measured F > 765 nm is not representative for the bulk chlorophyll of PSI, but rather reflects a small fraction of far-red absorbing chlorophyll forms ("red Chls") with particular properties. Based on the same approach (comparison of polyphasic rise curves measured with 720ex and 540ex), the existence of Fv(I) is confirmed in a variety of other photosynthetic organisms (cyanobacteria, moss, fern, higher plant leaves).

Keywords: Chlorella; Far-red absorption; Far-red excited chlorophyll fluorescence; Fv(I); F > 765 nm; MULTI-COLOR-PAM; Polyphasic fluorescence rise O-I1-I2-P; Room temperature fluorescence emission; “Red Chls”.


Conflict of interest statement

There is no conflict of interest.

Figures

Fig. 1
Fig. 1
Block diagram of experimental set-up for comparative measurements of light-induced changes of chlorophyll fluorescence yield using far-red (FR) (preferentially 720 nm) or visible (preferentially 540 nm) pulse-modulated excitation. The optical geometry is optimized for homogeneous illumination by both the two types of measuring light (ML) as well as the 540 nm actinic light (AL) and multiple turnover flashes (MT). The relative yield of pulse-modulated fluorescence is measured with a Multi-Color-PAM fluorometer (MC-PAM) controlled by the PamWin-3 software. A custom 540 nm LED array is powered by the control unit (DUAL-C) of a DUAL-PAM-100 and controlled via pre-programmed trigger signals obtained from the MC-PAM. For further explanations, see text
Fig. 2
Fig. 2
Spectra of three types of far-red modulated measuring light (FR-ML) obtained from a custom FR-LED-Array in combination with different FR bandpass filters (10 nm half-bandwidth, bk Interferenzoptik) and additional short-pass filters (SP750, Balzers) for the elimination of wavelengths > 750 nm. The FR-ML was applied at right angle to the photodiode detector, which was protected by a long-pass filter > 765 nm (3 mm RG780, Schott) (for transmission spectrum, see Fig. 3)
Fig. 3
Fig. 3
Filters applied in front of MC-Detector for measuring relative fluorescence yield upon excitation with FR or visible pulse-modulated light. The abbreviations for the measured fluorescence (F > 765, F > 700, and F < 710) characterize the wavelengths at which each of the applied filters displays 15% transmission (broken blue line). While F < 710 is enriched in fluorescence originating from PS II, F(II), F > 700, and F > 765 are enriched in fluorescence originating from photosystem I, F(I)
Fig. 4
Fig. 4
Polyphasic fluorescence rise upon onset of strong actinic illumination measured with dark-adapted Chlorella using 720 nm (red trace, 720ex) and 540 nm (blue trace, 540ex) pulse-modulated measuring light. Screenshot of original recordings with PamWin-3 user surface. At 2 ms, i.e., at the end of the initial “photochemical phase,” a saturating single turnover flash was applied for full closure of PS II reaction centers and definition of the I1 level. In the given dark state an unequivocal identification of the I2 level is not possible (see text). The background signal level with 720ex, as determined under supplementary figures S3–S5, is indicated by the broken red line which thus represents the baseline for the 720ex response, for which the characteristic fluorescence levels Fo, I1, and P are indicated. Measurements were carried out in the optical geometry shown in Fig. 1. Actinic illumination with 600 ms Multiple Turnover pulse (MT) of 540 nm light at 8000 µmol m−2 s−1. Averages of 4 recordings each measured alternatingly using 720ex and 540ex with 5-min dark intervals in between
Fig. 5
Fig. 5
Polyphasic fluorescence rise upon onset of strong actinic illumination measured with dark-adapted Chlorella using 720 nm pulse-modulated excitation, as also shown in Fig. 4, with deconvolution of Fo into the contributions of Fo(I) and Fo(II). The corrected baseline defined by the estimated background signal (see supplementary figures S3–S5) is indicated by the broken red line. For information on the rationale of deconvolution, see text and supplementary figures S6–S7
Fig. 6
Fig. 6
Deconvolution of the Fv(I) and Fv(II) components of the overall Fv(720ex) polyphasic rise kinetics in Chlorella after dark-adaptation (PQ pool partially reduced). a Normalization of Fv(720ex) (red trace) and Fv(540ex) (green trace) at the I1 level, defined at 2 ms (end of the photochemical phase) by a saturating single turnover flash. Derived from original data presented in Fig. 4. With all F(II) components being equal after O-I1 normalization, the difference curve (violet trace) corresponds to Fv(I)/2 contained in Fv(720ex) (see text). b Deconvolution of Fv(II)(blue trace) from the difference between Fv(720ex) and the Fv(I) derived from Fv(I)/2 in panel a. Definition of the I2 level so that at the Fv(I) peak (200 ms, vertical red dotted line) I2 = P(720ex)−Fv(I)
Fig. 7
Fig. 7
Deconvolution of the Fv(I) and Fv(II) components of the overall Fv(720ex) kinetics in the presence of weak FR background light (PQ pool pre-oxidized). a Normalization of Fv(720ex) (red trace) and Fv(540ex) (green trace) at the I1 level, defined at 2 ms (end of the photochemical phase) by a saturating single turnover flash. Same sample as in measurements of Fig. 6, after 15-min adaptation to 1 µmol m−2 s−1 730 nm quanta. With all F(II) components being equal after O-I1 normalization, the difference curve (violet trace) corresponds to Fv(I)/2 contained in Fv(720ex) (see text). b Deconvolution of Fv(II)(blue trace) from the difference between Fv(720ex) and the Fv(I) derived in panel a. Definition of the I2 level so that at the Fv(I) peak (200 ms, vertical red dotted line) I2 = P(720ex)−Fv(I)
Fig. 8
Fig. 8
Polyphasic rise kinetics of Chlorella measured alternatingly with 540ex and 680ex (panel a) or 700ex (panel b) or 720ex (panel c). 5-min dark intervals between consecutive measurements. Due to a preceding 80-min continuous illumination at 715 µmol 540 nm quanta m−2 s1, which was followed by 15-min darkness, the PQ pool was pre-reduced and the sample in state 2. The 540ex curves are the averages of one curve measured before and one curve measured after each respective 680ex, 700ex, or 720ex curve. Subtraction of the respective 540ex curves (green) from the O-I1 normalized 680ex, 700ex, and 720ex curves (dark red) yielded the kinetics of “extra Fv(I)” (violet). Polyphasic rise kinetics measured with 600 ms Multiple Turnover pulses (MT) of 540 nm light at 8000 µmol m−2 s−1
Fig. 9
Fig. 9
Information on the “extra Fv(I)” in Chlorella derived from comparative measurements of polyphasic rise kinetics using 540ex and a variety of excitation wavelengths in the red-FR spectral range. a Kinetics of “extra Fv(I).” b Amplitude of the “extra Fv(I)” as a function of the excitation wavelength in the red-FR range. The “extra Fv(I)” is scaled as fraction of the O-I1 amplitude
Fig. 10
Fig. 10
Dark–light fluorescence induction kinetics upon onset of 540 nm actinic illumination at 3 different intensities measured with 720ex (red traces) and 540ex (green traces). Chlorella in the presence of weak FR background light (PQ pool pre-oxidized), as in the experiment of Fig. 7. Actinic intensities in µmol m−2 s−1 540 nm quanta: AL13, 445; AL19, 1665, and MT12, 6150. Averages of 10 recordings each measured alternatingly using 720ex and 540ex with 3-min dark intervals in between. AL19 and MT12 recordings with application of saturating single turnover flash at 2 ms. Normalization of 720ex and 540ex responses at the end of the initial photochemical phase: with AL19 and MT12 at I1, with AL13 at I level. a Logarithmic time scale. b Linear time scale. The Fv(I) responses for AL13 (black), AL19 (blue), and MT12 (violet) are displayed at the bottom, as calculated from [ Fv(720ex)−Fv(540ex)]*2
Fig. 11
Fig. 11
Effects of 0.1 µM DCMU (panel a) and 1 µM DCMU (panel b) on the polyphasic rise kinetics measured with 720ex and 540ex. Application of weak 730 nm background light (1 µmol m−2 s−1) to keep PQ pool oxidized. Actinic illumination with 600 ms Multiple Turnover pulse (MT) of 540 nm light at 5200 µmol m−2 s−1. Using one and the same sample first the control curves were measured, then the 0.1 µM DCMU curves after 60-min incubation and finally the 1 µM DCMU curves after 60-min incubation. Two curves each with 720ex were averaged which were measured 5 min before and 5 min after recording of the 540ex curve. Control, 0.1 µM, and 1 µM DCMU curves were separately O-I1 equalized
Fig. 12
Fig. 12
Kinetics of “extra Fv(I)” derived from the O-I1 equalized polyphasic rise kinetics measured with 720ex and 540ex in Fig. 11 by subtracting the 540ex curves from the 720ex curves
Fig. 13
Fig. 13
Typical examples of comparative 720ex and 540ex measurements of Fv from a variety of photosynthetic organisms. All recordings were O-I1 normalized, so that the difference between the 720ex (dark red) and 540ex (green) responses reflects the “extra Fv(I)” contained in Fv(720ex) compared to Fv(540ex)(violet). Light-green young samples were selected for the measurements in b-f. See text for details on optical geometry

References

    1. Bell AJ, Frankel LK, Bricker TM. High yield non-detergent isolation of photosystem I-light-harvesting chlorophyll II membranes from spinach thylakoids: implications for the organization of the PS I antennae in higher plants. J Biol Chem. 2015;290:18429–18437. doi: 10.1074/jbc.M115.663872. - DOI - PMC - PubMed
    1. Bos I, Bland KM, Tian L, Croce R, Frankel LK, van Amerongen H, Bricker TM, Wientjes E. Multiple LHCII antennae can transfer energy efficiently to a single photosystem I. Biochim Biophys Acta. 2017;1858:371–378. doi: 10.1016/j.bbabio.2017.02.012. - DOI - PubMed
    1. Butler WL. Energy distribution in the photochemical apparatus of photosynthesis. Ann Rev Plant Physiol. 1978;29:345–378. doi: 10.1146/annurev.pp.29.060178.002021. - DOI
    1. Butler WL, Kitajima M. Energy transfer between photosystem I and photosystem II in chloroplasts. Biochim Biophys Acta. 1975;396:72–85. doi: 10.1016/0005-2728(75)90190-5. - DOI - PubMed
    1. Chukhutsina VU, Holzwarth A, Croce R. Time-resolved fluorescence measurements on leaves: principles and recent developments. Photosynth Res. 2019;140:355–369. doi: 10.1007/s11120-018-0607-8. - DOI - PMC - PubMed

Substances

LinkOut - more resources