. 2023 Jan 31;137(2):163-180.
doi: 10.1042/CS20220525.

Cigarette smoke induces mitochondrial DNA damage and activates cGAS-STING pathway: application to a biomarker for atherosclerosis

Affiliations

Cigarette smoke induces mitochondrial DNA damage and activates cGAS-STING pathway: application to a biomarker for atherosclerosis

Keitaro Ueda et al. Clin Sci (Lond). .

Erratum in

Abstract

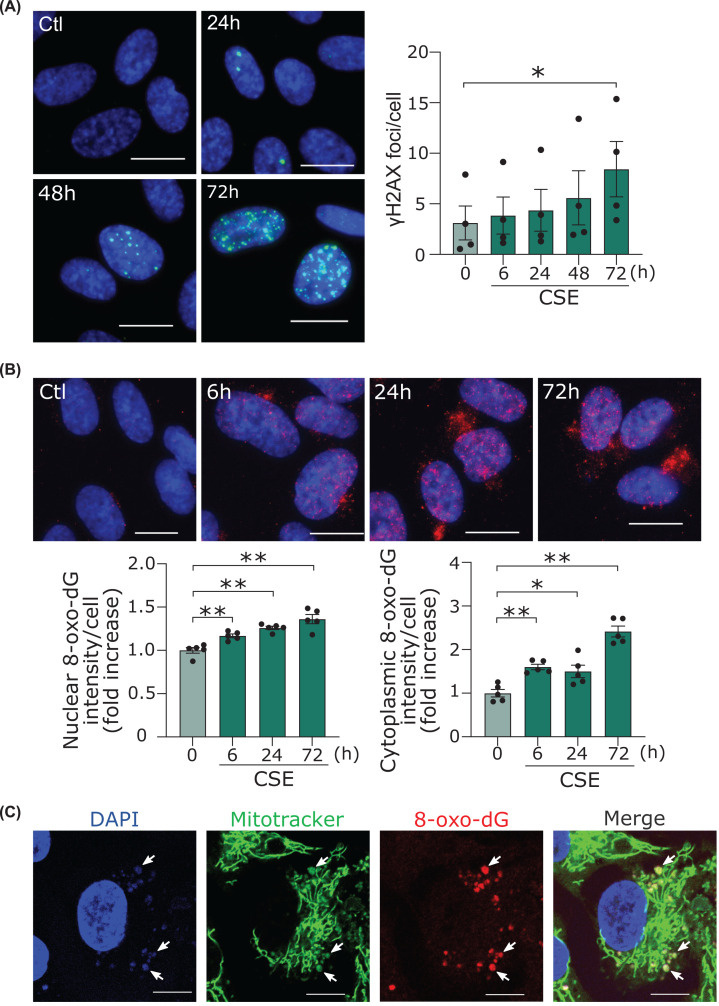
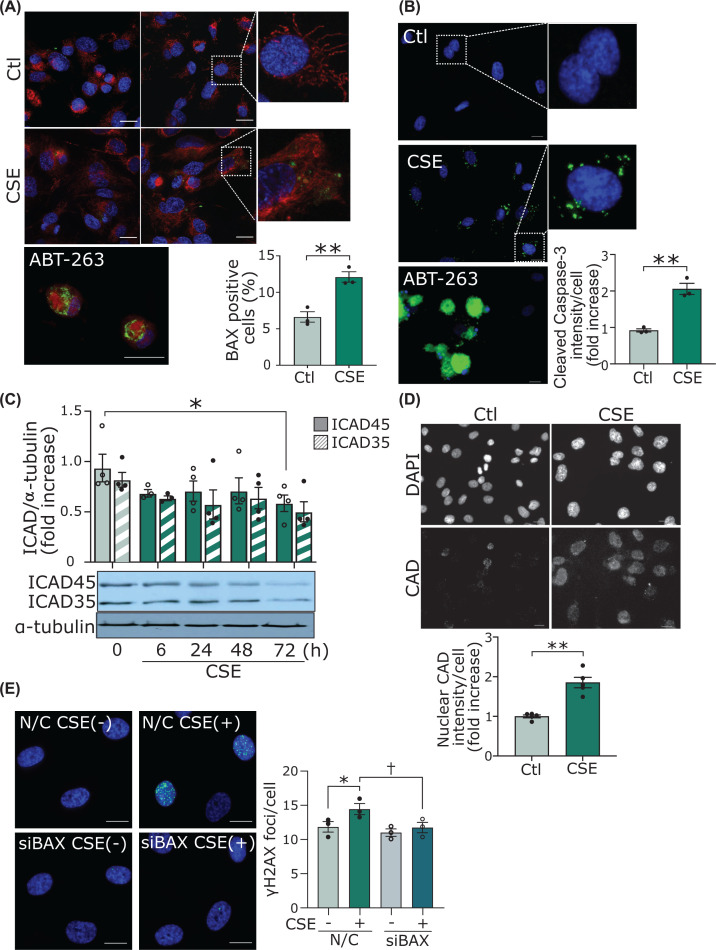
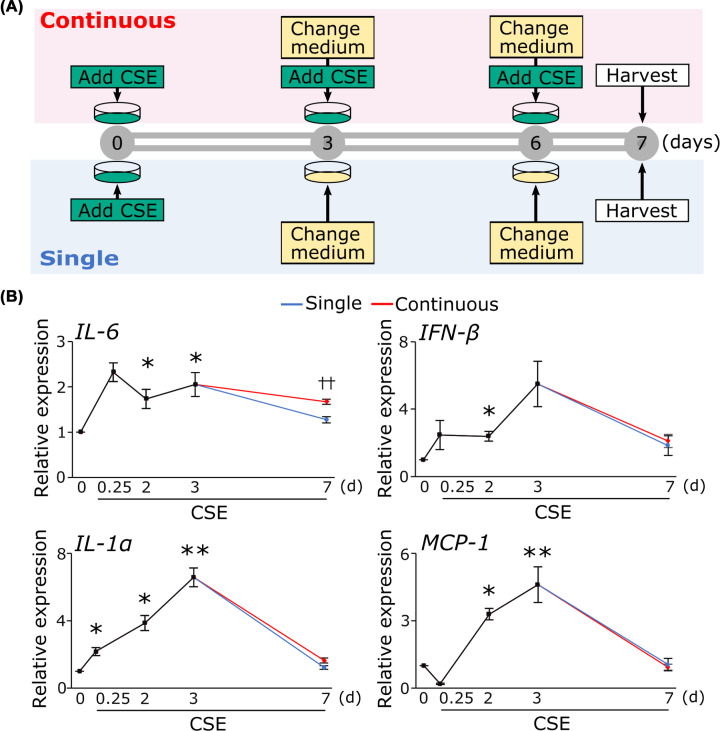
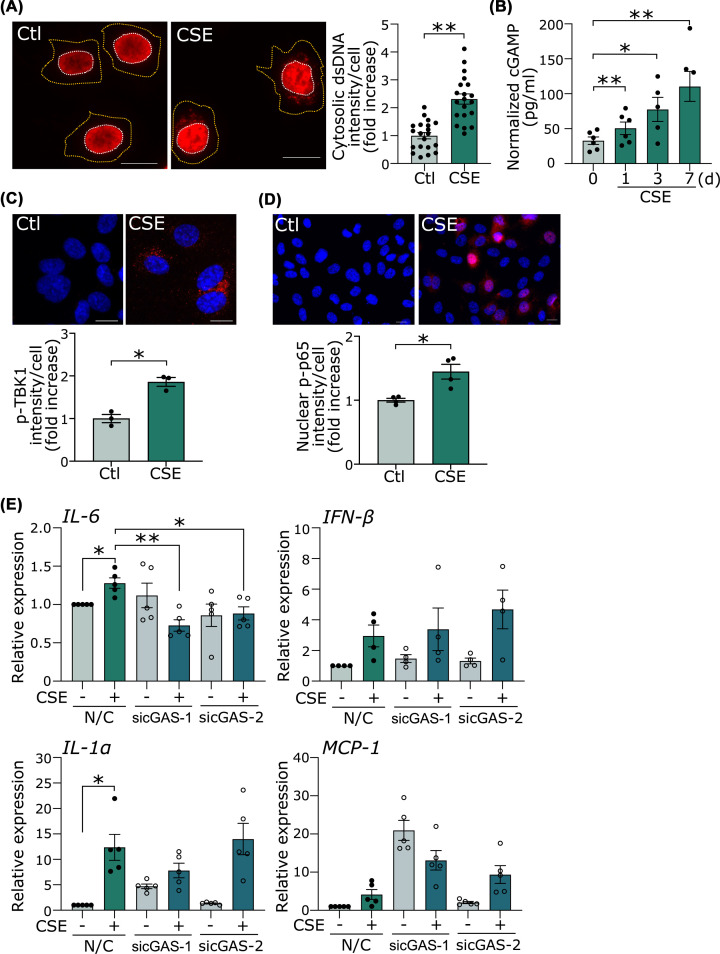
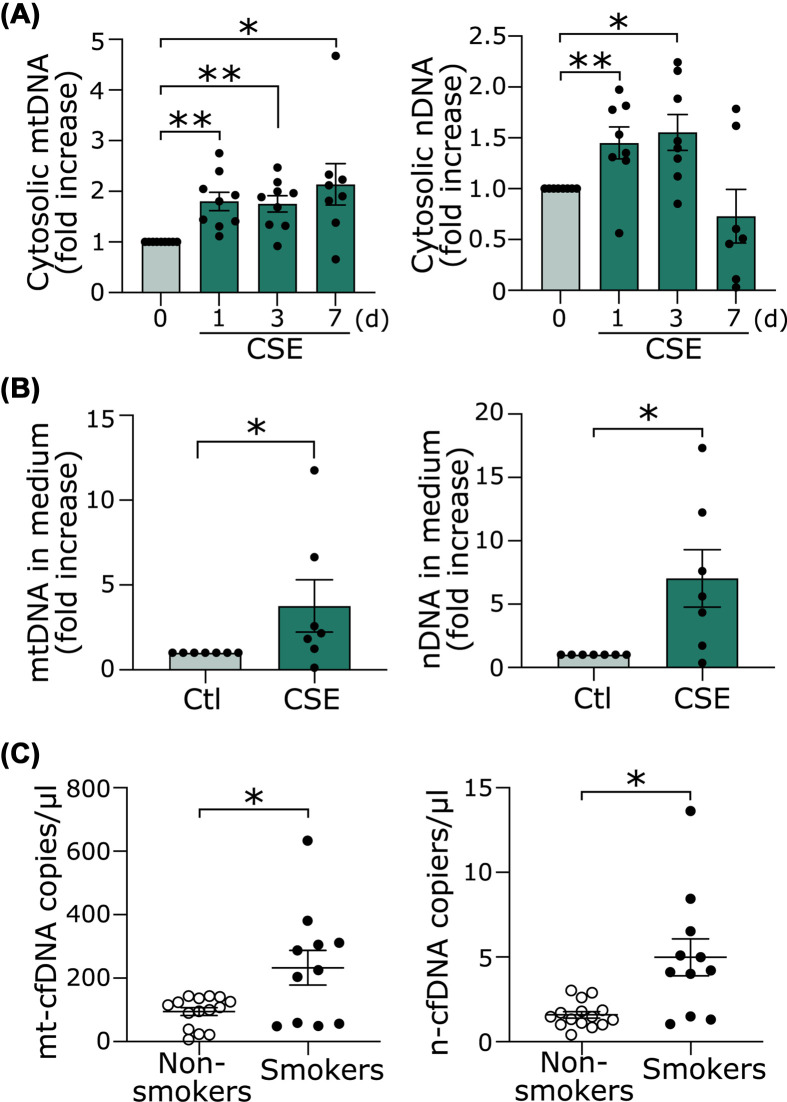
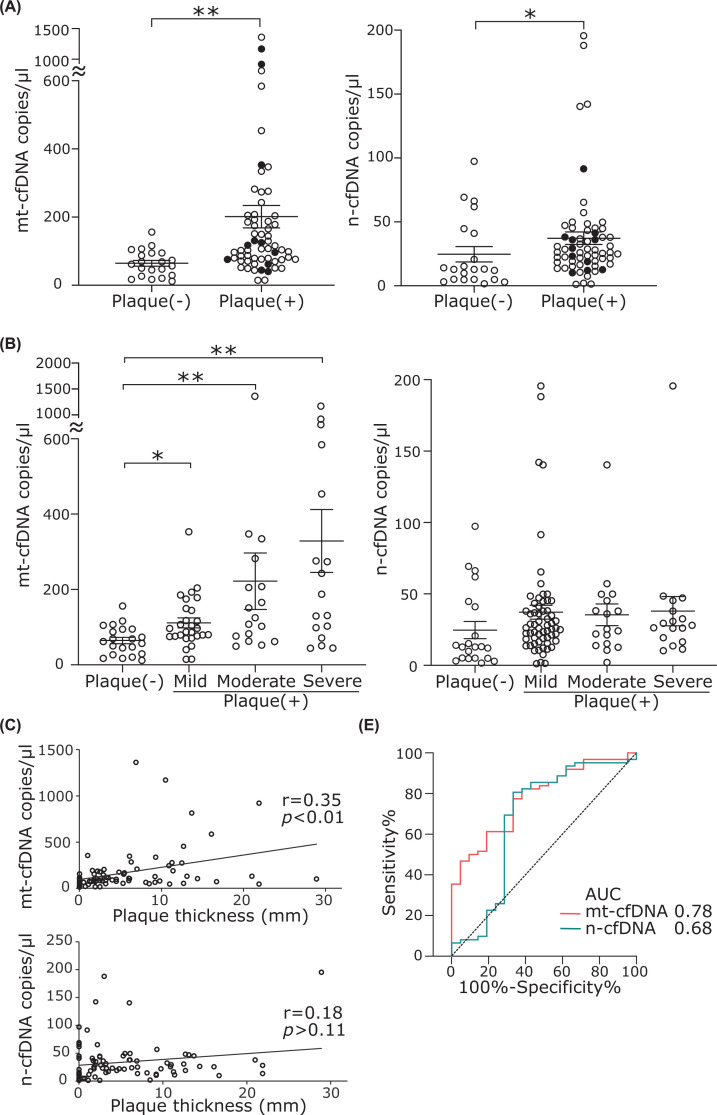
Cigarette smoking is a major risk factor for atherosclerosis. We previously reported that DNA damage was accumulated in atherosclerotic plaque, and was increased in human mononuclear cells by smoking. As vascular endothelial cells are known to modulate inflammation, we investigated the mechanism by which smoking activates innate immunity in endothelial cells focusing on DNA damage. Furthermore, we sought to characterize the plasma level of cell-free DNA (cfDNA), a result of mitochondrial and/or genomic DNA damage, as a biomarker for atherosclerosis. Cigarette smoke extract (CSE) increased DNA damage in the nucleus and mitochondria in human endothelial cells. Mitochondrial damage induced minority mitochondrial outer membrane permeabilization, which was insufficient for cell death but instead led to nuclear DNA damage. DNA fragments, derived from the nucleus and mitochondria, were accumulated in the cytosol, and caused a persistent increase in IL-6 mRNA expression via the cyclic GMP-AMP synthase (cGAS)-stimulator of interferon genes (STING) pathway. cfDNA, quantified with quantitative PCR in culture medium was increased by CSE. Consistent with in vitro results, plasma mitochondrial cfDNA (mt-cfDNA) and nuclear cfDNA (n-cfDNA) were increased in young healthy smokers compared with age-matched nonsmokers. Additionally, both mt-cfDNA and n-cfDNA were significantly increased in patients with atherosclerosis compared with the normal controls. Our multivariate analysis revealed that only mt-cfDNA predicted the risk of atherosclerosis. In conclusion, accumulated cytosolic DNA caused by cigarette smoke and the resultant activation of the cGAS-STING pathway may be a mechanism of atherosclerosis development. The plasma level of mt-cfDNA, possibly as a result of DNA damage, may be a useful biomarker for atherosclerosis.

Keywords: DNA damage; biomarker; cGAS-STING; cell-free DNA; mitochondria.


Conflict of interest statement

All authors have reported that they have no relationships relevant to the contents of this paper to disclose.

Figures

Figure 1
Figure 1. CSE increased nuclear and mitochondrial DNA damage in human endothelial cells
(A) Immunofluorescent staining of the γH2AX (green) in HUVECs. Scale bar = 20 μm. Time course of γH2AX formation by CSE. *P<0.05 compared with corresponding control (n=4). (B) Immunofluorescent staining of the 8-OHdG (red) in HUVECs. Scale bar = 20 μm. Time course of the 8-OHdG formation in nuclei and cytoplasm. *P<0.05, **P<0.01 compared with control (n=5). (C) Images taken by confocal microscopy of immunofluorescent staining of the 8-OHdG (red) and MitoTracker™ RED CMXROS (green) and DAPI (blue) in HUVECs. Scale bar = 20 μm. Because permeabilization was not performed, the 8-OHdG in the nucleus was not stained. Arrows show colocalization of the 8-OHdG in mitochondria. Abbreviations: γH2AX, phosphorylated histone H2AX; 8-OHdG, 8-hydroxy-2′-deoxyguanosine; CSE, cigarette smoke extract.
Figure 2
Figure 2. CSE causes minority MOMP and activation of sublethal apoptotic pathways
(A) Immunofluorescent staining of BAX 6A7 in HUVECs. Scale bar = 20 μm. Cells were treated with CSE for 72 h. As a positive control, cells were treated with ABT-263 for 6 h, which is an inhibitor of Bcl-2. The samples were assessed with an LSM780 confocal laser-scanning microscope (Carl Zeiss, Germany). The percentage of cells with BAX foci were counted. **P<0.01 (n=3). (B) Immunofluorescent staining of cleaved caspase-3 in HUVECs. Scale bar = 20 μm. Cells were treated with CSE for 72 h. As a positive control, we administered ABT-263 for 6 h. **P<0.01 (n=3). (C) Time course of cytosolic ICAD45 and ICAD35 levels by Western blot analysis. The bands from Western blot were quantified and standardized to α-tubulin levels. *P<0.05 compared with control of ICAD45 (n=4). (D) Immunofluorescent staining of CAD in HUVECs. Scale bar = 20 μm. Cells were treated with CSE for 72 h. Quantification of the intensity of CAD in the nucleus. Nuclear regions were analyzed and calculations were based on five different areas of the slide (n=5 areas). **P<0.01. (E) Immunofluorescent staining of the γH2AX in HUVECs. HUVECs transfected with siRNA against BAX (siBAX), or negative control siRNA (siNC) were treated with CSE for 72 h. *P<0.05 compared with siNC and †P<0.05 compared with siNC treated with CSE (n=3). Abbreviations: CAD, caspase-activated DNase; ICAD, inhibitor of caspase-activated DNase; siRNA, small-interfering RNA; other abbreviations as in Figure 1.
Figure 3
Figure 3. Increase in the mRNA level of inflammatory cytokine expression by CSE
(A) Time schedule for CSE treatment. (B) Cells treated with CSE as described in the text. Quantification of mRNA expression of inflammatory cytokines including IL-6, IL-1α, MCP-1, and IFN-β was performed real-time PCR. *P<0.05, **P<0.01 compared with control (n=4). ††P<0.01 single vs continuous (n=4 or 5). Abbreviations: IFN-β, interferon β; IL-1α, interleukin-1 α; IL-6, interleukin-6; MCP-1, monocyte chemoattractant protein-1; other abbreviations as in Figure 1.
Figure 4
Figure 4. CSE causes the accumulation of cytosolic DNA and activation of cytosolic DNA sensor
(A) Immunofluorescent staining of dsDNA in HUVECs. Scale bar = 20 μm. Cells were treated with CSE for 24 h. The cell outline (orange dotted line) was determined by observation in bright field. Quantification of the cytosolic dsDNA intensity per cell. **P<0.01 compared with control (n=20 cells per group) (B) The production of cGAMP was measured by ELISA. The cGAMP levels were normalized by total protein concentration. *P<0.05, **P<0.01 compared with control (n=5 or 6). (C) Immunofluorescent staining of p-TBK1 in HUVECs. Scale bar = 20 μm. Cells were treated with CSE for 72 h. Quantification of the intensity of pTBK1 in the cytosol. Cytosolic regions were analyzed and calculations were based three different areas of the slide (n=3 areas). *P<0.05. (D) Immunofluorescent staining of p-p65 in HUVECs. Scale bar = 20 μm. Quantification of the intensity of p-p65 in the nucleus. Nuclear regions were analyzed and calculations were based four different areas of the slide (n=4 areas). *P<0.05. (E) HUVECs transfected with siRNA against cGAS (sicGAS-1 or sicGAS-2), or siNC were treated with CSE for 7 days. *P<0.05, **P<0.01, (n=4 or 5). Abbreviations: dsDNA, double-strand DNA; TBK1, TANK-binding kinase 1; other abbreviations as in Figures 1 and 2.
Figure 5
Figure 5. CSE causes accumulation of both nDNA and mtDNA in the cytosol and extracellular space
(A) Cytosolic nDNA and mtDNA were quantitated via qPCR using nDNA primers (β-globin) or mtDNA primers (NADH1). *P<0.05, **P<0.01 compared with control (n=7 or 9). (B) Cells were treated with CSE for 48 h. n-cfDNA and mt-cfDNA in the medium were quantitated. *P<0.05 (n=6). (C) n-cfDNA and mt-cfDNA in the plasma of smokers (n=11) and nonsmokers (n=15) were quantitated. *P<0.05.
Figure 6
Figure 6. The cf-DNA of atherosclerosis patients
(A) The cfDNA copy number in normal subject (Plaque [-]) and subjects with carotid plaques. *P<0.05, **P<0.01 compared with Plaque (-). Closed circles represent current smokers. (B) Comparison of mt-cfDNA and n-cfDNA among four groups. *P<0.05, **P<0.01 compared with Plaque (-). (C) Correlation of cfDNA copy number with plaque thickness. (D) ROC analysis for atherosclerosis incidence (plaque [-] vs. plaque[+]), using mt-cfDNA and n-cfDNA. Abbreviations: AUC, area under the curve; mt-cfDNA, mitochondrial cell-free DNA; n-cfDNA, nuclear cell-free DNA.

References

    1. Kondo T., Nakano Y., Adachi S. and Murohara T. (2019) Effects of tobacco smoking on cardiovascular disease. Circ. J. 83, 1980–1985 10.1253/circj.CJ-19-0323 - DOI - PubMed
    1. Ding S.L. and Shen C.Y. (2008) Model of human aging: recent findings on Werner's and Hutchinson-Gilford progeria syndromes. Clin. Interv. Aging 3, 431–444 10.2147/CIA.S1957 - DOI - PMC - PubMed
    1. Darby S.C., Ewertz M., McGale P., Bennet A.M., Blom-Goldman U., Brønnum D.et al. . (2013) Risk of ischemic heart disease in women after radiotherapy for breast cancer. N. Engl. J. Med. 368, 987–998 10.1056/NEJMoa1209825 - DOI - PubMed
    1. Ishida M., Ishida T., Tashiro S., Uchida H., Sakai C., Hironobe N.et al. . (2014) Smoking cessation reverses DNA double-strand breaks in human mononuclear cells. PloS ONE 9, e103993 10.1371/journal.pone.0103993 - DOI - PMC - PubMed
    1. Li T. and Chen Z.J. (2018) The cGAS-cGAMP-STING pathway connects DNA damage to inflammation, senescence, and cancer. J. Exp. Med. 215, 1287–1299 10.1084/jem.20180139 - DOI - PMC - PubMed

Publication types