. 2023 Jan 4;9(1):eadd2793.
doi: 10.1126/sciadv.add2793. Epub 2023 Jan 4.

A universal sequencing read interpreter

Affiliations

A universal sequencing read interpreter

Yusuke Kijima et al. Sci Adv. .

Abstract

Massively parallel DNA sequencing has led to the rapid growth of highly multiplexed experiments in biology. These experiments produce unique sequencing results that require specific analysis pipelines to decode highly structured reads. However, no versatile framework that interprets sequencing reads to extract their encoded information for downstream biological analysis has been developed. Here, we report INTERSTELLAR (interpretation, scalable transformation, and emulation of large-scale sequencing reads) that decodes data values encoded in theoretically any type of sequencing read and translates them into sequencing reads of another structure of choice. We demonstrated that INTERSTELLAR successfully extracted information from a range of short- and long-read sequencing reads and translated those of single-cell (sc)RNA-seq, scATAC-seq, and spatial transcriptomics to be analyzed by different software tools that have been developed for conceptually the same types of experiments. INTERSTELLAR will greatly facilitate the development of sequencing-based experiments and sharing of data analysis pipelines.


Figures

Fig. 1.
Fig. 1.. Overview of INTERSTELLAR.
Conceptual diagram representing how INTERSTELLAR (interpretation, scalable transformation, and emulation of large-scale sequencing reads) interprets and translates sequencing reads with its file management and distributed computing strategies.
Fig. 2.
Fig. 2.. Interpretation of highly structured RCP-PCR reads.
(A) The conceptual diagram of row-column-plate polymerase chain reaction (RCP-PCR). (B) Two-step PCR amplification and paired-end sequencing of DB and AD barcode cassette libraries. (C) Rank-read count plots of row-specific barcodes (RBCs), column-specific barcodes (CBCs), and plate-specific barcodes (PBCs).
Fig. 3.
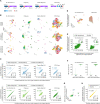
Fig. 3.. Translation of scATAC-seq reads.
(A) Read structures of sci-ATAC-seq and 10x scATAC-seq. ID, identifier. (B) Two-dimensional uniform manifold approximation and projection (UMAP) embeddings of sci-ATAC-seq data processed by its original pipeline for Drosophila embryo 6 to 8 hours after egg laying and that obtained by Cell Ranger ATAC with the read translation using INTERSTELLAR. Cell state annotations obtained by the original pipeline were applied to both embeddings. (C) Correlation in distance of two cells between the high-dimensional genomic accessibility count space of the original sci-ATAC-seq data and that by Cell Ranger ATAC. For each dataset, Euclidean distances in a high-dimensional latent semantic indexing (LSI) space were measured for the same 50,000 randomly sampled cell pairs. The inset sina plot represents rank difference distribution in the Euclidean distance of the same cell pairs before and after translation. The crossbar represents the median. ***P < 2.2 × 10⁻¹⁶ by the two-sided Wilcoxon rank sum test. R, correlation coefficient.
Fig. 4.
Fig. 4.. Cross-evaluation of different scRNA-seq reads and software tools.
(A) Read structures of different single-cell RNA sequencing (scRNA-seq) methods. bp, base pair. (B) Two-dimensional UMAP embeddings of scRNA-seq datasets processed by their original pipelines and those analyzed using 10x Cell Ranger and dropseq-tools by read translation using INTERSTELLAR with the unique molecular ID (UMI) reassignment strategy. Cell state annotations obtained by the original pipelines were applied to the translated results. (C) Correlation in distance of two cells between the high-dimensional transcriptome spaces of the original datasets and those translated for Cell Ranger and dropseq-tools with the UMI reassignment and UMI bequeathing strategies. For each dataset, Euclidean distances in the gene expression count matrix were measured for 50,000 randomly sampled cell pairs. The bottom-right inset sina plot of each panel represents rank difference distribution in the Euclidean distance of the same cell pairs before and after translation. The crossbar represents the median. (D) Two-dimensional UMAP embeddings of 10x Chromium and SPLiT-seq datasets processed by their original pipelines and those analyzed by dropseq-tools using INTERSTELLAR without value space optimizations. (E) Correlation in distance of two cells between the high-dimensional transcriptome spaces of the original datasets and those translated for dropseq-tools without value space optimizations. (F) UMI loss rate per cell with and without value space optimizations. (G) Two-dimensional UMAP embedding of the Drop-seq dataset self-translated for dropseq-tools with no cell ID error correction. (H) Correlation in distance of two cells between the high-dimensional transcriptome spaces of the original and self-translated Drop-seq datasets. ***P < 2.2 × 10⁻¹⁶ by the two-sided Wilcoxon rank sum test.
Fig. 5.
Fig. 5.. Translation of spatial transcriptomics reads.
(A) Read structures of Slide-seq and 10x Visium. (B) Strategy to associate Slide-seq positional barcodes to those of multiple 10x Visium slides. Multiple Visium slides are first tiled across an enlarged Slide-seq field with a given scaling factor. Slide-seq positional barcodes are then associated to the closest Visium positional barcodes. (C) Relative frequency distributions in number of Slide-seq positional barcodes assigned per Visium positional barcode with scaling factors of ×1, ×5, and ×10. Error bar indicates mean ± SEs. (D) Original Slide-seq datasets and those analyzed by 10x Space Ranger with ×10 scaling. Each grid represents a tiled Visium slide. The spatial data points are color coded according to their gene expression profile clusters identified independently in the analysis of each sample. (E) Correlation in Euclidean distance of two positional transcriptome profiles (UMI count matrices) between the original Slide-seq datasets and those translated and analyzed using Space Ranger with the read translation. Randomly sampled 50,000 positional barcode pairs with unique correspondences between the original and translated datasets were analyzed for each tissue sample. The inset sina plot represents rank difference distribution in the Euclidean distance of the same cell pairs before and after translation. The crossbar represents the median. ***P < 2.2 × 10⁻¹⁶ by the two-sided Wilcoxon rank sum test.
Fig. 6.
Fig. 6.. Translation of multimodal scRNA-seq reads.
(A) Read structures of sci-Space. (B) Two-dimensional UMAP embeddings of cells and the spatial distributions of cell states for the original sci-Space data (top) and the translated data analyzed by 10x Cell Ranger (bottom). The cell state clusters are color coded according to their gene expression profile clusters identified independently in each analysis.
Fig. 7.
Fig. 7.. Interpretation of long-read sequencing reads.
(A) Read segmentation strategy by AssemblyByPacBio (ABP). (B) Read segmentation by INTERSTELLAR. In the ABP workflow, the sequencing reads are first aligned to the reference sequence. The MSH2 variants and barcodes are then extracted on the basis of their positions aligned to the reference. When INTERSTELLAR was used, we extracted coding variant and barcode segments by simply identifying their 20-bp upstream and downstream sequences with fuzzy matching (3-bp perfect match for the inner edge and up to two mismatches for the remaining 17-bp region). (C) Read count distribution of barcodes identified by INTERSTELLAR (top) and ABP (bottom). (D) Left: Venn diagrams for barcode species detected by the two workflows. Top diagram: With no read count threshold for identified barcode species. Bottom diagram: With a read count threshold of two or more. Middle: Proportion of barcodes whose MSH2 variants detected by each corresponding tool were involved in the allowlist. Right: Length distribution of coding variant segments identified by each corresponding tool.

Similar articles

Cited by

References

    1. E. A. Winzeler, D. D. Shoemaker, A. Astromoff, H. Liang, K. Anderson, B. Andre, R. Bangham, R. Benito, J. D. Boeke, H. Bussey, A. M. Chu, C. Connelly, K. Davis, F. Dietrich, S. W. Dow, M. El Bakkoury, F. Foury, S. H. Friend, E. Gentalen, G. Giaever, J. H. Hegemann, T. Jones, M. Laub, H. Liao, N. Liebundguth, D. J. Lockhart, A. Lucau-Danila, M. Lussier, N. M’Rabet, P. Menard, M. Mittmann, C. Pai, C. Rebischung, J. L. Revuelta, L. Riles, C. J. Roberts, P. Ross-MacDonald, B. Scherens, M. Snyder, S. Sookhai-Mahadeo, R. K. Storms, S. Véronneau, M. Voet, G. Volckaert, T. R. Ward, R. Wysocki, G. S. Yen, K. Yu, K. Zimmermann, P. Philippsen, M. Johnston, R. W. Davis, Functional characterization of the S. cerevisiae genome by gene deletion and parallel analysis. Science 285, 901–906 (1999). - PubMed
    1. A. M. Smith, L. E. Heisler, J. Mellor, F. Kaper, M. J. Thompson, M. Chee, F. P. Roth, G. Giaever, C. Nislow, Quantitative phenotyping via deep barcode sequencing. Genome Res. 19, 1836–1842 (2009). - PMC - PubMed
    1. M. E. Hillenmeyer, E. Fung, J. Wildenhain, S. E. Pierce, S. Hoon, W. Lee, M. Proctor, R. P. S. Onge, M. Tyers, D. Koller, R. B. Altman, R. W. Davis, C. Nislow, G. Giaever, The chemical genomic portrait of yeast: Uncovering a phenotype for all genes. Science 320, 362–365 (2008). - PMC - PubMed
    1. T. Roemer, J. Davies, G. Giaever, C. Nislow, Bugs, drugs and chemical genomics. Nat. Chem. Biol. 8, 46–56 (2011). - PubMed
    1. K. Berns, E. M. Hijmans, J. Mullenders, T. R. Brummelkamp, A. Velds, M. Heimerikx, R. M. Kerkhoven, M. Madiredjo, W. Nijkamp, B. Weigelt, R. Agami, W. Ge, G. Cavet, P. S. Linsley, R. L. Beijersbergen, R. Bernards, A large-scale RNAi screen in human cells identifies new components of the p53 pathway. Nature 428, 431–437 (2004). - PubMed