Clinical Trial
. 2023 Jan 4;9(1):eade8272.
doi: 10.1126/sciadv.ade8272. Epub 2023 Jan 4.

Spleen tyrosine kinase inhibition restores myeloid homeostasis in COVID-19

Affiliations
Clinical Trial

Spleen tyrosine kinase inhibition restores myeloid homeostasis in COVID-19

Gustaf Wigerblad et al. Sci Adv. .

Abstract

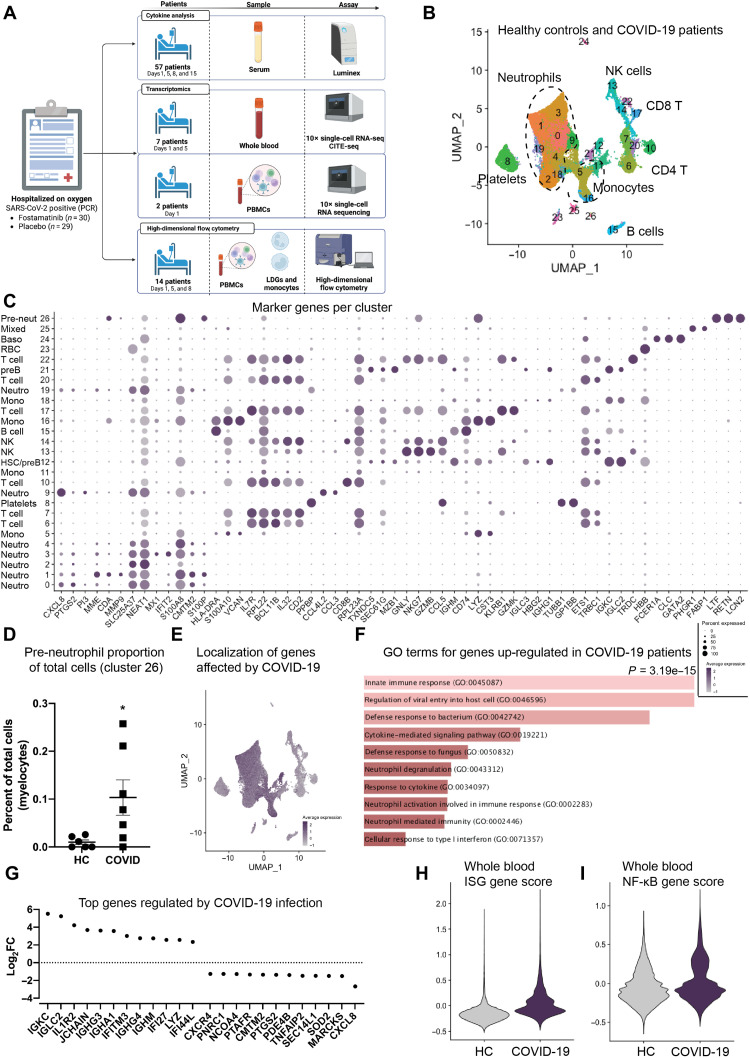
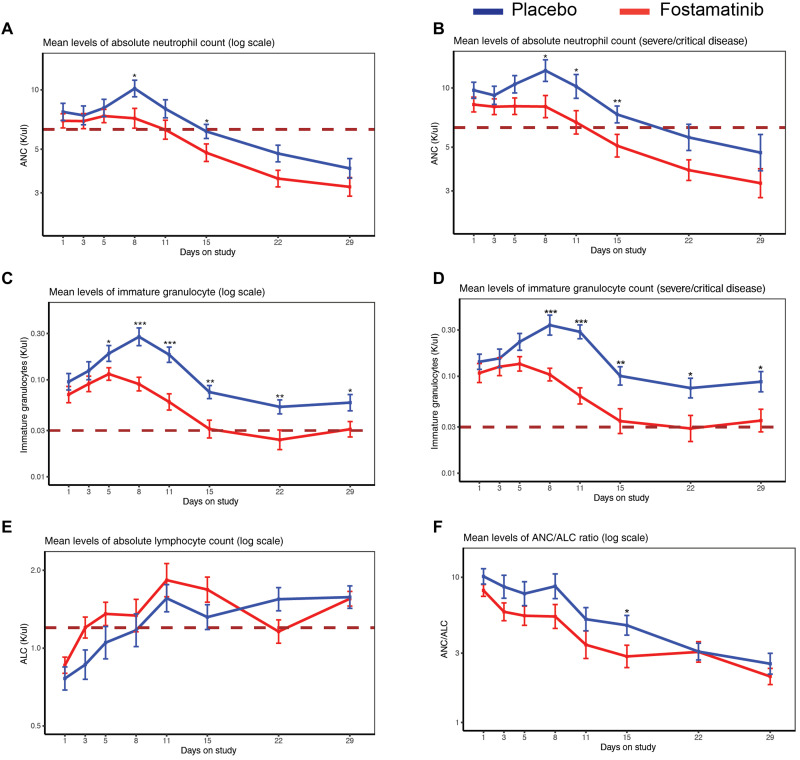
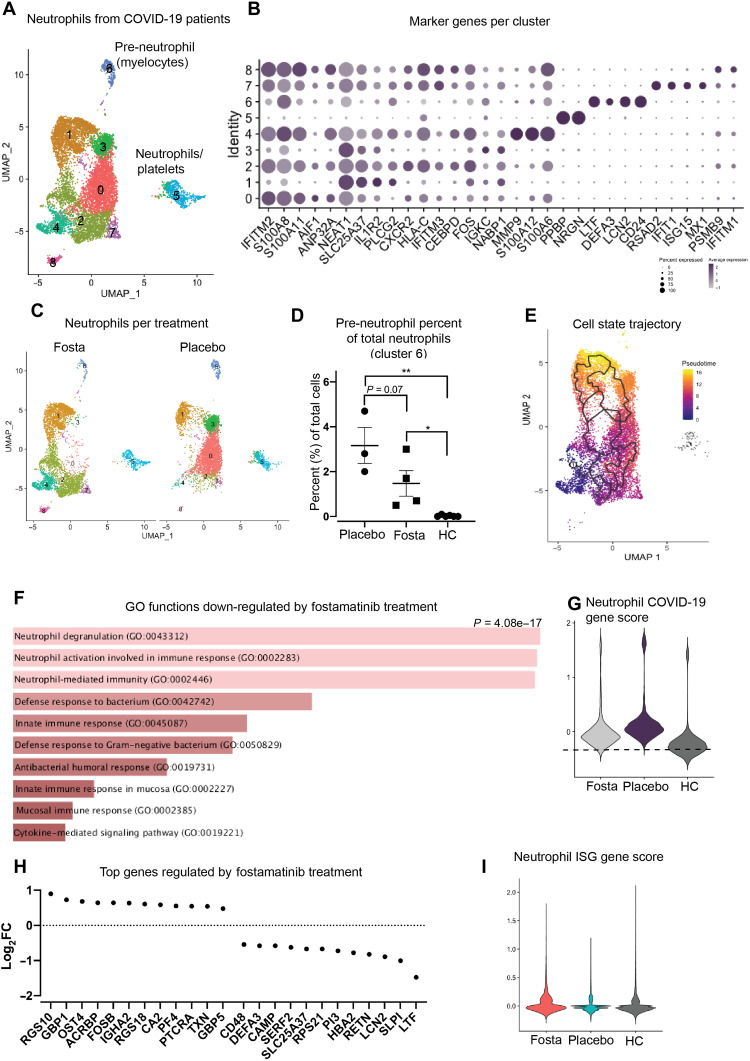
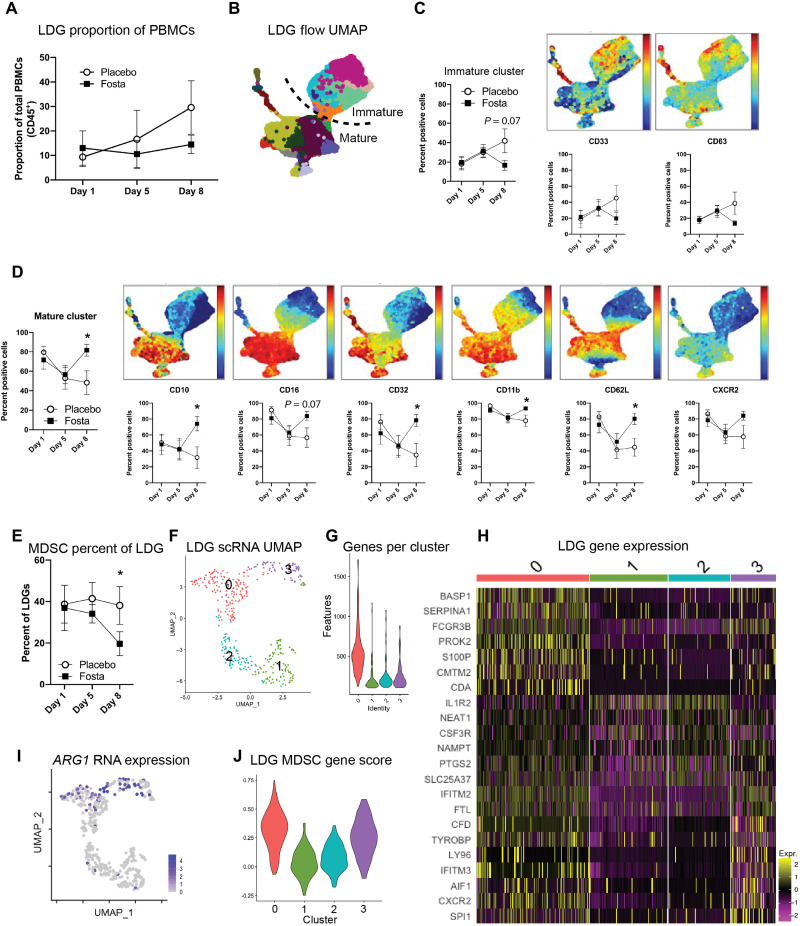
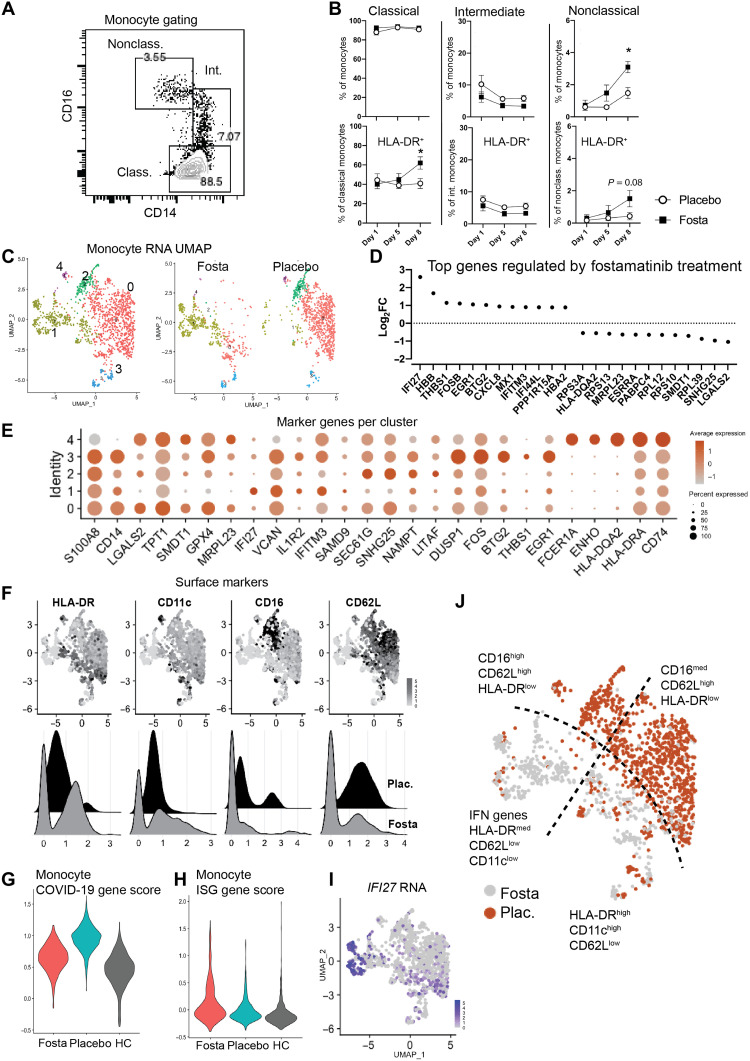
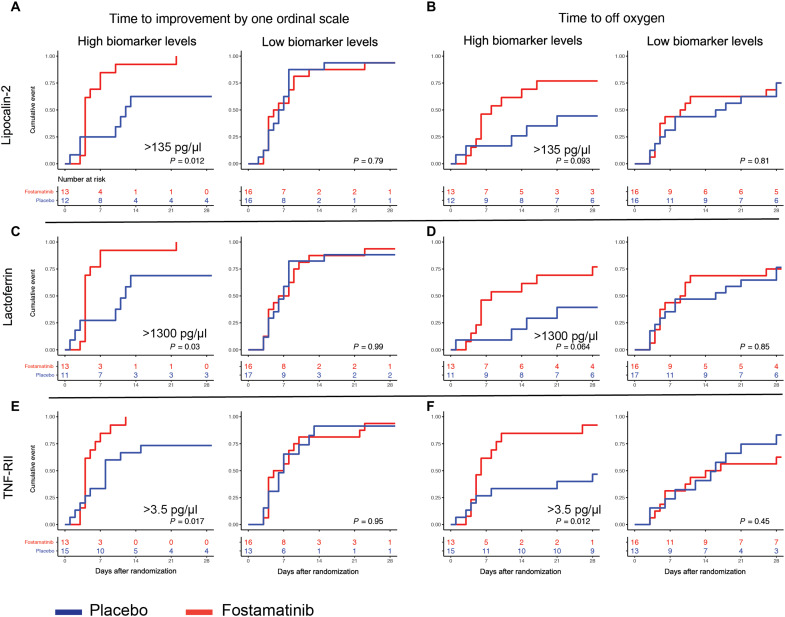
Spleen tyrosine kinase (SYK) is a previously unidentified therapeutic target that inhibits neutrophil and macrophage activation in coronavirus disease 2019 (COVID-19). Fostamatinib, a SYK inhibitor, was studied in a phase 2 placebo-controlled randomized clinical trial and was associated with improvements in many secondary end points related to efficacy. Here, we used a multiomic approach to evaluate cellular and soluble immune mediator responses of patients enrolled in this trial. We demonstrated that SYK inhibition was associated with reduced neutrophil activation, increased circulation of mature neutrophils (CD10+CD33-), and decreased circulation of low-density granulocytes and polymorphonuclear myeloid-derived suppressor cells (HLA-DR-CD33+CD11b-). SYK inhibition was also associated with normalization of transcriptional activity in circulating monocytes relative to healthy controls, an increase in frequency of circulating nonclassical and HLA-DRhi classical monocyte populations, and restoration of interferon responses. Together, these data suggest that SYK inhibition may mitigate proinflammatory myeloid cellular and soluble mediator responses thought to contribute to immunopathogenesis of severe COVID-19.


Figures

Fig. 1.
Fig. 1.. Study design and whole blood scRNA-seq at inclusion of the study.
(A) Experimental design and setup. Soluble biomarkers were analyzed in 57 patients on days 1, 5, 8, and 15 using the Luminex platform. Whole blood was red blood cell (RBC)–depleted, and cells were captured for scRNA-seq and CITE-seq on days 1 and 5 using the 10x Genomics platform. In two patients, PBMCs were also analyzed using scRNA-seq. PBMCs were additionally analyzed using high-dimensional flow cytometry on days 1, 5, and 8. (B) UMAP of RBC-depleted whole blood cells from COVID-19 patients (37,300 cells, seven patients) and healthy controls (40,200 cells, six donors), with major cell types annotated. (C) Dot plot showing the top three differentially expressed genes per cluster showing percent expressed and average expression. Population 21 noted to classify as pre-B cells with a mix of hematopoietic stem cells (HSC). (D) Percent of precursor neutrophils (myelocytes, cluster 26) of total cells for healthy controls (HC) and COVID-19 patients. (E) Localization on the UMAP of the top up-regulated genes between healthy control and COVID-19 patients. (F) Gene ontology (GO) terms for the genes used in (E). (G) Top regulated genes (log2FC; up or down) between healthy control and COVID-19 patients. (H) ISG score for all cells comparing healthy control and COVID-19 patients. (I) NF-κB gene score comparing healthy controls to COVID-19.
Fig. 2.
Fig. 2.. Comparisons of neutrophil and lymphocyte counts by complete blood count.
(A) ANC (K/μl) per treatment arm for all patients (n = 59) or (B) for severe disease (n = 36). (C) Immature granulocyte count (K/μl) per treatment arm for all patients (n = 59) or (D) for severe disease (n = 36). (E) ALC (K/μl) per treatment arm for all patients (n = 59). (F) Ratio of ANC and ALC (ANC/ALC; n = 59). Dashed lines on all figures represent normal value [(A and B) ANC (6.3 K/μl), (C and D) immature granulocyte count (0.3 K/μl), and (E) ALC (1.2 K/μl)]. *P < 0.05, **P < 0.01, and ***P < 0.001.
Fig. 3.
Fig. 3.. Effect of fostamatinib treatment on neutrophils in COVID-19.
(A) UMAP of neutrophils on day 5 of treatment with placebo or fostamatinib (corresponds to clusters 0 to 4, 9, 19, and 26 in Fig. 1B). (B) Dot plot showing top differentially expressed genes per cluster showing percent expressed and average expression. (C) Split UMAP of neutrophils by treatment arm [fostamatinib (Fosta) or placebo]. (D) Percent of precursor neutrophils (myelocytes) of total neutrophils comparing treatment arms to healthy controls (HC). (E) Trajectory analysis showing cell-state transitions over the neutrophil UMAP, colored with inferred pseudotime. The starting point for the pseudotime is the MMP9high and S100A12high immature neutrophil cluster 4. (F) GO terms for the genes that are down-regulated by fostamatinib treatment in the total neutrophils, compared to placebo. (G) Neutrophil COVID-19 gene score; gene score based on the top up-regulated genes in neutrophils from COVID-19 neutrophils compared to healthy control neutrophils, applied to each treatment arm and healthy control cells. (H) Top regulated genes (log2FC, up or down) among neutrophils by treatment arm. (I) ISG score for neutrophils comparing the treatment arm with healthy control cells. *P < 0.05 and **P < 0.01.
Fig. 4.
Fig. 4.. High-dimensional flow and scRNA analysis of COVID-19 LDGs.
(A) Proportion of LDGs among total CD45+ PBMCs by treatment arm (fostamatinib or placebo) from baseline to day 8. (B) UMAP and FlowSOM clustering based on a 24-marker panel (dashed line represents separation of mature and immature populations). (C) Markers defining the immature population with percent positive cell per immature cluster and each individual surface marker. (D) Markers defining the mature population with percent positive cell per mature cluster and each individual surface marker. (E) PMN-MDSC (HLA-DRCD11b+CD33+) percent of total LDG, per treatment arm. (F) UMAP of LDGs from COVID-19 patients at baseline (n = 2). (G) Genes expressed per cluster in four LDG clusters. (H) Heatmap showing gene expression of top differentially expressed genes in each LDG cluster. (I) Arginase-1 gene expression across the LDG UMAP. (J) MDSC gene score per cluster. MDSChi indicates cells that express high levels of genes characteristic of MDSCs. *P < 0.05.
Fig. 5.
Fig. 5.. Effect of fostamatinib treatment on COVID-19 monocytes.
(A) Gating strategy to define classical monocytes (CD14hi CD16lo), intermediate monocytes (CD14hi CD16int), and nonclassical monocytes (CD14int CD16hi). (B) Proportion of each monocyte subset of total monocytes (top) by arm (fostamatinib or placebo). Proportion of HLA-DR+ cells in each monocyte subset (bottom). (C) UMAP of all monocytes (corresponds to clusters 5, 11, 16, and 18 in Fig. 1B) by treatment arm showing transcriptional clusters (left) and per treatment arm (right). (D) Top regulated genes (log2FC; up or down) between the monocytes per treatment arm. (E) Dot plot showing top differentially expressed genes per cluster showing percent expressed and average expression. (F) CITE-seq of defining surface markers shown on the transcriptional UMAP (top) and comparing per treatment arm (bottom). (G) COVID-19 monocyte gene score based on the top up-regulated genes in monocytes from COVID-19 patients compared to healthy controls, applied to each treatment arm and healthy control (HC) cells. (H) Gene scores for ISG in the monocytes, comparing the treatment arms with healthy control cells. (I) Expression of an ISG gene (IFI27) across the UMAP. (J) Highlighting surface markers and gene expression that defines the monocytes across the UMAP, including separation by treatment arm. *P < 0.05.
Fig. 6.
Fig. 6.. Predictive model for fostamatinib indication.
Kaplan-Meier curves demonstrating biomarker cutoffs where higher levels associate with more rapid improvements and lower levels demonstrate no difference in time to improvement by one ordinal scale and time to off oxygen. (A) Higher levels of LCN2 (>135 pg/μl) associated with more rapid time to improvement by one ordinal scale. (B) Higher level of LCN2 (>135 pg/μl) associated with more rapid time to being off supplemental oxygen. (C) Higher levels of LTF (>1300 pg/μl) associated with more rapid time to improvement by one ordinal scale. (D) Higher level of LTF (>1300 pg/μl) associated with more rapid time to being off supplemental oxygen. (E) Higher levels of TNF-RII (>3.5 pg/μl) associated with more rapid time to improvement by one ordinal scale. (F) Higher level of TNF-RII associated (>3.5 pg/μl) with more rapid time to being off supplemental oxygen.

Similar articles

Cited by

References

    1. A. Bonaventura, A. Vecchié, L. Dagna, K. Martinod, D. L. Dixon, B. W. van Tassell, F. Dentali, F. Montecucco, S. Massberg, M. Levi, A. Abbate, Endothelial dysfunction and immunothrombosis as key pathogenic mechanisms in COVID-19. Nat. Rev. Immunol. 21, 319–329 (2021). - PMC - PubMed
    1. C. Huang, Y. Wang, X. Li, L. Ren, J. Zhao, Y. Hu, L. Zhang, G. Fan, J. Xu, X. Gu, Z. Cheng, T. Yu, J. Xia, Y. Wei, W. Wu, X. Xie, W. Yin, H. Li, M. Liu, Y. Xiao, H. Gao, L. Guo, J. Xie, G. Wang, R. Jiang, Z. Gao, Q. Jin, J. Wang, B. Cao, Clinical features of patients infected with 2019 novel coronavirus in Wuhan, China. Lancet 395, 497–506 (2020). - PMC - PubMed
    1. C. Qin, L. Zhou, Z. Hu, S. Zhang, S. Yang, Y. Tao, C. Xie, K. Ma, K. Shang, W. Wang, D.-S. Tian, Dysregulation of immune response in patients with coronavirus 2019 (COVID-19) in Wuhan, China. Clin. Infect. Dis. 71, 762–768 (2020). - PMC - PubMed
    1. N. Reusch, E. de Domenico, L. Bonaguro, J. Schulte-Schrepping, K. Baßler, J. L. Schultze, A. C. Aschenbrenner, Neutrophils in COVID-19. Front. Immunol. 12, 652470 (2021). - PMC - PubMed
    1. L. Prozan, E. Shusterman, J. Ablin, A. Mitelpunkt, A. Weiss-Meilik, A. Adler, G. Choshen, O. Kehat, Prognostic value of neutrophil-to-lymphocyte ratio in COVID-19 compared with influenza and respiratory syncytial virus infection. Sci. Rep. 11, 21519 (2021). - PMC - PubMed

Publication types