. 2023 Jan 4;9(1):eade1067.
doi: 10.1126/sciadv.ade1067. Epub 2023 Jan 4.

A nanofiber-hydrogel composite improves tissue repair in a rat model of Crohn's disease perianal fistulas

Affiliations

A nanofiber-hydrogel composite improves tissue repair in a rat model of Crohn's disease perianal fistulas

Ling Li et al. Sci Adv. .

Abstract

Perianal fistulas (PAFs) represent a severe complication of Crohn's disease (CD). Despite the advent of biologic and small-molecule therapeutics for luminal disease, PAFs in CD (CD-PAF) are relatively resistant to treatment, with less than 50% responding to any therapy. We report an injectable, biodegradable, mechanically fragmented nanofiber-hydrogel composite (mfNHC) loaded with adipose-derived stem cells (ADSCs) for the treatment of fistulas in a rat model of CD-PAF. The ADSC-loaded mfNHC results in a higher degree of healing when compared to surgical treatment of fistulas, which is a standard treatment. The volume of fistulas treated with mfNHC is decreased sixfold compared to the surgical treatment control. Molecular studies reveal that utilization of mfNHC reduced local inflammation and improved tissue regeneration. This study demonstrates that ADSC-loaded mfNHC is a promising therapy for CD-PAF, and warrants further studies to advance mfNHC toward clinical translation.


Figures

Fig. 1.
Fig. 1.. Synthesis and characterization of ADSC-mfNHC.
(A) Schematic of NHC synthesis and ADSC-mfNHC delivery in a rat model of CD-PAF. (B) SEM images of lyophilized NHC at stiffness levels of 100, 250, and 400 Pa, showing microarchitecture of PCL nanofiber-HA hydrogel network with various pore sizes. Note the larger pores in softer mfNHC. (C) Measured storage moduli of NHC prepared at different HA concentrations. (D) Quantification of the pore size of NHCs with different storage moduli. (E) MRI images of mfNHC with different storage moduli loaded with ADSCs over 28 days. mfNHC implants are marked with the red dashed line. (F) Quantification of relative ADSC-mfNHC implant volume changes. (G) In vivo images of DiR-labeled ADSCs demonstrate retention of ADSCs in the mfNHC implants over a period of 14 days. (H) Quantification of relative ADSC retention in mfNHC implants with different moduli (n = 4, **P < 0.01, ***P < 0.001).
Fig. 2.
Fig. 2.. Host cell infiltration, macrophage polarization, and angiogenesis in ADSC-mfNHC implants in a rat subcutaneous injection model.
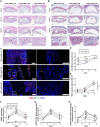
(A) Hematoxylin and eosin (H&E) staining of ADSC-mfNHC of three storage moduli at days 3, 14, and 28. The images show host cell infiltration and microvascular formation in the implants (top scale bar, 1 mm; bottom scale bar, 50 μm). (B) Masson’s trichrome staining of ADSC-mfNHC with three storage moduli at days 3, 14, and 28. The images show rare collagen deposition in the implants (top scale bar, 1 mm; bottom scale bar, 50 μm). (C) IF staining highlights microvascular structures in mfNHC implants. White dashed line demarcates the mfNHC implant. Red, αSMA; green, RECA-1; blue, DAPI (left scale bar, 200 μm; right scale bar, 100 μm). (D) Quantification of relative percent of host cell infiltration in the implants of different storage moduli for a period of 28 days (n = 3 implants, *P < 0.05, **P < 0.01; ns, no significance). (E) Quantification of relative percent of microvascular structures in the implants per square millimeter at different storage moduli for a period of 28 days (n = 4 implants, ***P < 0.001). (F to H) Flow cytometry demonstrates that macrophage infiltration increases from days 3 to 14 and then decreases to day 28. Notably, while the M2 subtype (proregenerative) displays a similar pattern of increase from days 3 to 14 and a decrease to day 28, the M1 subtype (proinflammatory) is constant from days 3 and 14 to 28 (n = 4 implants, *P < 0.05).
Fig. 3.
Fig. 3.. Establishment and characterization of CD-PAF in a rat model.
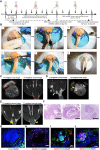
(A) Modeling and treatment timeline of CD-PAF in a rat model. (B) Steps in rat surgery to induce fistulas and then treat them with mfNHC. (C) MRI images at day 28 demonstrating patent fistula tracts (axial T1 images were obtained with setons in place, and coronal T1 images were obtained after setons were cut). (D) MRI images showing inflammation around fistula tracts (left, coronal T1, yellow arrow) and occasional abscess formation at day 28 (right, axial T2, yellow arrow). (E) Follow-up MRI at day 42 showing patent fistulas (yellow arrow) 14 days after removing setons at day 28. Note that there was no healing and spontaneous closing. (F) H&E staining of the fistula tract with a partially re-epithelialized lumen surrounded by dense acute and chronic inflammation and peri-fistula abscess formation (left scale bar, 2.5 mm; middle scale bar, 1 mm; right scale bar, 250 μm). (G) IF staining demonstrating PANCK+ epithelial cells lining fistula lumens. Green, PANCK; blue, DAPI (scale bar, 200 μm). (H to J) IF staining demonstrating the spatial arrangement of the inflammatory milieu around the fistula tracts. MPO+, neutrophils; CD68+CD163+, macrophages; CD20+, B cells; CD45RO+, memory T lymphocytes (scale bar, 500 μm).
Fig. 4.
Fig. 4.. Effectiveness of ADSC-mfNHC-250 in treating CD-PAF in a rat model.
(A) MRI images demonstrating that ADSC-mfNHC-250 promotes the best healing of fistulas (green dashed line) compared with mfNHC-250 (yellow dashed line) and surgery at day 48 (red dashed line). (B) Measurements of the fistula tracts and quantification of reconstructed fistula 3D volumes from each treatment group (n = 6, *P < 0.05, **P < 0.01, ***P < 0.001). (C) H&E staining of fistulas after treatment. Note that ADSC-mfNHC-250 treatment resulted in a marked reduction in acute and chronic inflammation as compared to mfNHC-250 treatment or surgical treatment (scale bar, 200 μm). (D) IF staining showing microvasculature in fistulas with three different treatments. Red, α-SMA; blue, DAPI (top scale bar, 500 μm; bottom scale bar, 100 μm).
Fig. 5.
Fig. 5.. RT-PCR array with RNA from treated fistulas.
(A) Heatmap of a panel of genes relevant to CD. (B) RT-PCR of select genes from the RT-PCR panel confirmed that ADSC-mfNHC-250 inhibited critical proinflammatory cytokine transcripts that participate in the inflammatory cascade, such as TNF-α (TNF-a), IL-6 (IL-6), IL-1α (IL-1a), IFN-γ (IFNg), IL-1β (IL-1b), IL23α (IL23a), Ccr1 (Ccr1), Ccr5 (Ccr5), and Ccl1 (n ≥ 3, *P < 0.05).
Fig. 6.
Fig. 6.. IF staining of fistulas.
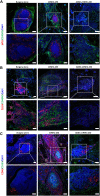
(A) Staining of MPO+ neutrophils and CD45RO+ T cells. (B) Staining of CD20+ B cells and CD45RO+ memory T cells. (C) Staining of CD68+ macrophages and CD163+ M2-like macrophages (top scale bar, 200 μm; bottom scale bar, 100 μm).
Fig. 7.
Fig. 7.. Flow cytometry analysis of immune cell distribution and cytokine profile analysis of CD-PAF treated with ADSC-mfNHC-250.
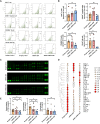
(A) Flow cytometry contour plot of a general panel of T cell, B cell, NK cell, and myeloid profiles with CD3, CD45RA, CD11b, and CD161. (B) Flow cytometry analysis indicated that ADSC-mfNHC-250 inhibited local CD11b+ and CD45RA+ immune cell expression, but there is no difference in CD3+ T and CD161+ myeloid cell profiles (n ≥ 3, *P < 0.05). (C) Cytokine profile array plot images for fistula with different treatments. (D) Heatmap of cytokine profile array quantification showed that ADSC-mfNHC-250 inhibited several proinflammation cytokines such as IL-6, TNF-α, IL-17, CCl3, and IL-1ra compared with mfNHC-250 treatment as control surgery alone treatment. In the meantime, ADSC-mfNHC-250 increased anti-inflammation cytokines IL-10 and IL-4 compared with the remaining two treatment groups. (E) ELISA confirmed that ADSC-mfNHC-250 inhibited two vital proinflammation cytokines TNF-α and IL-6 in CD in larger-scale samples. However, there is no significant difference of the anti-inflammation cytokine IL-10 in all treatment groups (n > 4, *P < 0.05).

References

    1. GBD 2017 Inflammatory Bowel Disease Collaborators ,The global, regional, and national burden of inflammatory bowel disease in 195 countries and territories, 1990–2017: A systematic analysis for the Global Burden of Disease Study 2017. Lancet Gastroenterol. Hepatol. 5,17–30 (2020). - PMC - PubMed
    1. G. G. Kaplan, J. W. Windsor,The four epidemiological stages in the global evolution of inflammatory bowel disease. Nat. Rev. Gastroenterol. Hepatol. 18,56–66 (2021). - PMC - PubMed
    1. M. L. Ganz, R. Sugarman, R. Wang, B. B. Hansen, J. Håkan-Bloch,The economic and health-related impact of Crohn’s disease in the United States: Evidence from a nationally representative survey. Inflamm. Bowel Dis. 22,1032–1041 (2016). - PubMed
    1. S. J. Bell, A. B. Williams, P. Wiesel, K. Wilkinson, R. C. Cohen, M. A. Kamm,The clinical course of fistulating Crohn’s disease. Aliment. Pharmacol. Ther. 17,1145–1151 (2003). - PubMed
    1. T. W. Eglinton, M. L. Barclay, R. B. Gearry, F. A. Frizelle,The spectrum of perianal Crohn’s disease in a population-based cohort. Dis. Colon Rectum 55,773–777 (2012). - PubMed