. 2023 Jan 4;9(1):eabn9793.
doi: 10.1126/sciadv.abn9793. Epub 2023 Jan 4.

In vitro cellular reprogramming to model gonad development and its disorders

Affiliations

In vitro cellular reprogramming to model gonad development and its disorders

Nitzan Gonen et al. Sci Adv. .

Abstract

During embryonic development, mutually antagonistic signaling cascades determine gonadal fate toward a testicular or ovarian identity. Errors in this process result in disorders of sex development (DSDs), characterized by discordance between chromosomal, gonadal, and anatomical sex. The absence of an appropriate, accessible in vitro system is a major obstacle in understanding mechanisms of sex-determination/DSDs. Here, we describe protocols for differentiation of mouse and human pluripotent cells toward gonadal progenitors. Transcriptomic analysis reveals that the in vitro-derived murine gonadal cells are equivalent to embryonic day 11.5 in vivo progenitors. Using similar conditions, Sertoli-like cells derived from 46,XY human induced pluripotent stem cells (hiPSCs) exhibit sustained expression of testis-specific genes, secrete anti-Müllerian hormone, migrate, and form tubular structures. Cells derived from 46,XY DSD female hiPSCs, carrying an NR5A1 variant, show aberrant gene expression and absence of tubule formation. CRISPR-Cas9-mediated variant correction rescued the phenotype. This is a robust tool to understand mechanisms of sex determination and model DSDs.


Figures

Fig. 1.
Fig. 1.. Differentiation of mouse ESCs toward gonadal cells.
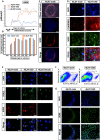
(A) Schematic representation of the differentiation protocol. T-CFP ESC (T-CFP;R26-rtTA, XY mESCs) were differentiated to EpiSCs followed by mesoderm induction, IM differentiation, and gonadal progenitor specification. Forced expression of Sf1 and Dmrt1 induced Sertoli-like cells expressing CFP, which create tubule-like structures. Growth factors added at each step are highlighted in blue above the arrows. Key markers of each stage are labeled in light gray. The time scale of the differentiation is presented at the top (day 0 to day 13). Representative bright-field (BF) and fluorescent images are depicted below the schematic representation. Scale bars, 100 μm. d0, day 0. (B) qPCR analysis of cells undergoing differentiation. Gene names are presented in the title. ESC, embryonic stem cells; EpiSC, epiblast stem cells; M, mesoderm; IM, intermediate mesoderm. Data are presented as mean 2−ΔΔCt values normalized to the housekeeping gene Pbgd. Error bars show SEM of 2−ΔΔCt values. Statistical analysis was performed using one-way analysis of variance (ANOVA) on the 2−ΔΔCt values (*P < 0.05, **P < 0.01, ***P < 0.001, and ****P < 0.0001). ns, not significant. (C) Immunostaining of cells undergoing differentiation (ESC, EpiSC, M, and IM3). Staining was done using the BRACHURY (red), WT1 (red), GATA4 (magenta), and SOX9 (red) antibodies. The stained protein is depicted at the top bar. Left of each bar is the protein staining alone, and right is merge with 4′,6-diamidino-2-phenylindole (DAPI). Scale bars, 100 μm.
Fig. 2.
Fig. 2.. Comparing the transcriptome of in vitro–derived gonadal cells with bulk RNA-seq of in vivo gonadal cells.
(A) PCA of selected samples based on normalized mRNA expression level after batch correction. The top 2 PCs are shown. E10.5 to E13.5 are gonadal cells isolated from entire embryonic male (triangle) or female (square) gonads (16). Three biological replicates were analyzed for each sample type. (B) Heatmap of the genes most DE between the E10.5 and E13.5 XY male gonads following batch correction (16). IM3/IM4 cluster closely to the E11.5 in vivo gonadal cells. Gene-level expression across samples is shown as a z score running from red (high) to blue (low). Three biological replicates were analyzed for each sample type.
Fig. 3.
Fig. 3.. Comparing the transcriptome of in vitro–derived gonadal cells with scRNA-seq of in vivo gonadal cells.
(A and B) Spearman correlation of the XY NR5A1+ gonadal scRNA-seq data transformed as pseudobulk per cell population (15) with the XY whole-gonad bulk RNA-seq (16) using the protein-coding genes (A) or a set of marker genes (B) (the most overexpressed genes from each of the six cell populations from the scRNA-seq data). The blue box points toward the high correlation of the early progenitor cells with E10.5/E11.5 bulk RNA-seq data, while the purple box indicates high correlation between interstitial progenitors and E11.5 to E13.5 bulk RNA-seq data. The green boxes show the correlation of the pre-Sertoli and Sertoli cells with E11.5 to E13.5 bulk RNA-seq data. FLC, Fetal Leydig cells. (C and D) Spearman correlation of the XY NR5A1+ gonadal scRNA-seq data transformed as pseudobulk per cell population (15) with the bulk RNA-seq data of the reprogramming mESCs using the protein-coding genes (C) or a set of marker genes (D). The green boxes point the correlation of iSLC with the early and/or interstitial progenitor cells, the blue boxes show the correlation of the IM3 and IM4 cells with the early progenitors.
Fig. 4.
Fig. 4.. Differentiation of human iPSCs derived from healthy 46,XY male, 46,XX female, and a patient with 46,XY DSD with a pathogenic variant in NR5A1.
(A) Differentiation time points are indicated together with BF images of the cells at each stage of the differentiation process. iPSC derived from the 46,XY healthy male are the only cells to self-aggregate and form tubule-like structures. D, days; scale bars, 200 μm. EGF, epidermal growth factor; ITS, Insulin-Transferrin-Selenium. (B) Representative RT-qPCR expression profiles of selected differentiation markers of the three iPSC-derived cell lines during the differentiation process.
Fig. 5.
Fig. 5.. Characterization of iSLCs from 46,XY male and patient with 46,XY DSD.
(A) The Sertoli cell product, AMH, is secreted into the medium at comparable levels by the iPSC-derived from 46,XY male and 46,XY DSD cells during differentiation and at lower levels by 46,XX cells. (B) Continuous and prolonged expression of SOX9 in the differentiating 46,XY male and 46,XY DSD cells. (C) Top: Phase contrast of iPSC-derived from 46,XY cells after 12 days of sequential culture in conditioned media shows spontaneous formation of tubular structures. Middle and bottom: The tubule-like structures are composed of SOX9-positive cells; scale bars, 100 μm. (D) Expression of SOX9 and CLAUDIN-11 in iPSC-derived cells from 46,XY healthy male and patient with 46,XY DSD after 12 days of sequential culture in defined media. Both cell lines express SOX9 and CLAUDIN-11, but the spatial organization of CLAUDIN-11 is disrupted in iPSC-derived cells from the patient with 46,XY DSD; scale bars, 20 μm. (E) Immunocytochemistry for SOX9 and FOXL2 in iPSC-derived cells from 46,XY healthy male, 46,XX female, and patient with 46,XY DSD after 12 (+5) days of sequential culture in defined media. The iPSC-derived 46,XY male cells express SOX9 but not FOXL2, whereas the iPSC-derived 46,XX cells express FOXL2 but not SOX9. In contrast, a proportion of the iPSC-derived 46,XY DSD cells express both SOX9 and FOXL2 within the same cell; scale bars, 20 μm. (F) Flow cytometric–sorted iPSC-derived CLAUDIN-11-positive cells from a 46,XY male and a patient with 46,XY DSD following 12 (+12) days of sequential culture in defined media. (G) After FACS, the iPSC-derived CLAUDIN-11-positive cells from a 46,XY male and a patient with 46,XY DSD are seeded onto Matrigel in a chamber slide. After 7 to 10 days, the 46,XY male cells spontaneously organize into circular tubular structures, whereas 46,XY DSD cells do not form these structures. Both cell lines express SOX9; scale bars, 50 μm.
Fig. 6.
Fig. 6.. 3D tubule formation in a microfluidic chip.
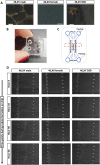
(A) After FACS, the iPSC-derived CLAUDIN-11-positive cells from 46,XY male, 46,XX female, and 46,XY DSD cells were expanded for 7 to 14 days in Sertoli cell medium. These cells were then seeded on a constrained space on hardened (50%) Matrigel domes. The iPSC-derived cells from the 46 XY male migrate and form tubular structures, whereas 46,XX female and 46,XY DSD cells do not form tubular structures; scale bars, 100 μm for the panels representing cells from 46,XY male and 46,XY DSD. Scale bars, 200 μm for the panels representing cells from 46,XX female. (B) PDMS microfluidic chip designed for 3D tubule formation (GONAChip) together with (C) a schematic representation of the chip. (D) Still images from time-lapse video of cell migration, aggregation, and tubule formation on GONAChip. The time-lapse videos (movies S1 to S3) show that the cells from all the three iPSC-derived cell lines can proliferate. The iPSC-derived 46,XX cells do not migrate, whereas 46,XY male and 46,XY DSD cells migrate and enter the central chamber lined with Matrigel (hours 0 to 30). The iPSC-derived 46,XY male cells organize and form distinct tubular structures, whereas the iPSC-derived 46,XY DSD cells do not form tubular structures (hours 30 to 72).
Fig. 7.
Fig. 7.. CRISPR-CAS9 correction of the NR5A1 pathogenic variant in iPSC-derived 46,XY DSD cells restores iSLC properties.
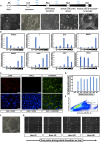
(A) Differentiation time points and BF images of the corrected 46,XY DSD cells during the differentiation process; scale bars, 200 μm. (B) RT-qPCR expression data of selected markers during the differentiation process. (C) Expression of SOX9, FOXL2, and CLAUDIN-11 in NR5A1-corrected 46,XY DSD iPSC–derived cells after 12 days of sequential culture in defined media. Cells express SOX9 and CLAUDIN-11, but the expression of FOXL2 is not detected; scale bars, 20 μm. Moreover, CLAUDIN-11 expression is spatially organized, similar to that seen in 46 XY, male cells (Fig. 5D). (D) Continuous and prolonged expression of SOX9 is observed in the differentiating cells NR5A1-corrected 46,XY DSD iPSC–derived cells. (E) Flow cytometric sorting of CLAUDIN-11-positive NR5A1-corrected 46,XY DSD iPSC–derived cells following 12 (+12) days of sequential culture in conditioned media. (F) After FACS, the CLAUDIN-11-positive NR5A1-corrected 46,XY DSD iPSC–derived cells were expanded for 7 to 14 days in Sertoli cell medium and then seeded on a constrained space on hardened (50%) Matrigel domes. The cells migrate and form tubular structures; scale bars, 100 μm. (G) Still images from a time-lapse video of cell migration, aggregation, and tubule formation on GONAChip (movie S4) show that the cells proliferate, migrate (hours 0 to 30), and self-organize to form distinct 3D tubular structures (hours 30 to 60).

References

    1. Vidal V., Schedl A., Requirement of WT1 for gonad and adrenal development: Insights from transgenic animals. Endocr. Res. 26, 1075–1082 (2000). - PubMed
    1. Kreidberg J. A., Sariola H., Loring J. M., Maeda M., Pelletier J., Housman D., Jaenisch R., WT-1 is required for early kidney development. Cell 74, 679–691 (1993). - PubMed
    1. Luo X., Ikeda Y., Lala D. S., Baity L. A., Meade J. C., Parker K. L., A cell-specific nuclear receptor plays essential roles in adrenal and gonadal development. Endocr. Res. 21, 517–524 (1995). - PubMed
    1. Luo X., Ikeda Y., Parker K. L., A cell-specific nuclear receptor is essential for adrenal and gonadal development and sexual differentiation. Cell 77, 481–490 (1994). - PubMed
    1. Hu Y. C., Okumura L. M., Page D. C., Gata4 is required for formation of the genital ridge in mice. PLOS Genet. 9, e1003629 (2013). - PMC - PubMed

Supplementary concepts