. 2023 Jan 4;9(1):eabo7555.
doi: 10.1126/sciadv.abo7555. Epub 2023 Jan 4.

Commensal microbiome promotes hair follicle regeneration by inducing keratinocyte HIF-1α signaling and glutamine metabolism

Affiliations

Commensal microbiome promotes hair follicle regeneration by inducing keratinocyte HIF-1α signaling and glutamine metabolism

Gaofeng Wang et al. Sci Adv. .

Abstract

Tissue injury induces metabolic changes in stem cells, which likely modulate regeneration. Using a model of organ regeneration called wound-induced hair follicle neogenesis (WIHN), we identified skin-resident bacteria as key modulators of keratinocyte metabolism, demonstrating a positive correlation between bacterial load, glutamine metabolism, and regeneration. Specifically, through comprehensive multiomic analysis and single-cell RNA sequencing in murine skin, we show that bacterially induced hypoxia drives increased glutamine metabolism in keratinocytes with attendant enhancement of skin and hair follicle regeneration. In human skin wounds, topical broad-spectrum antibiotics inhibit glutamine production and are partially responsible for reduced healing. These findings reveal a conserved and coherent physiologic context in which bacterially induced metabolic changes improve the tolerance of stem cells to damage and enhance regenerative capacity. This unexpected proregenerative modulation of metabolism by the skin microbiome in both mice and humans suggests important methods for enhancing regeneration after injury.


Figures

Fig. 1.
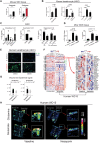
Fig. 1.. Bacteria induce wound bed glutamine metabolism.
(A) Energy metabolism score, calculated from microarray by principal components analysis (PCA) method, of GF (low WIHN) versus SPF (high WIHN) and PBS-treated (50 μl of WD3; low WIHN) versus S. aureus–treated mice (1 × 107 colony-forming units on WD3; high WIHN) using WD14 wound beds, the day of scab detachment (SD0). (B) Glutamine and glutamate gene signatures of microarrays from SD0 wound bed tissue of low WIHN strain (C57BL/6) versus high WIHN strain (B6/FVB/SJL) mice; GF versus SPF mice, and PBS-treated versus S. aureus–treated mice are shown. (C) mRNA expression of Gls and Gls2 in mice SD0 wound beds as detected by quantitative reverse transcription polymerase chain reaction (qRT-PCR). (D and E) GSEA of GF, SPF, PBS-treated, and S. aureus–treated mice glutamine and glutamate signatures based on SD0 microarrays. (F) On WD5 and SD0, glutamine and glutamate metabolite abundance in wound bed tissues as detected by mass spectrometry imaging (MSI; left) and quantification (right) of GF, SPF, PBS-treated, and S. aureus–treated mice. The magnified images indicate the wound bed, and the white dotted lines indicate the epidermal basement membrane. In quantification, each dot represents the expression of glutamine and glutamate as measured by mass spectrometry. Scatterplots and histogram graphs indicated means ± SEM; unpaired Student’s t test was used to compare statistical difference. n = 3 to 4 independent animals per group. SA, S. aureus.NES, normalized enrichment score.
Fig. 2.
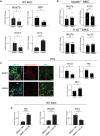
Fig. 2.. Bacteria-induced keratinocyte IL-1β production via glutamine metabolism.
(A) Detected by ELISA, glutamate expression of GF, SPF, PBS-treated, and S. aureus–treated mice at SD0. (B) Il-1β mRNA expression of mouse keratinocyte (MKC) treated with glutamine, CB839 (an inhibitor of glutamate production), or S. aureus as detected by qRT-PCR. DMSO, dimethyl sulfoxide. (C) As detected by ELISA, Il-1β expression of MKC treated with FX11, UK5099, CB839, glutamine, S. aureus, and S. aureus supernatant. (D) As detected by qRT-PCR and ELISA, Il-1β expression in mouse WD5 wound bed tissue treated with S. aureus and CB839. (E) IL-1β protein expression in human foreskin keratinocytes (HKC) treated with S. aureus and CB839 as detected by immunofluorescence (IF). DAPI, 4′,6-diamidino-2-phenylindole. (F) Metabolism gene signatures in microarrays of unwounded and WD15 human skin. (G and H) Glutamine and glutamate expression in Vaseline-treated and Neosporin-treated human WD15 wound bed tissues as detected by MSI (H) and quantification (G) as in Fig. 1, with same statistical and graphing methods. n = 3 to 6 independent animals or independent human samples per group.
Fig. 3.
Fig. 3.. Glutamine metabolism induces the expression of stem cell markers and regenerative signaling in vitro.
(A) The mRNA expression by qRT-PCR of regeneration markers Wnt7b, Shh, and stem cell marker Krt15 and differentiation marker Krt1 in CB839 treated mouse keratinocytes (MKC). (B) Wnt7b and Krt15 mRNA expression in CB839 treated Myd88−/− and IL-1β−/− MKC. (C) Immunofluorescence (left) and quantification (right) of CB839-treated human keratinocyte (HKC) stained for KRT15, active β-catenin (ABC), and KRT1 expression. (D) The mRNA expression of Shh, Wnt7b, and Krt1 of CB839 and mouse rmIL-1β–treated MKC. Statistics and graphing as in Fig. 1. n = 3 to 6 independent animals or independent human samples per group.
Fig. 4.
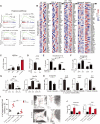
Fig. 4.. Glutamate is required for baseline and bacteria-induced WIHN.
(A) WIHN of glutamine and CB839 treated (WD3) mice, compared to PBS controls, as detected by confocal scanning laser microscopy (CLSM) (top right), hematoxylin and eosin (H&E) staining (bottom right), and quantification (left). The red dashed squares indicate the regenerative hair follicles. (B) Glutamate production in SD0 mouse wound beds as measured by ELISA. (C) WIHN of S. aureus– and FX11-treated (WD3) mice, as detected by CSLM (right) and quantification (left). (D) WIHN of UK5099-treated (WD3) mice, as detected by CSLM (right) and quantification (left). (E) WIHN of S. aureus– and CB839-treated mice, as detected by CSLM (right) and quantification (left). (F) Glutamate and Il-1β production in S. aureus– and CB839-treated mice SD0 wound beds as measured by ELISA. (G) WIHN of glutamine-treated or untreated WT, Il-1β−/−, K14-Myd88−/−, and LysM-Myd88−/− mice (right) with quantification (left). Statistics and graphing as in Fig. 1. n = 3 to 7 independent animals per group.
Fig. 5.
Fig. 5.. Bacteria-stimulated glutamine metabolism and IL-1β production through hypoxia-induced HIF signaling.
(A and B) GSEA of DEGs (A) and relative mRNA (B) of hypoxia genes detected by microarray in SD0 wound bed of GF, SPF, PBS-treated, S. aureus–treated, low WIHN strain (C57BL/6), and high WIHN strain (B6/FVB/SJL) mice as well as in Vaseline- and Neosporin-treated human wound bed. (C) qRT-PCR–determined mRNA expression of Hif-1α in SD0 skin of GF, SPF, PBS-treated, and S. aureus–treated mice. (D) Il-1β mRNA expression by qRT-PCR under hypoxic conditionsin MKC. (E) Il-1β expression in MKC treated with or without glutamine and Hif-1α siRNA, as detected by ELISA. (F) Glutamate expression of MKC treated with or without Hif-1α siRNA under hypoxic or normoxic conditions, as detected by ELISA. (G) Il-1β and Wnt7b expression of MKC treated with or without Hif-1α siRNA under hypoxic or normoxic conditions, as detected by qRT-PCR. (H) Glutamate, Il-1β, Wnt7B, and Krt7 expression of S. aureus–induced MKC treated with or without Hif-1α siRNA, as detected by ELISA and qRT-PCR. Scr-siR indicates scramble siRNA. (I) WIHN of S. aureus and LW6 treated mice, as detected by CSLM (right) and quantification (left). The red dashed square indicate the regenerative hair follicles. (J) Glutamate and Il-1β expression of S. aureus– and LW6-treated (WD3) mice SD0 wound bed, as detected by ELISA. Graphing and statistics as in Fig. 1. n = 3 to 6 independent animals per group.
Fig. 6.
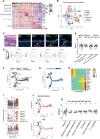
Fig. 6.. Hypoxia and glutamine metabolism are elevated in wound center versus periphery in WIHN.
(A and B) t-SNE plots visualization of WT mice SD0 wound center (high-WIHN, A) and SD0 wound periphery (non-WIHN, B) by scRNA-seq. Five mice were pooled per sample. (C) The overall number of cellular interactions in the wound center (top) or the periphery (bottom) at SD0 as detected by CellChat algorithm. Thicker lines indicate more interactions. (D) Specific cell-cell interaction patterns of IL-6 and IL-1 (left). Specific incoming signals of each cell type in the wound center and periphery at SD0 (right). Outgoing signals are shown in fig. S7F. (E) The t-SNE plots clustered by all gene expression profiles (top) or just by hypoxia gene expression profiles (bottom) of SD0 keratinocytes. (F) GO enrichment analysis of keratinocytes in the wound center versus the periphery. (G) Scores for hypoxia, glutamine, and glutamate metabolism and IL-1 signaling calculated by PCA method in keratinocytes comparing wound center versus wound periphery. (H) The correlation of IL-1 signaling score and hypoxia score in keratinocytes as analyzed by Spearman correlation. The scores of center and periphery of the wound are shown in red and blue, respectively. (I) GO enrichment analysis in the wound center keratinocytes with a high glutamate score (left) compared to those with a low glutamate score (right). The high and low glutamate scores were calculated using the PCA method as detailed in Materials and Methods. Box plot graphs indicated the value of minimum, first, quartile, median, third quartile, and maximum. Unless otherwise noted, statistics as in Fig. 1. NADH, reduced form of nicotinamide adenine dinucleotide.
Fig. 7.
Fig. 7.. Hypoxia and glutamine metabolism correlate to hair follicle development in WIHN.
(A) Heatmap for canonical keratinocyte marker genes in each cluster of the wound center from scRNA-seq of SD0 samples. (B) The t-SNE plot shows clustering of SD0 wound center keratinocytes subpopulations. (C) H&E, Col17a1, Cox-2, Ube2c, and Krt17 staining of SD0 wounds to establish location of basal1, basal2, proliferous, and HG keratinocytes. Scale bars, 50 μm. (D) Expression of HG marker genes to identify the HG cluster in t-SNE plots. (E) The scores for hypoxia, glutamine, and glutamate metabolism and IL-1 signaling in keratinocytes subpopulations. (F and G) Pseudotime analysis plotting the development pattern of basal, spinous, proliferative, and HG keratinocytes. (H) The heatmap of differentiation markers with pseudotime. (I) Pseudotime plot depicting the abundance of HG markers Krt17, Krt79, and Sox9 as divided by keratinocyte subpopulation. (J) Pseudotime analysis divided all keratinocytes (top) and HG (bottom) into six stages according to the developmental sequence; the different stages are indicated by different colors labeled A to F. (K) The gene expression scores for hypoxia, glutamine, and glutamate metabolism, and IL-1 signaling pathways as divided by HG developmental stage. Box plot graphs indicated the value of minimum, first, quartile, median, third quartile, and maximum. Statistics as in Fig. 1.

References

    1. G. Wang, E. Sweren, H. Liu, E. Wier, M. P. Alphonse, R. Chen, N. Islam, A. Li, Y. Xue, J. Chen, Y. Chen, S. Lee, Y. Wang, S. Wang, N. K. Archer, W. Andrews, M. A. Kane, E. Dare, S. K. Reddy, Z. Hu, E. A. Grice, L. S. Miller, L. A. Garza, Bacteria induce skin regeneration via IL-1β signaling. Cell Host Microbe 29, 777–791.e6 (2021). - PMC - PubMed
    1. H. Abo, B. Chassaing, A. Harusato, M. Quiros, J. C. Brazil, V. L. Ngo, E. Viennois, D. Merlin, A. T. Gewirtz, A. Nusrat, T. L. Denning, Erythroid differentiation regulator-1 induced by microbiota in early life drives intestinal stem cell proliferation and regeneration. Nat. Commun. 11, 513 (2020). - PMC - PubMed
    1. H. Wu, S. Xie, J. Miao, Y. Li, Z. Wang, M. Wang, Q. Yu, Lactobacillus reuteri maintains intestinal epithelial regeneration and repairs damaged intestinal mucosa. Gut Microbes. 11, 997–1014 (2020). - PMC - PubMed
    1. Y. Liu, Y. Wang, Y. Ni, C. K. Y. Cheung, K. S. L. Lam, Y. Wang, Z. Xia, D. Ye, J. Guo, M. A. Tse, G. Panagiotou, A. Xu, Gut microbiome fermentation determines the efficacy of exercise for diabetes prevention. Cell Metab. 31, 77–91.e5 (2020). - PubMed
    1. J. He, T. Chan, X. Hong, F. Zheng, C. Zhu, L. Yin, W. Dai, D. Tang, D. Liu, Y. Dai, Microbiome and metabolome analyses reveal the disruption of lipid metabolism in systemic lupus erythematosus. Front. Immunol. 11, 1703 (2020). - PMC - PubMed