. 2023 Jan 4;15(677):eadd3949.
doi: 10.1126/scitranslmed.add3949. Epub 2023 Jan 4.

An autocrine signaling circuit in hepatic stellate cells underlies advanced fibrosis in nonalcoholic steatohepatitis

Affiliations

An autocrine signaling circuit in hepatic stellate cells underlies advanced fibrosis in nonalcoholic steatohepatitis

Shuang Wang et al. Sci Transl Med. .

Abstract

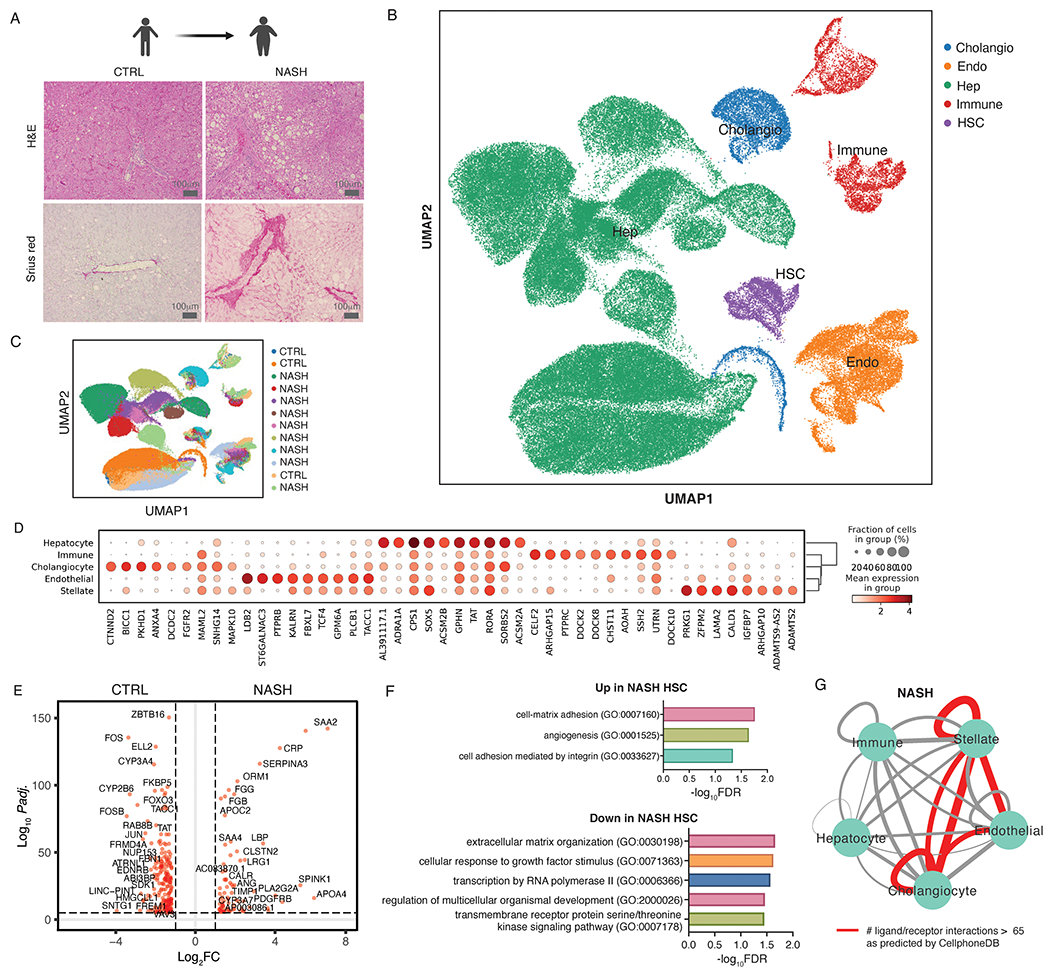
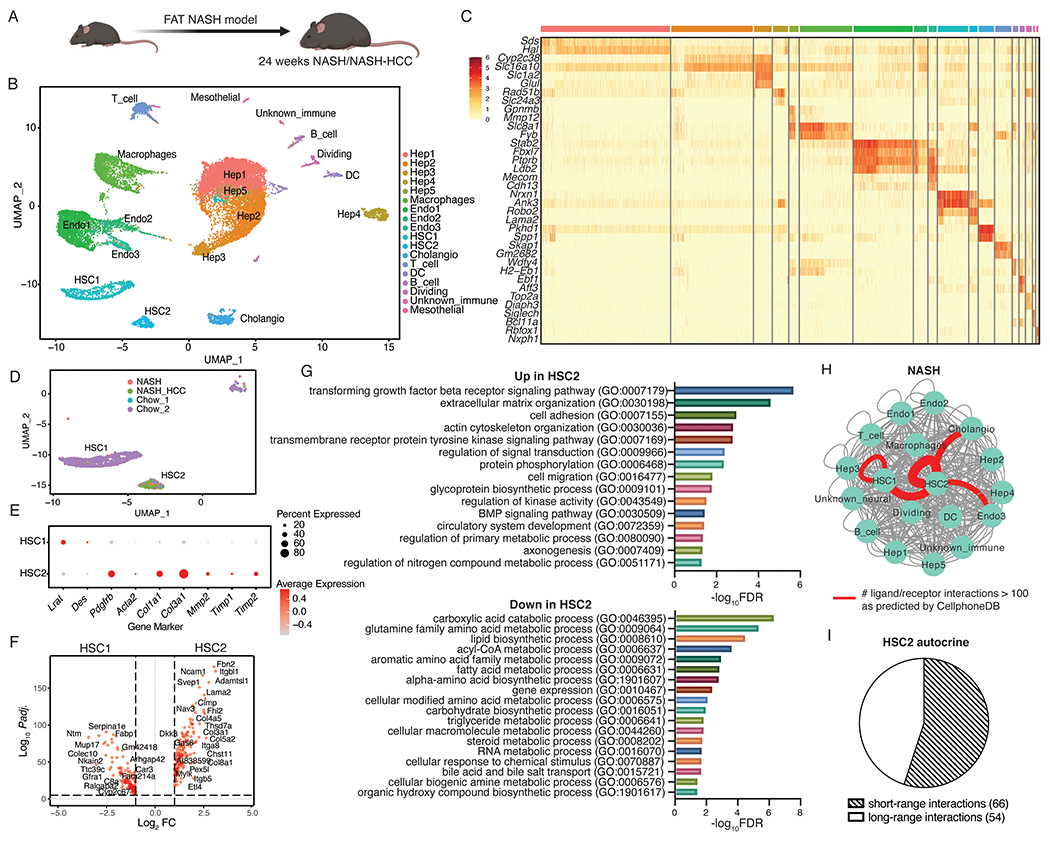
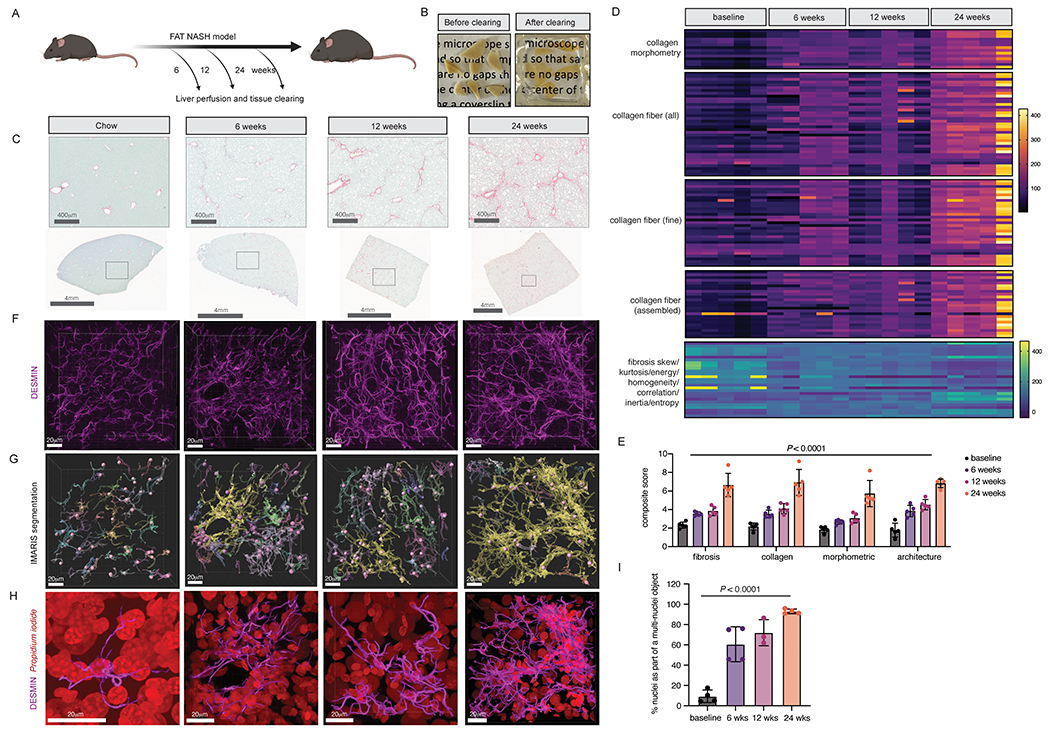
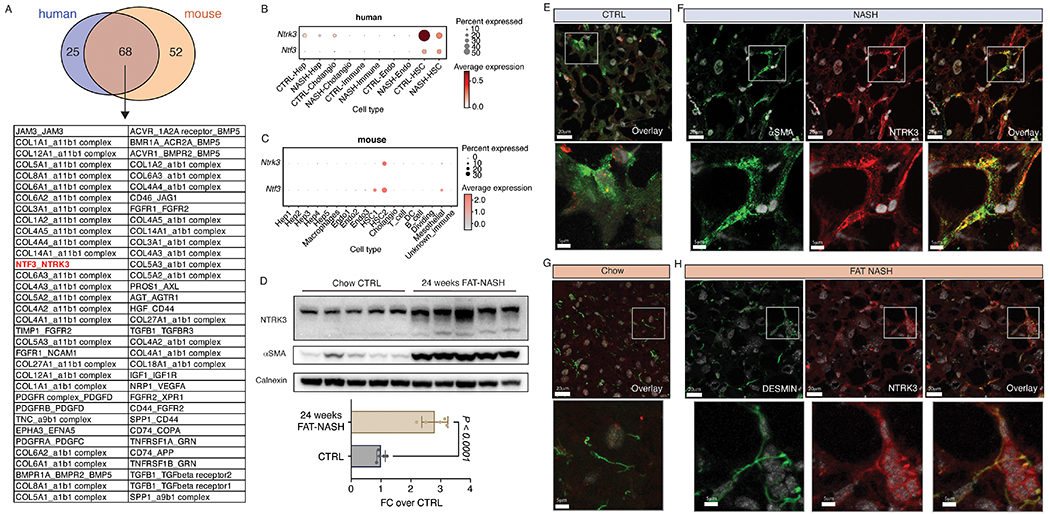
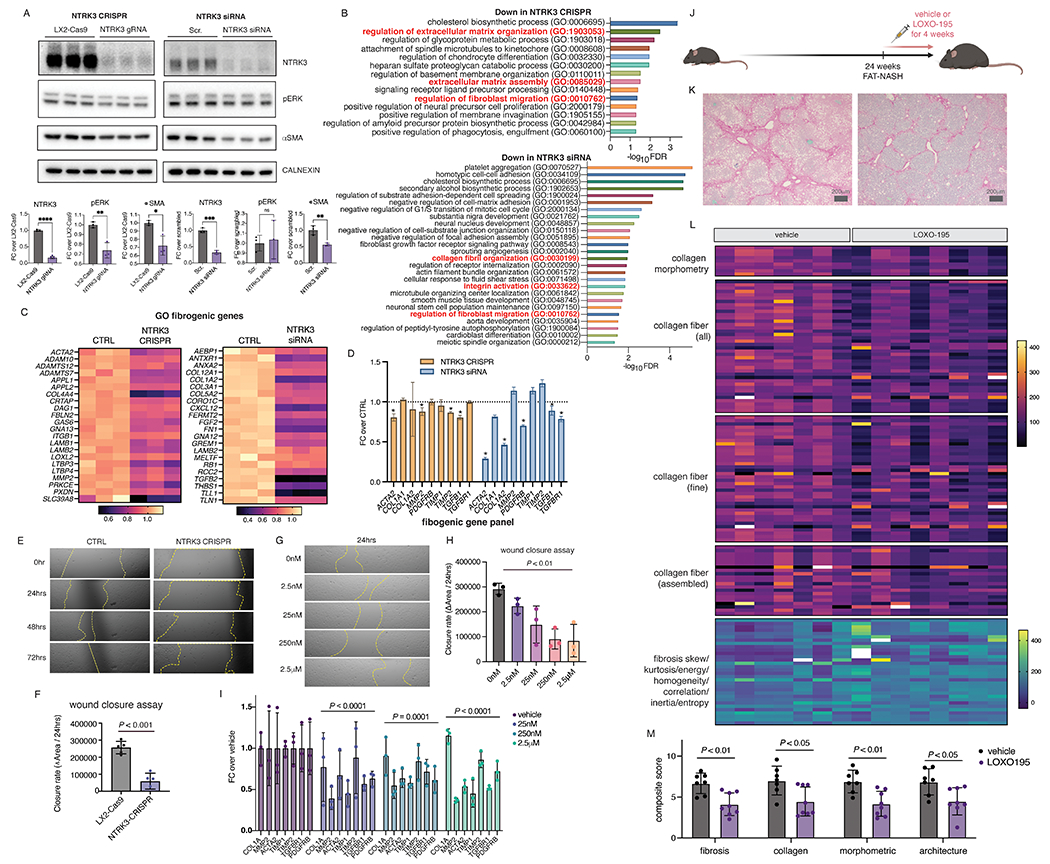
Advanced hepatic fibrosis, driven by the activation of hepatic stellate cells (HSCs), affects millions worldwide and is the strongest predictor of mortality in nonalcoholic steatohepatitis (NASH); however, there are no approved antifibrotic therapies. To identify antifibrotic drug targets, we integrated progressive transcriptomic and morphological responses that accompany HSC activation in advanced disease using single-nucleus RNA sequencing and tissue clearing in a robust murine NASH model. In advanced fibrosis, we found that an autocrine HSC signaling circuit emerged that was composed of 68 receptor-ligand interactions conserved between murine and human NASH. These predicted interactions were supported by the parallel appearance of markedly increased direct stellate cell-cell contacts in murine NASH. As proof of principle, pharmacological inhibition of one such autocrine interaction, neurotrophic receptor tyrosine kinase 3-neurotrophin 3, inhibited human HSC activation in culture and reversed advanced murine NASH fibrosis. In summary, we uncovered a repertoire of antifibrotic drug targets underlying advanced fibrosis in vivo. The findings suggest a therapeutic paradigm in which stage-specific therapies could yield enhanced antifibrotic efficacy in patients with advanced hepatic fibrosis.


Conflict of interest statement

Competing interests: Chris Carrico, Ian Driver, and Martin Borch Jensen are employees of Gordian Biotechnology, CA, USA. Scott Friedman is a consultant to Gordian Biotechnology, CA, USA. Scott Friedman and Shuang Wang are inventors on United States provisional patent application 63/345,236 submitted by Icahn School of Medicine at Mount Sinai claiming the use of neurotrophic tyrosine receptor kinase (Trk) inhibitors for liver disease and other diseases. Dr. Friedman is a consultant to Gordian Biotechnology. The other authors declare that they have no competing interests.

Figures

Figure 1.
Figure 1.. Single nucleus RNA-seq of patients with NASH uncovers an autocrine signaling loop in NASH-associated hepatic stellate cells (HSCs).
(A) Hematoxylin and Eosin and Sirius red staining of 3 control and 9 human NASH samples used for snRNA-seq. (B) UMAP visualization of all nuclei derived from control and NASH livers colored by cell type. (C) UMAP visualization of all nuclei derived from control and NASH livers colored by sample of origin. (D) Top 8 marker gene expression for each cell type. (E) Differentially expressed genes (DEGs) between HSCs from controls vs patients with NASH (red dots indicate DEG with Padj. < 0.05 and log2FC > 1). (F) All significantly enriched PANTHER pathways (FDR < 0.05) in genes up- and down-regulated in NASH-associated HSCs. (G) Total number of significant interactions between different cell types as predicted using CellphoneDB. Thickness of the connecting line is proportional to the total number of interactions, with interactions > 65 highlighted in red.
Figure 2.
Figure 2.. Autocrine signaling in NASH-associated hepatic stellate cells is conserved in FAT-NASH mice.
(A) Schematic of control (n=2), NASH (n=3), and NASH-HCC (n=3) mice used in this experiment. (B) UMAP visualization of nuclei combined from all liver samples colored by cell type. (C) Top 2 marker gene expression for each cell type. (D) UMAP visualization of hepatic stellate cell (HSC) clusters colored by sample origin. (E) Dot plot depicting canonical quiescence and activation marker gene expression for each HSC cluster. (F) Differentially expressed genes between HSC1 and HSC2 (red dots indicate DEG with Padj. < 0.05 and log2FC > 1). (G) All significantly enriched PANTHER pathways (FDR < 0.05) in genes up- and down-regulated in NASH-associated HSCs. (H) Total number of significant interactions between different cell types from NASH/NASH-HCC mice as predicted using CellphoneDB (P < 0.05). Thickness of the connecting line is proportional to the total number of interactions, with interactions > 70 highlighted in red. (I) HSC autocrine interactions classified as short-range or long-range based on manual curation.
Figure 3.
Figure 3.. Increased stellate cell-stellate cell contacts in FAT-NASH mice revealed by tissue-clearing and 3D imaging.
(A) Liver from FAT-NASH mice were perfused and cleared at the depicted timepoints. (B) Representative images of perfused liver pieces before and after clearing. (C) Representative images from Sirius red staining of FAT-NASH livers from different timepoints in the model. (D) AI-based quantification of Sirius red collagen staining from five mice per timepoint. (E) Composite fibrosis scores calculated based on (D). (F) Confocal imaging and 3D reconstruction of DESMIN staining in cleared livers. (G) IMARIS surface and spot segmentation of DESMIN and nuclear staining, respectively, of the same images from C. (H) Enlarged image of a single segmented DESMIN+ surface object highlighted in yellow in (G), along with nuclear staining in red. (I) Quantification of the percentage of nuclei that are found as a single nucleus per surface object or multiple nuclei per surface object (n=3-4 mice per timepoint).
Figure 4.
Figure 4.. NTRK3 is expressed on cellular projections of NASH HSCs.
(A) Overlap of significant (P < 0.05) autocrine interactions identified in human and mouse NASH by CellphoneDB. Dot plot depicting NTRK3 gene expression across different cell types in human (B) and mouse (C) snRNA-seq data. (D) NTRK3 and αSMA protein expression in whole-liver lysates of control or 24-week FAT-NASH mice (n=5 mice per group, p-value calculated using Student’s t-test), as detected by Western blot and quantified by densitometry normalized to CALNEXIN as loading control. NTRK3 and αSMA protein expression in human control (E) and NASH (F) liver as detected by immunofluorescence. NTRK3 and DESMIN protein expression in mouse control (G) and NASH (H) liver as detected by immunofluorescence.
Figure 5.
Figure 5.. NTRK3 is an HSC autocrine drug target in NASH
(A) ERK phosphorylation and αSMA protein expression in LX-2 cells with NTRK3 knock down by CRISPR or siRNA, quantification of Western blot by densitometry using CALNEXIN as loading control (p-value calculated using Student’s t-test). (B) Gene Ontology analysis of the top 500 most significantly down-regulated genes from RNAseq analyses of NTRK3 knockdown cells (FDR < 0.05, fold enrichment score > 5), with biological processes related to HSC fibrogenicity highlighted in red and genes from these categories shown in (C). (D) Expression of an established fibrogenic gene panel with NTRK3 knockdown from RNAseq analyses (*,Padj. < 0.05 compared to control). (E) Representative migration of NTRK3 CRISPR knockdown cells LX-2 compared to control LX-2 cells in scratch assay (F, average over 4 biological replicates, p-value calculated by Student’s t-test). (G) Pharmacological inhibition of NTRK3 using LOXO-195 dose-dependently reduced LX-2 cell migration in scratch assay (average over 3 biological replicates, representative shown in (OH, p-value represents effect of treatment calculated using one-way ANOVA). (I) Expression of an established fibrogenic gene panel in LX-2 cells treated with varying concentration of LOXO-195 for 24hrs (average over 3 replicates in a single experiment reproduced in a separate experiment, p-values represent effect of drug treatment compared to vehicle by two-way ANOVA). (J) Schematic depiction of the LOXO-195 in vivo study design. (SK) Representative Sirius red staining from FAT-NASH mice with LOXO-195 or vehicle control. (L) AI-based quantification of Sirius red collagen staining from n=7-8 mice per treatment. (M) Composite fibrosis scores calculated based on (L), p-values calculated by student’s t-test.

Comment in

References

    1. Friedman SL, Neuschwander-Tetri BA, Rinella M, Sanyal AJ, Mechanisms of NAFLD development and therapeutic strategies. Nat Med 24, 908–922 (2018). - PMC - PubMed
    1. Schwabe RF, Tabas I, Pajvani UB, Mechanisms of Fibrosis Development in Nonalcoholic Steatohepatitis. Gastroenterology 158, 1913–1928 (2020). - PMC - PubMed
    1. Angulo P, Kleiner DE, Dam-Larsen S, Adams LA, Bjornsson ES, Charatcharoenwitthaya P, Mills PR, Keach JC, Lafferty HD, Stahler A, Haflidadottir S, Bendtsen F, Liver Fibrosis, but No Other Histologic Features, Is Associated With Long-term Outcomes of Patients With Nonalcoholic Fatty Liver Disease. Gastroenterology 149, 389–397 e310 (2015). - PMC - PubMed
    1. Vilar-Gomez E, Calzadilla-Bertot L, Wai-Sun Wong V, Castellanos M, Aller-de la Fuente R, Metwally M, Eslam M, Gonzalez-Fabian L, Alvarez-Quiñones Sanz M, Conde-Martin AF, De Boer B, McLeod D, Hung Chan AW, Chalasani N, George J, Adams LA, Romero-Gomez M, Fibrosis Severity as a Determinant of Cause-Specific Mortality in Patients With Advanced Nonalcoholic Fatty Liver Disease: A Multi-National Cohort Study. Gastroenterology 155, 443–457.e417 (2018). - PubMed
    1. Loomba R, Friedman SL, Shulman GI, Mechanisms and disease consequences of nonalcoholic fatty liver disease. Cell 184, 2537–2564 (2021). - PubMed

Publication types