. 2023 Jan 3;35(1):118-133.e7.
doi: 10.1016/j.cmet.2022.12.003.

Immunoediting instructs tumor metabolic reprogramming to support immune evasion

Affiliations

Immunoediting instructs tumor metabolic reprogramming to support immune evasion

Chin-Hsien Tsai et al. Cell Metab. .

Abstract

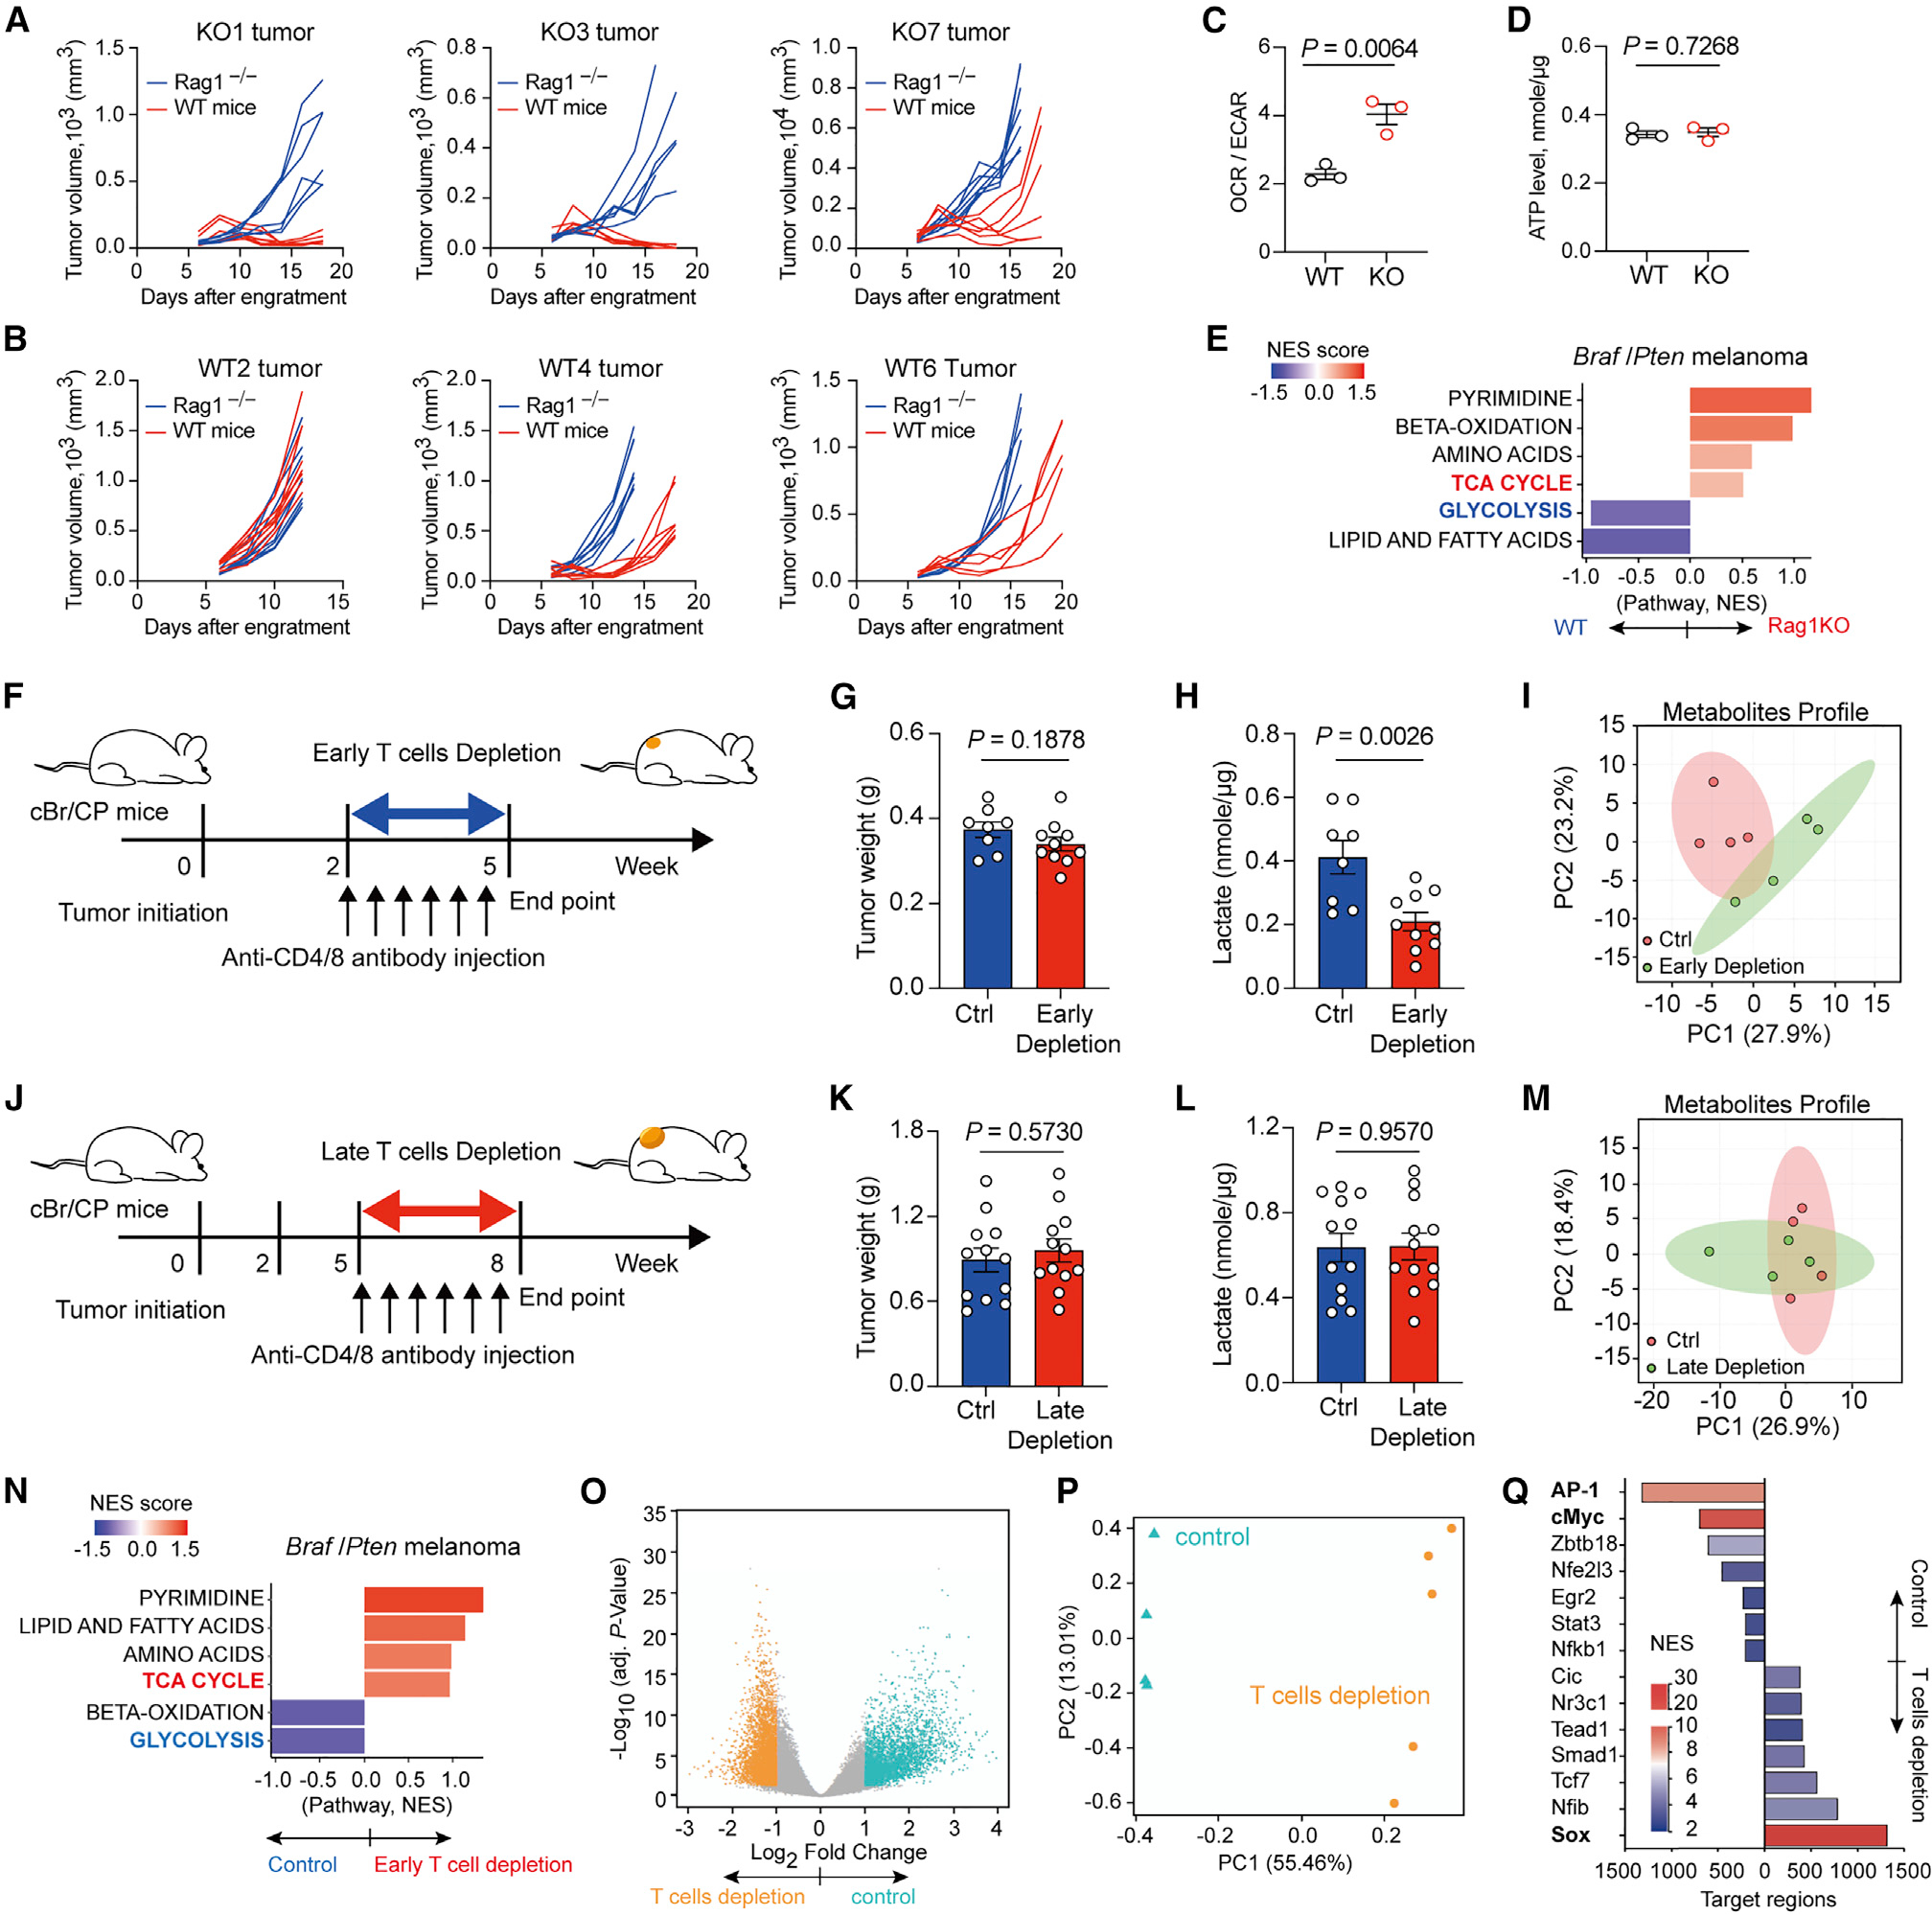
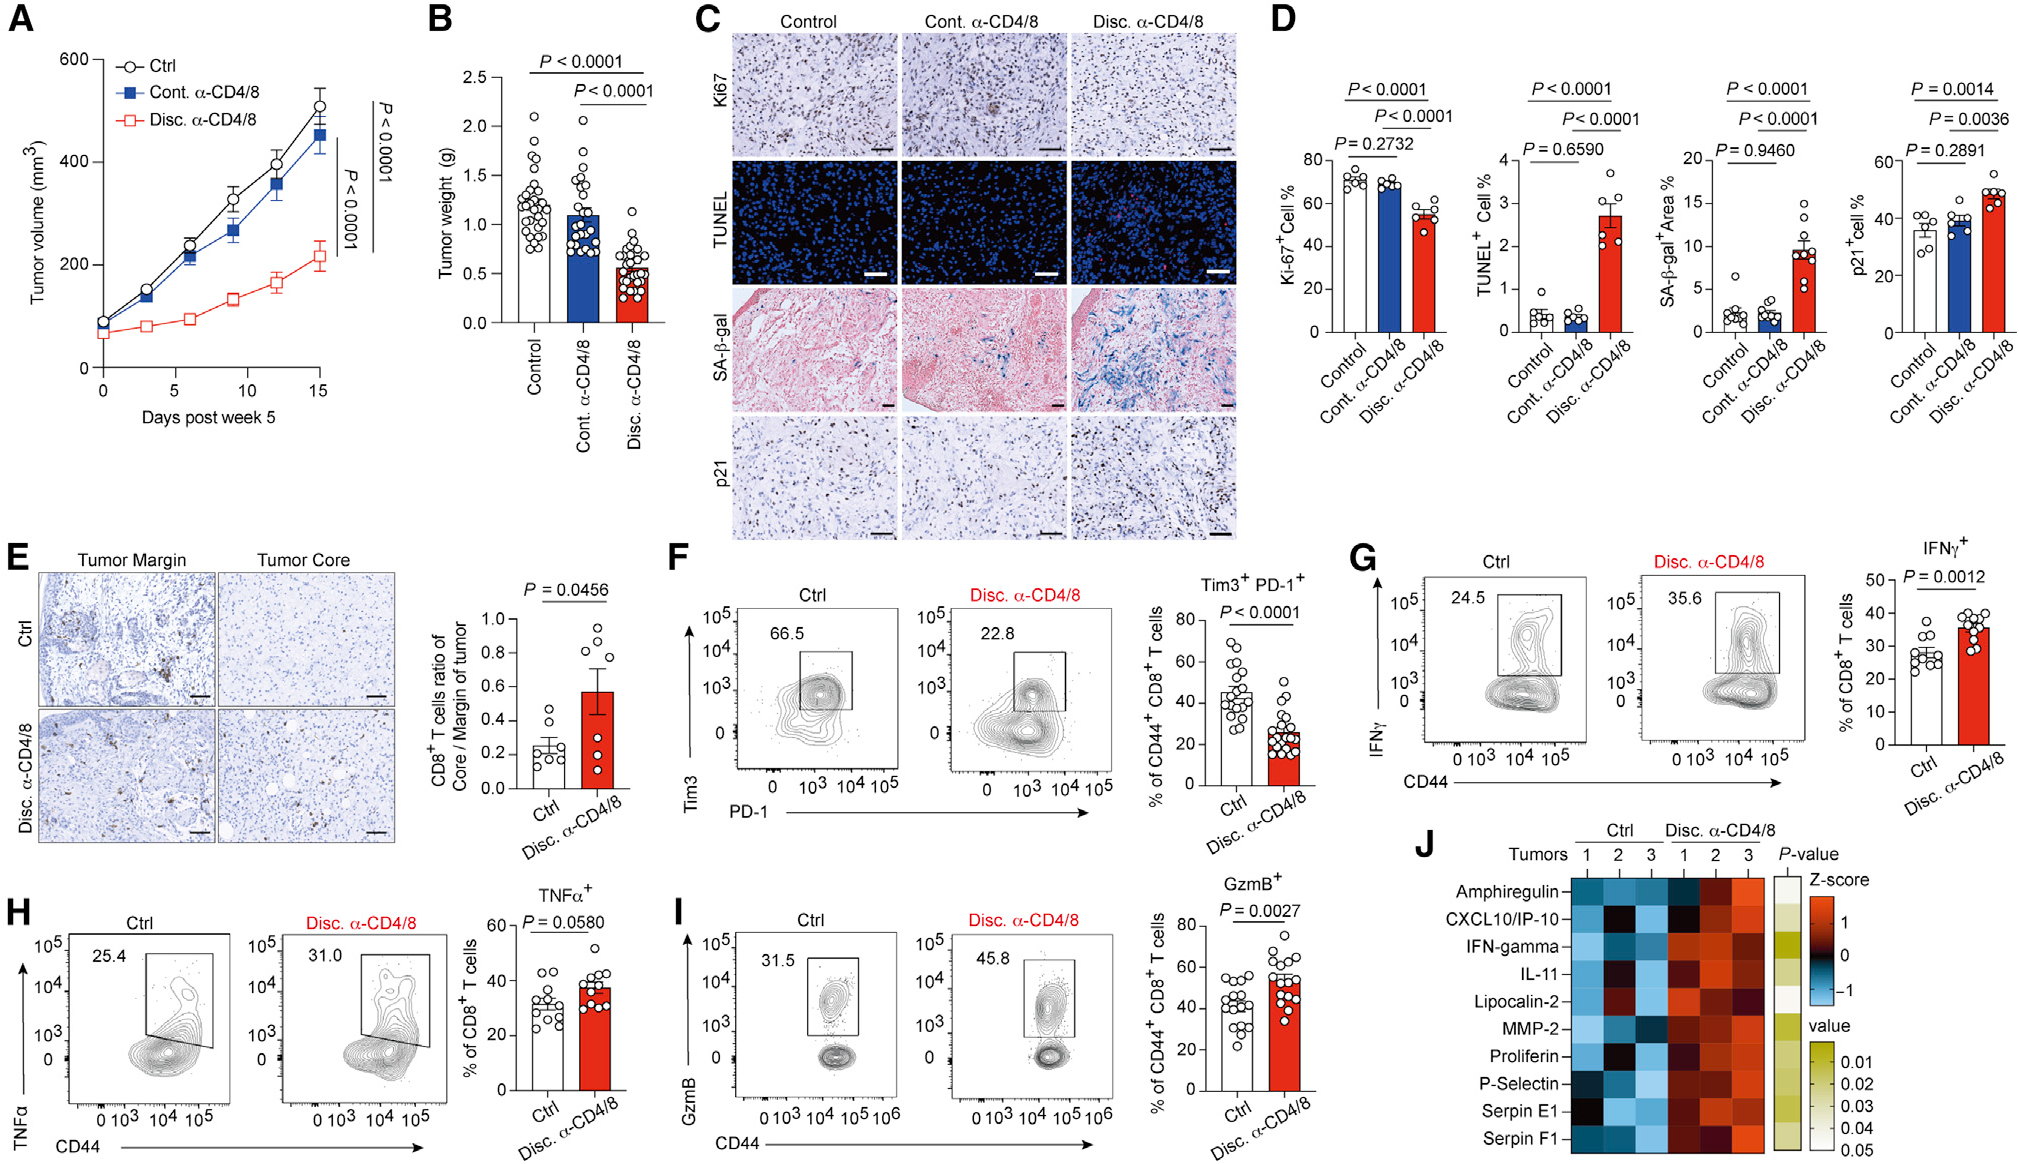
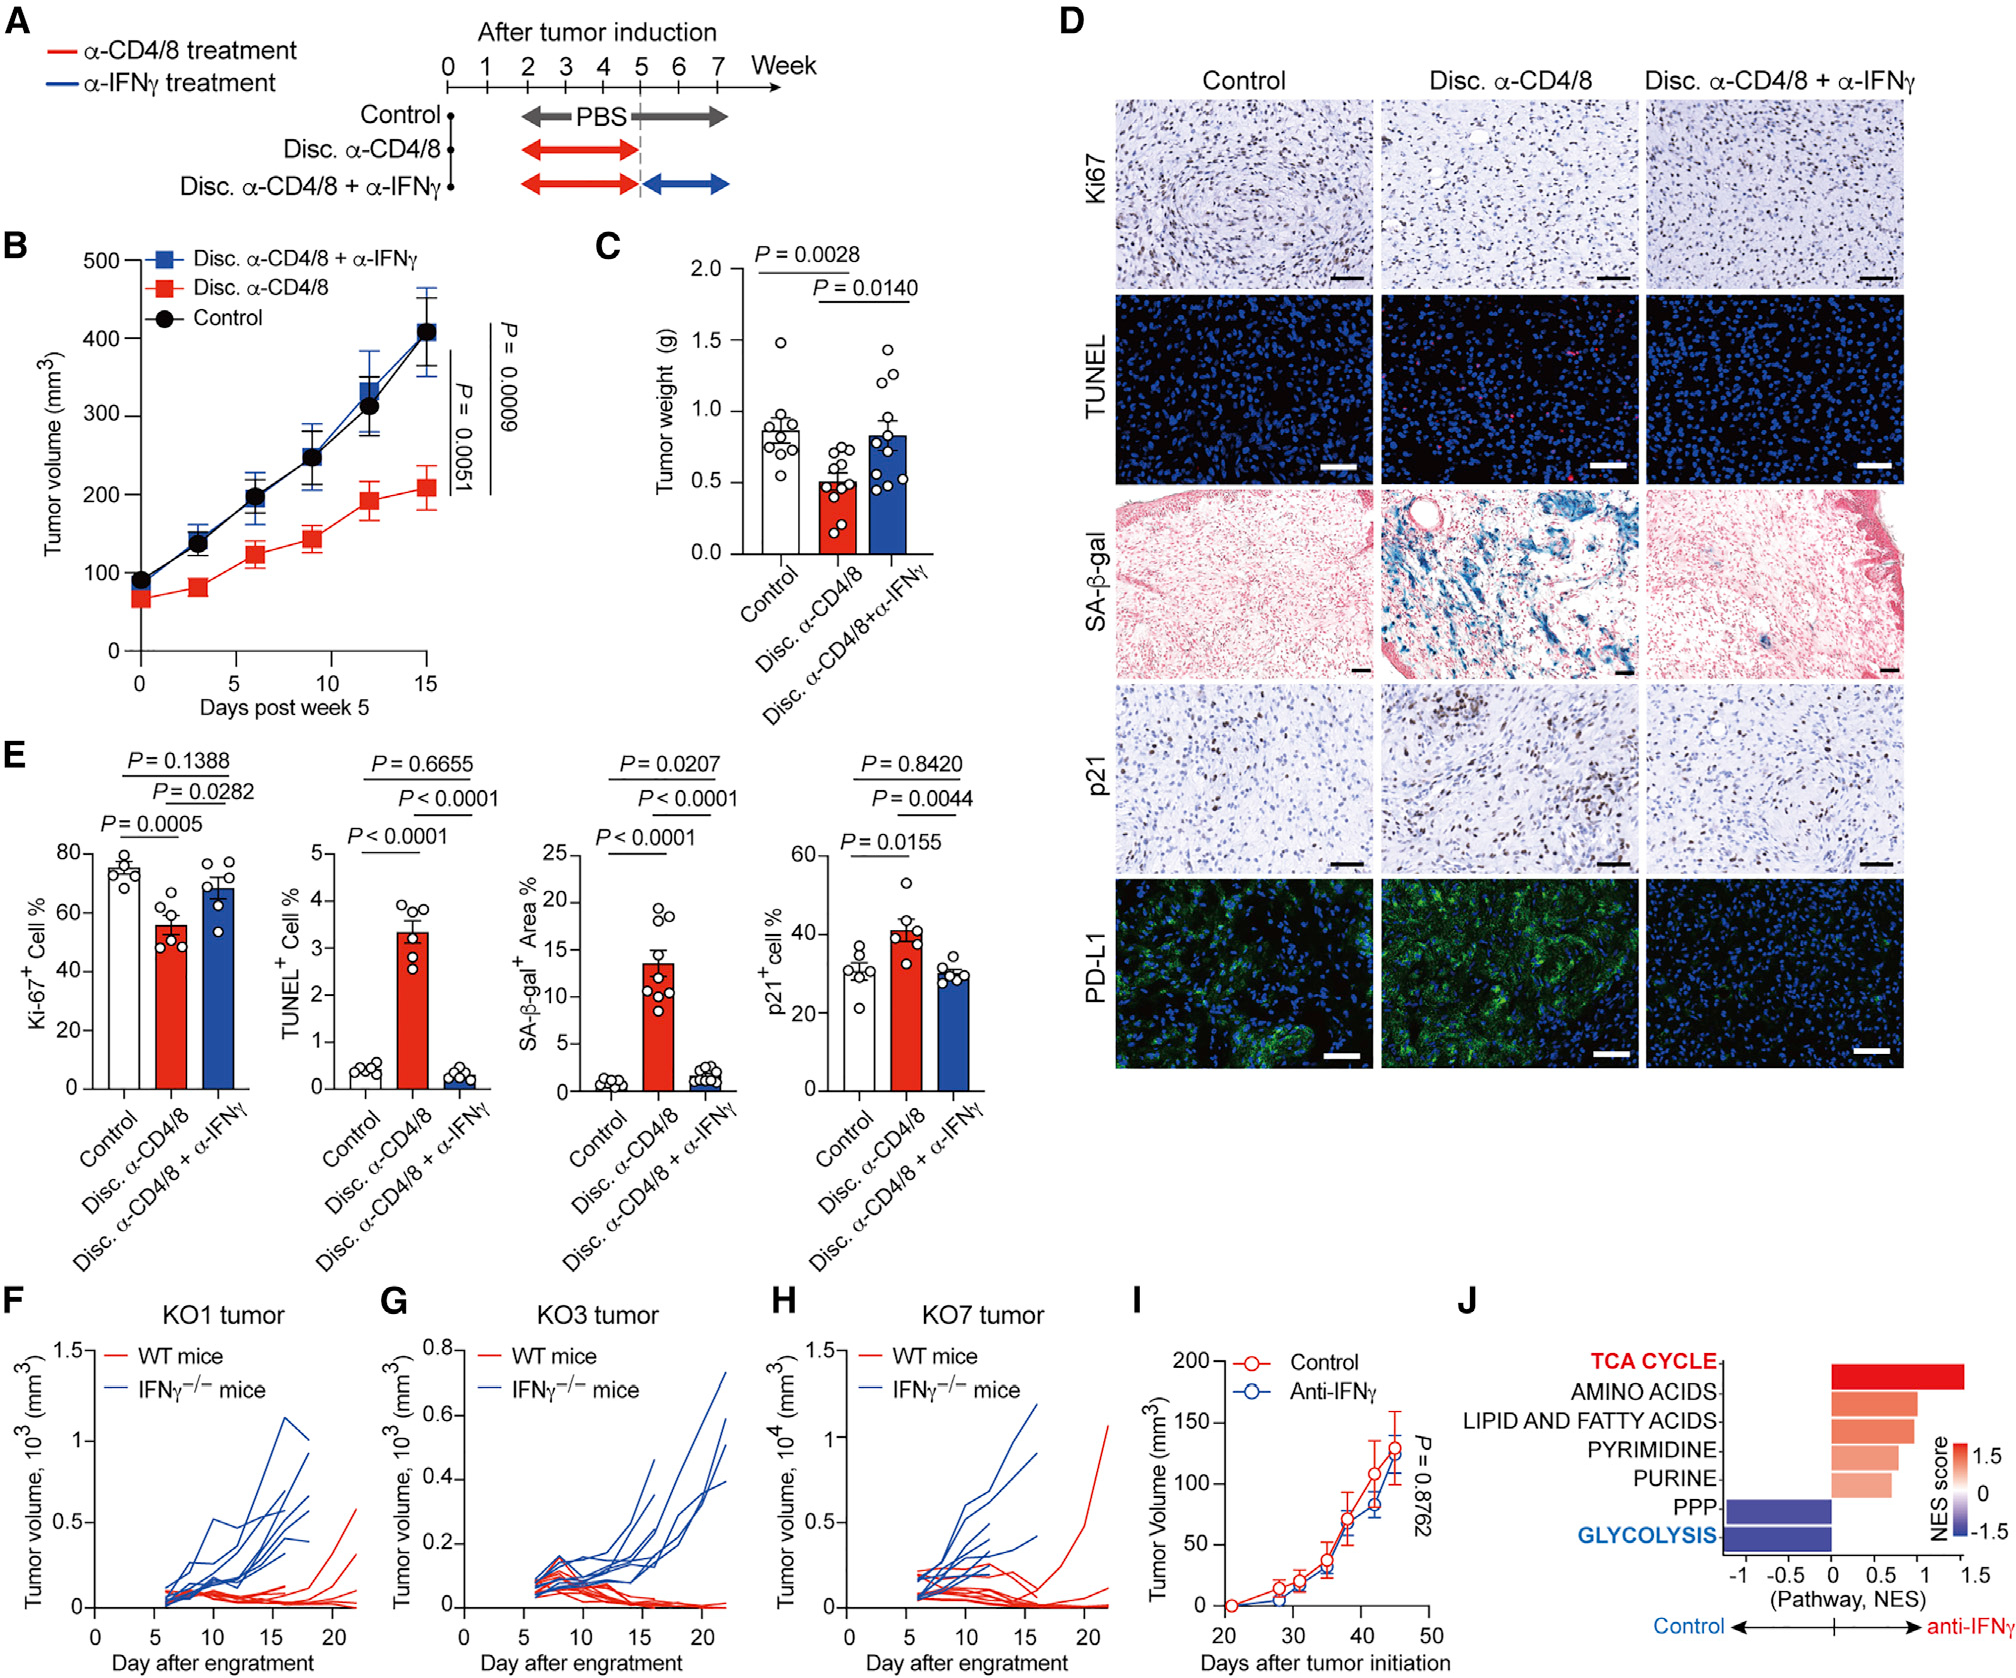
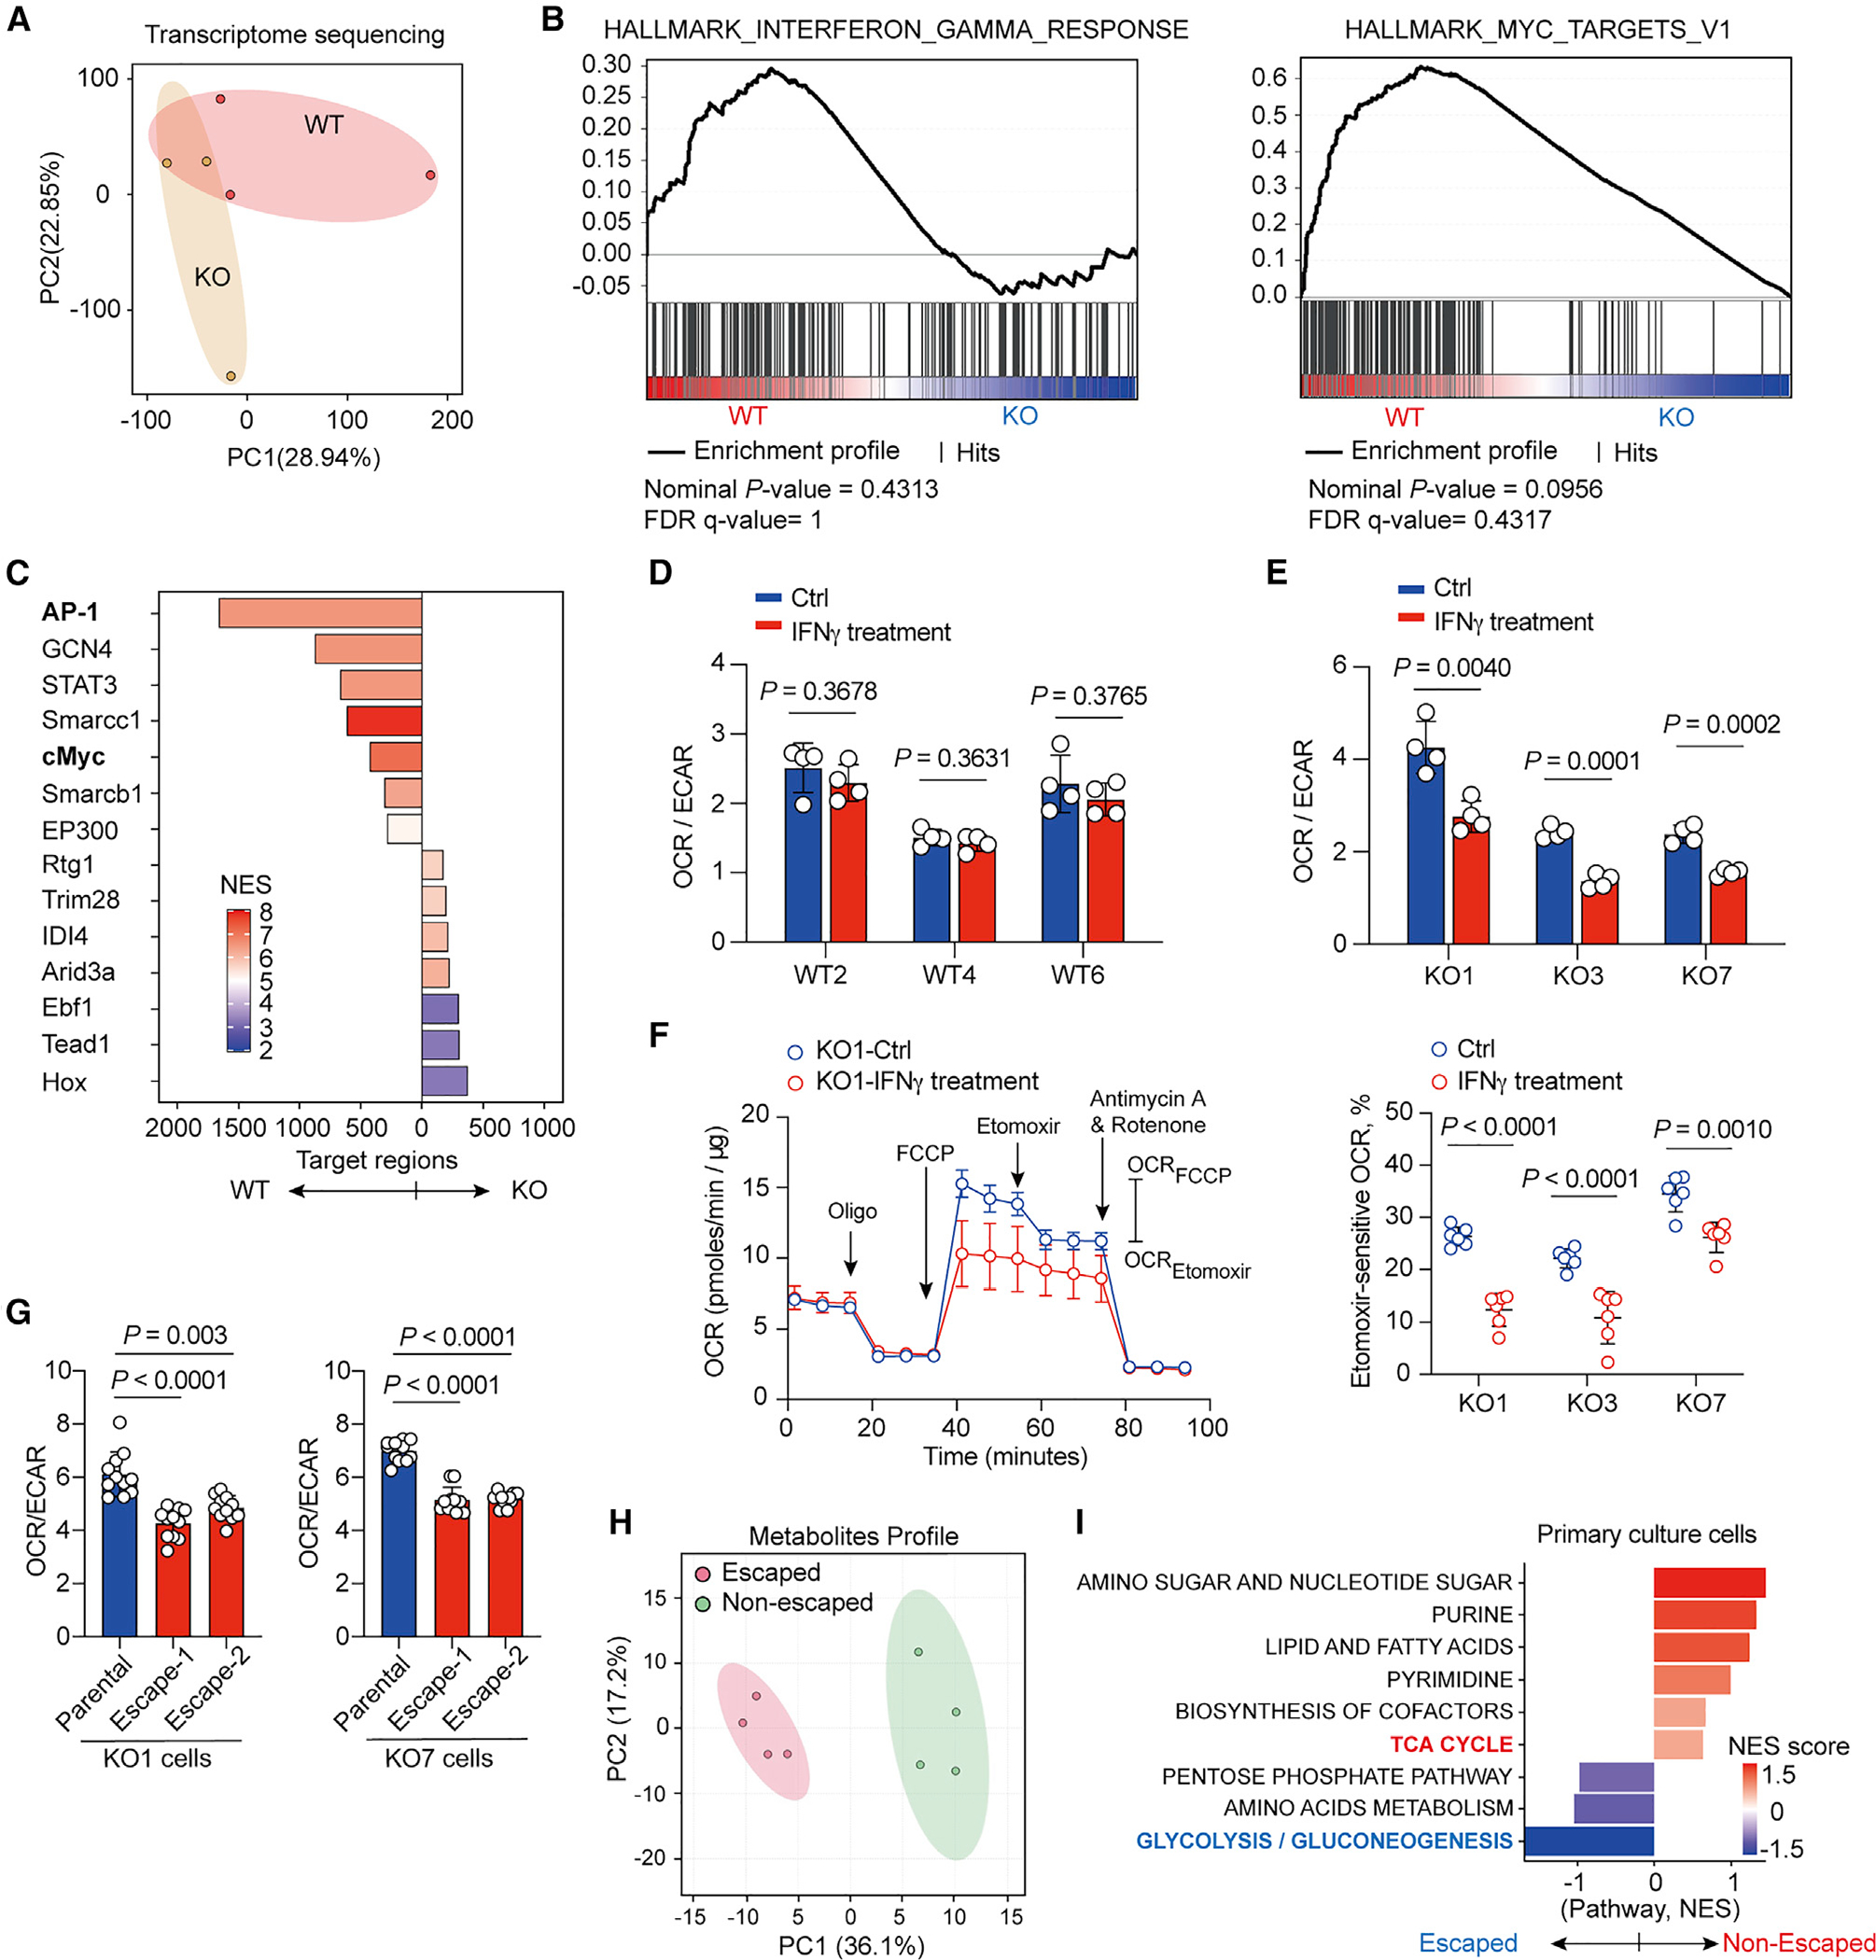
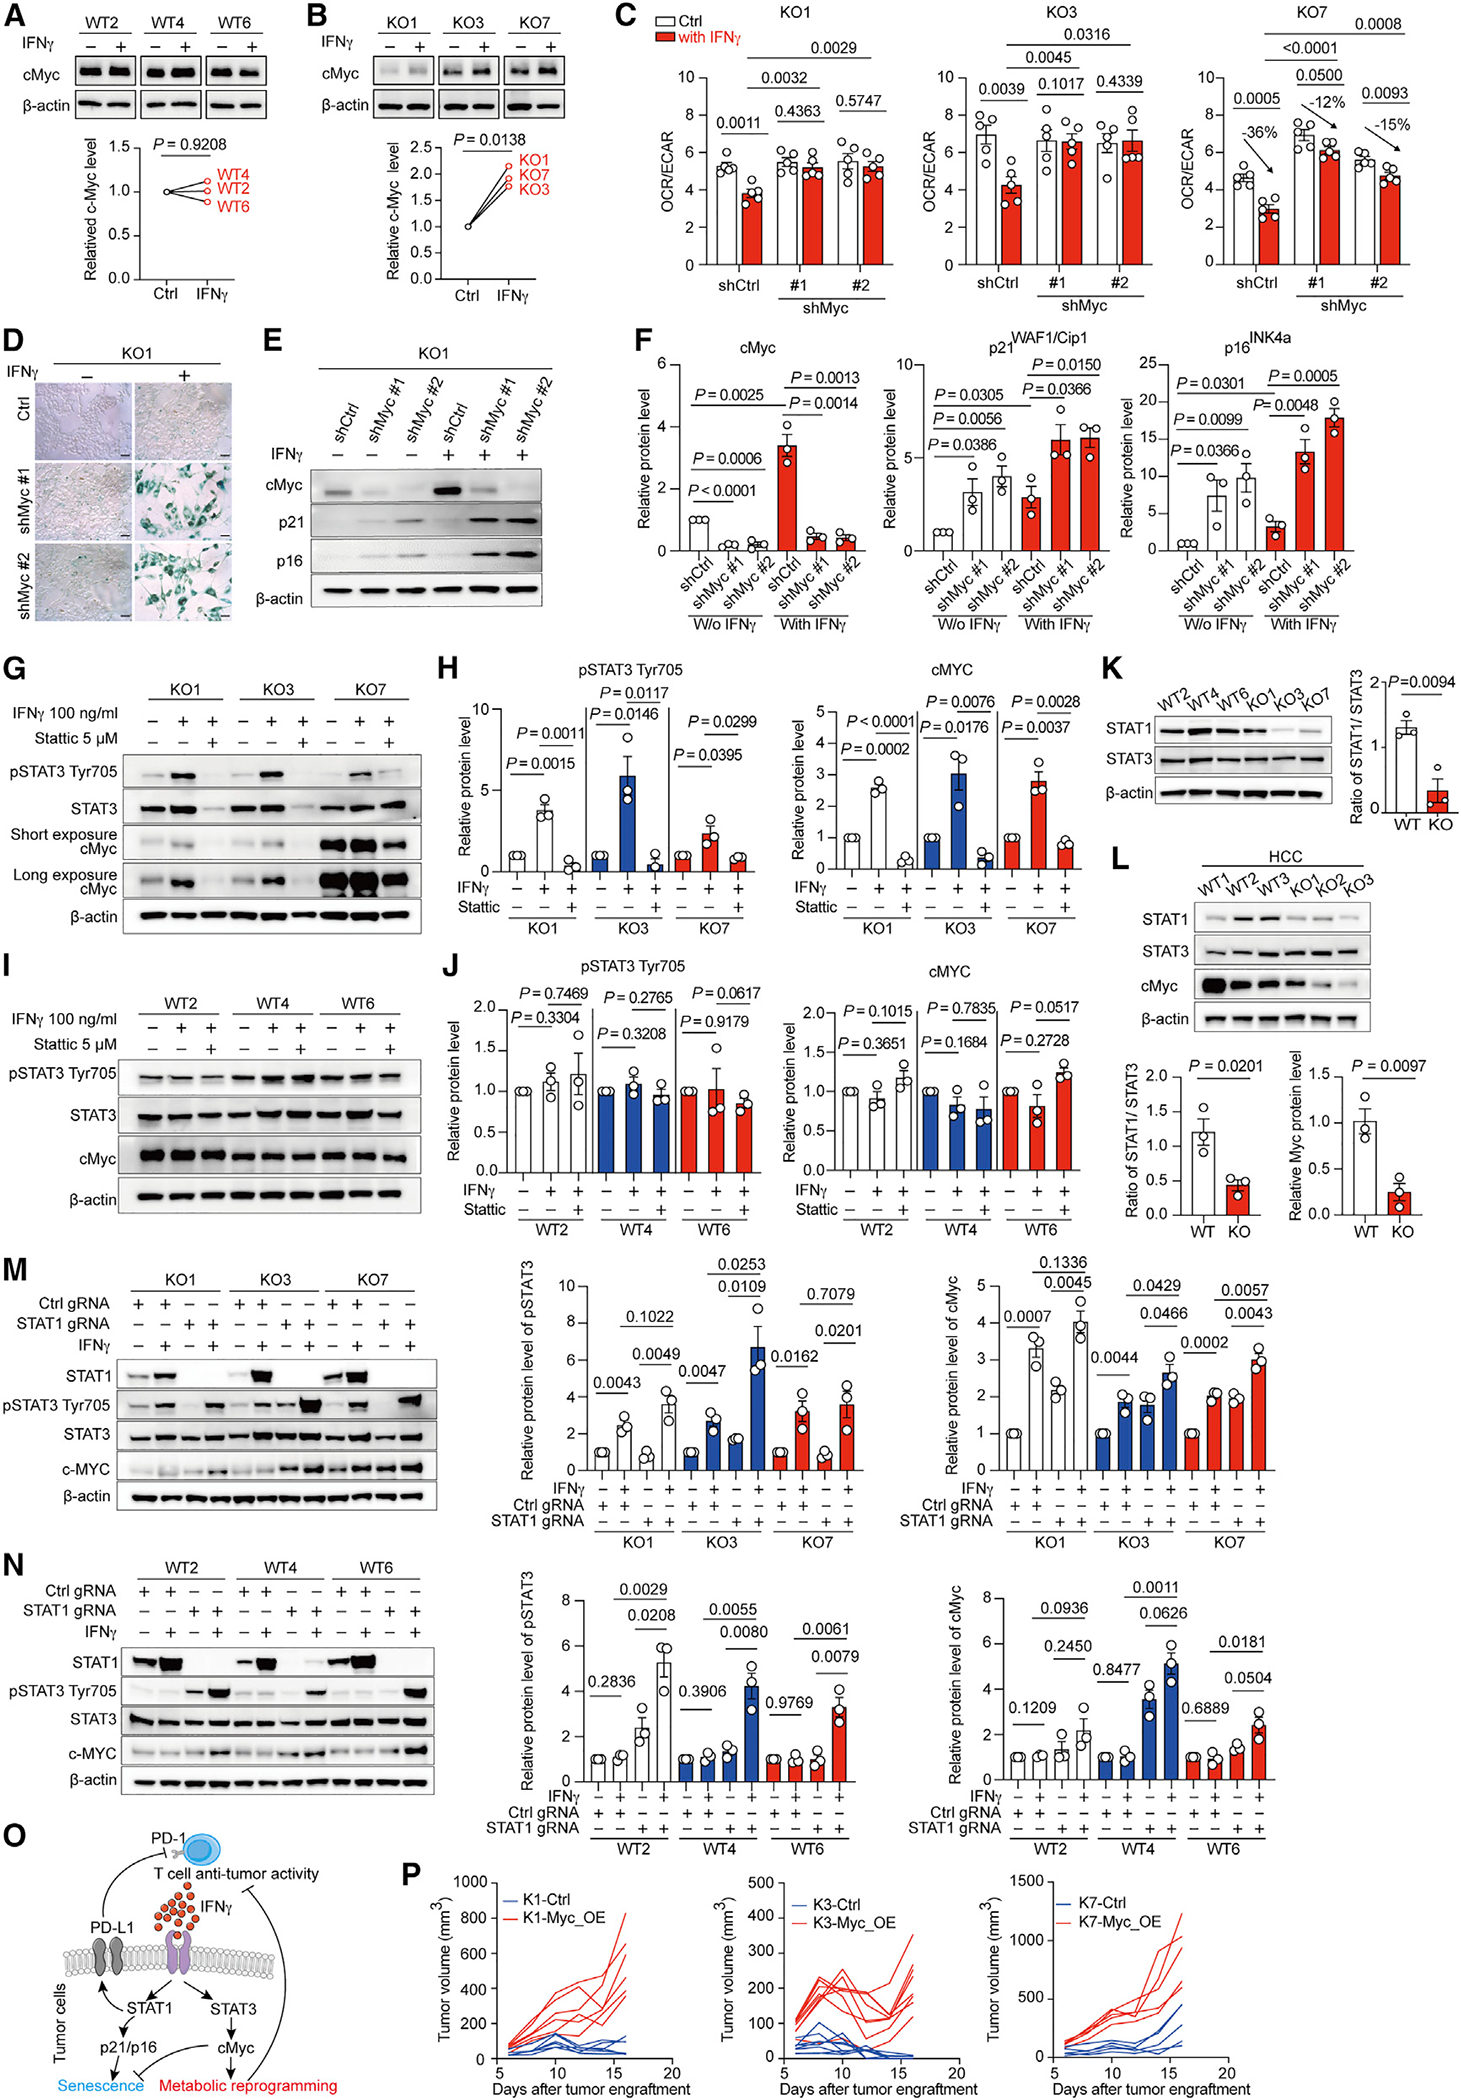
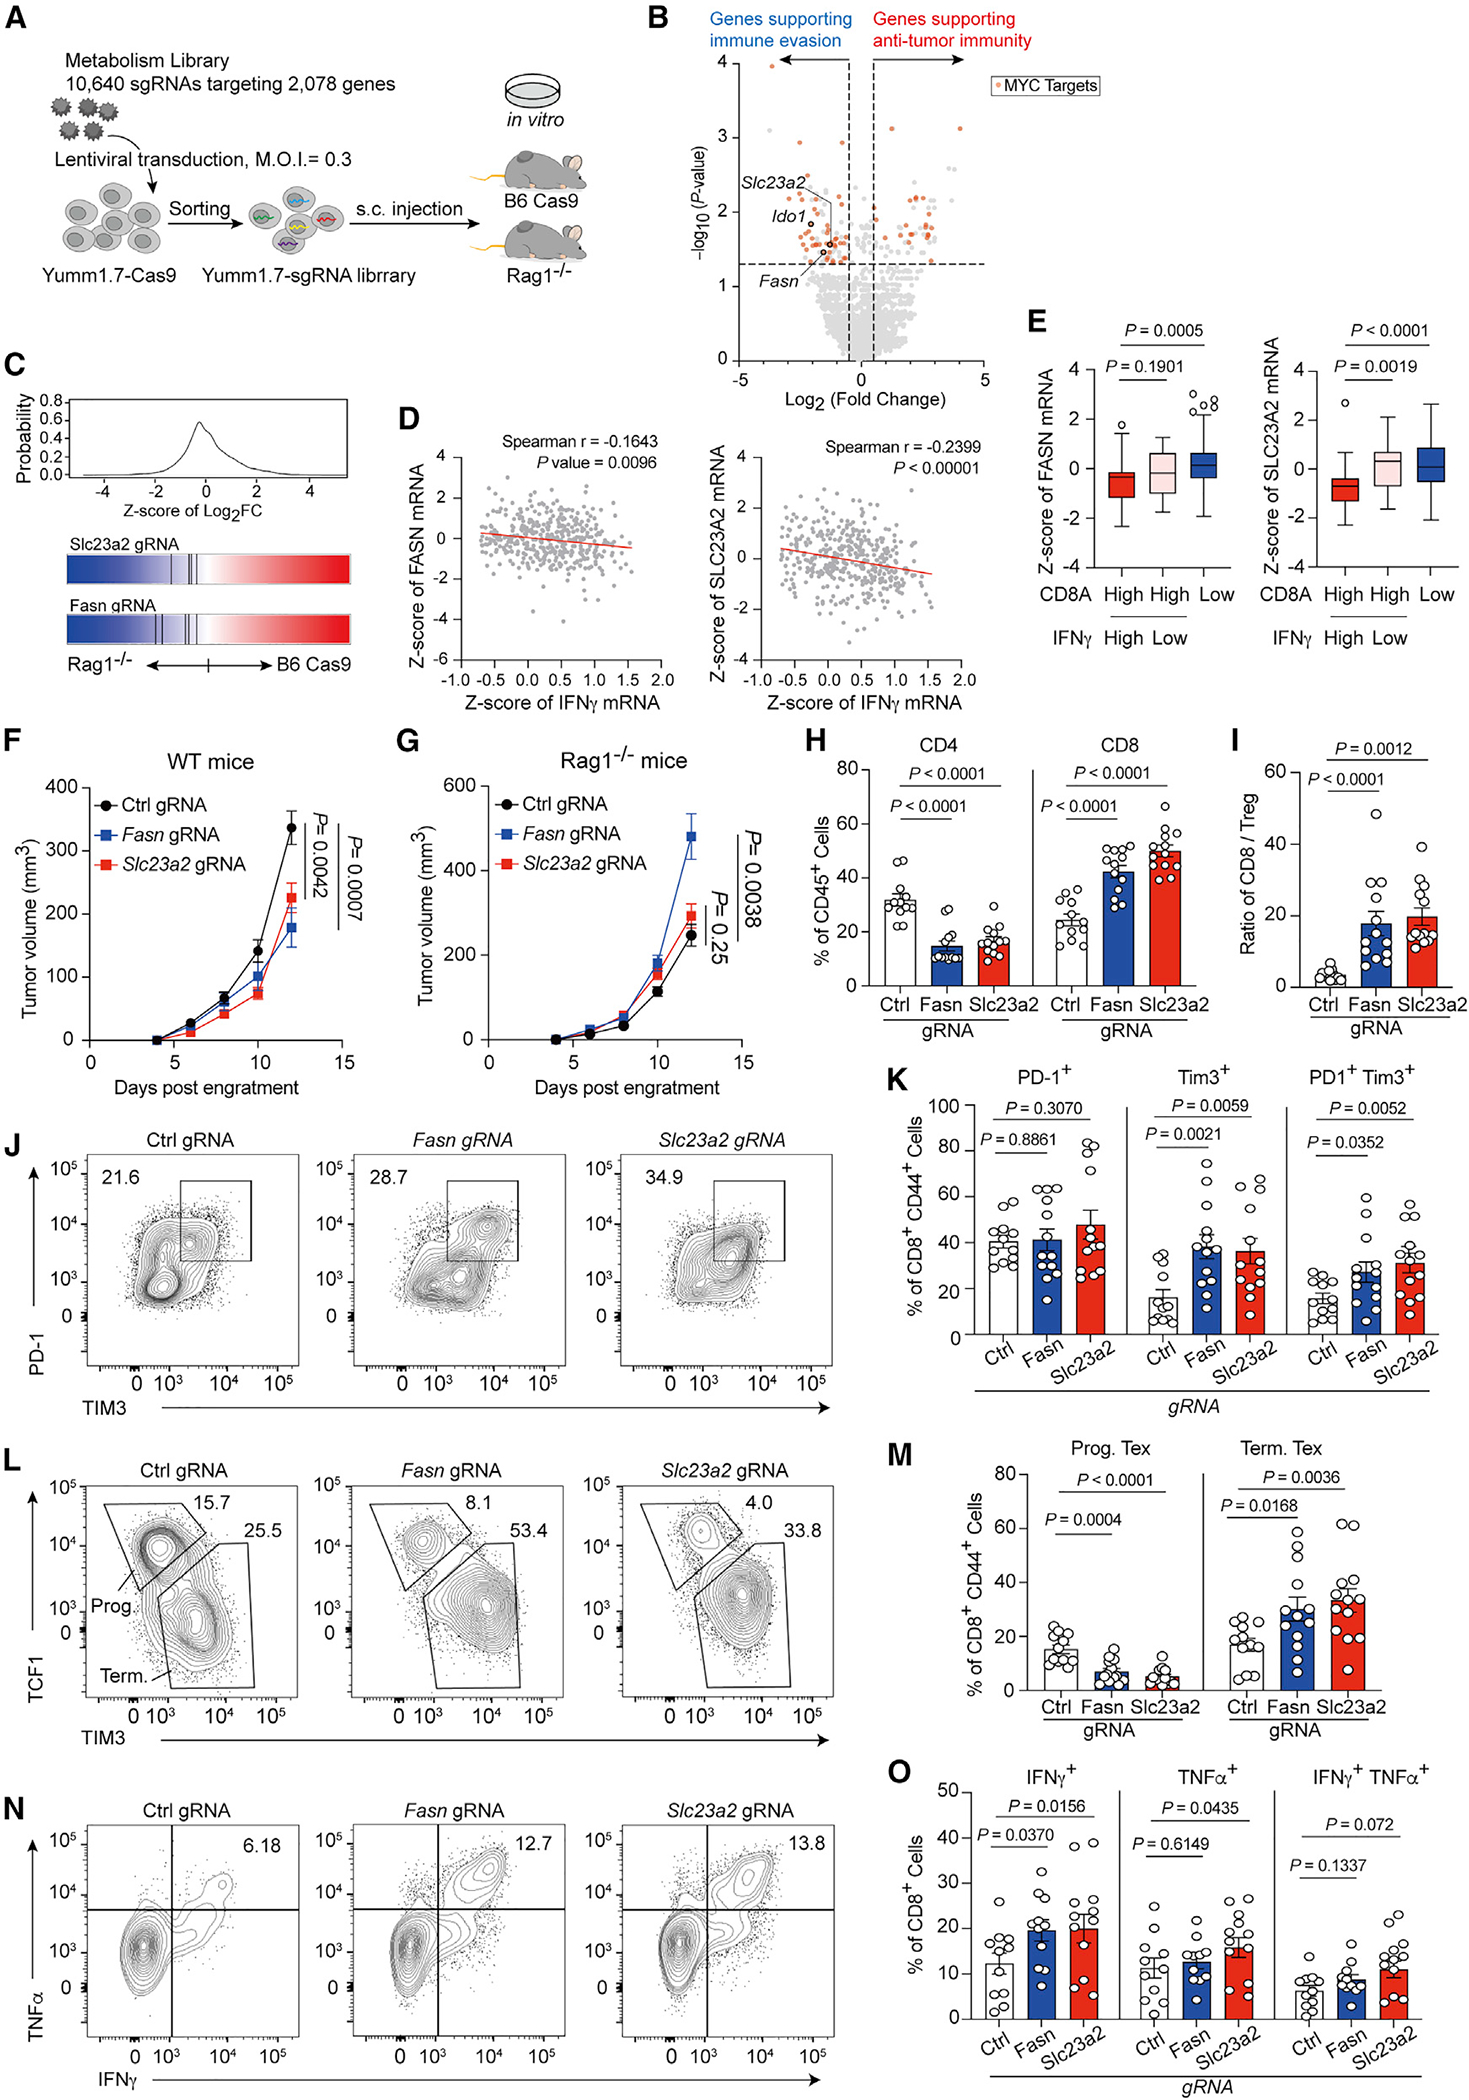
Immunoediting sculpts immunogenicity and thwarts host anti-tumor responses in tumor cells during tumorigenesis; however, it remains unknown whether metabolic programming of tumor cells can be guided by immunosurveillance. Here, we report that T cell-mediated immunosurveillance in early-stage tumorigenesis instructs c-Myc upregulation and metabolic reprogramming in tumor cells. This previously unexplored tumor-immune interaction is controlled by non-canonical interferon gamma (IFNγ)-STAT3 signaling and supports tumor immune evasion. Our findings uncover that immunoediting instructs deregulated bioenergetic programs in tumor cells to empower them to disarm the T cell-mediated immunosurveillance by imposing metabolic tug-of-war between tumor and infiltrating T cells and forming the suppressive tumor microenvironment.

Keywords: IFNγ; Myc; STAT3; immunoediting; immunosurveillance; tumor immunology.


Conflict of interest statement

Declaration of interests P.-C.H. is a member of the scientific advisory board for Elixiron Immunotherapeutics and received research grants from Elixiron Immunotherapeutics. P.-C.H. is also a founder of Pilatus Biosciences.

Figures

Figure 1.
Figure 1.. Early-stage T cell-mediated immunosurveillance influences tumor metabolism
(A) Tumor growth curve for KO1, KO3, and KO7, three Braf/Pten melanoma cell lines derived from adaptive immune cell-deficient Braf/Pten mouse, after subcutaneously engrafting into C57BL/6 wild-type mice and Rag1−/− mice (n = 6–7 per group). (B) Tumor growth curve for WT2, WT4, and WT6 cell lines derived from immunocompetent Braf/Pten mouse, after subcutaneously engrafting into C57BL/6 wild-type mice and Rag1−/− mice (n = 6–7 per group). (C and D) Ratios of basal OCR versus ECAR (C) and ATP level (D) of three WT primary melanoma cells and three KO primary melanoma cells. (E) Metabolite set enrichment analysis of Braf/Pten tumors from immunocompetent wild-type background versus matched Rag1-KO background (bottom panel). (F) Experimental outline of antibody-based early T cell depletion in murine Braf/Pten melanomas 2 weeks post-tumor induction with 4-hydroxytamoxifen (4-HT). (G and H) Tumor weight (G) and lactate levels in tumors (H) in Braf/Pten melanomas from control (n = 8–10) and T cell depletion (n = 10) groups. (I) Principal component analysis (PCA) of metabolites in Braf/Pten tumors from control and early T cell depletion (n = 4 per group). (J) Experimental scheme of antibody-based late T cell depletion in murine Braf/Pten melanomas 5 weeks post-tumor induction. (K and L) Tumor weight (K) and lactate levels in tumors (L) in Braf/Pten melanomas from control and late T cell depletion groups (n = 12 per group). (M) PCA of metabolites in Braf/Pten tumors from control and late T cell depletion (n = 4 per group). (N) Metabolite set enrichment analysis of Braf/Pten tumors from early T cell depletion versus matched control groups. (O and P) Volcano plot (O) and PCA plot (P) of differentially accessible genomic regions determined by ATAC sequencing in Braf/Pten melanoma cells isolated from Braf/Pten-mTmG mice treated with PBS (control) or early T cell depletion group. (Q) Enriched transcription factors binding differentially accessible genomic loci in control (Ctrl) or T cell-depleted Braf/Pten melanoma cells. Data are representative or cumulative results of two independent experiments (A–D, G, H, K, and L). Each symbol represents one individual (G, H, K, and L) or the mean of 5 replicates for each treatment (C and D). Data are mean ± SEM and analyzed by unpaired, two-tailed Student’s t test.
Figure 2.
Figure 2.. Early-stage immunosurveillance supports melanomas to dampen T cell anti-tumor immunity
(A and B) Tumor growth (A) and tumor weight (B) of Braf/Pten melanoma tumor from control, continued anti-CD4/8 antibody treatment (Cont. α-CD4/8), or discontinued anti-CD4/8 antibody treatment (Disc. α-CD4/8) groups. (C) Representative histology images for staining of Ki67, senescence-associated β-galactosidase activity (SA-β-gal), apoptotic cells with TUNEL, and p21 in indicated groups. Slides were counterstained with hematoxylin in chromogenic sections, counterstained with nuclear fast red in β-gal assay, and counterstained with DAPI in immunofluorescence staining. Scale bars, 50 μm. (D) Quantitative results of IHC staining from indicated markers in indicated groups. (E) Representative images (left) and quantitative results (right) of CD8+ T cell distribution in the margin region and core region of tumors from indicated Braf/Pten mice. (F–I) Representative plots and quantitative results of Tim3+ PD-1+ CD8+ tumor-infiltrating T cells (F) and IFNγ-producing (G), TNF-α-producing (H), and granzyme B (GzmB)-producing cells (I) among total tumor-infiltrating CD44+ CD8+ T cells from the indicated mice. (J) The heatmap of differentially expressed cytokines in tumors from indicated groups (n = 3 per group) determined by cytokine protein array. Data are the cumulative results from at least two independent experiments (A, B, and F–I). Each symbol represents one individual (B and F–I) or represents the average of positive cell percentage from random 4 field in a section of individual tumor (D and E). Data are means ± SEM and analyzed by two-tailed, unpaired Student’s t test.
Figure 3.
Figure 3.. IFNγ sculpts metabolic state in tumors during immunoediting
(A) Illustration of experimental design of IFNγ neutralization. (B and C) Tumor growth (B) and tumor weight (C) of Braf/Pten melanomas from indicated groups. (D and E) Representative histology images (D) and quantitative results (E) for staining of Ki67, senescence-associated β-galactosidase activity (SA-β-gal), apoptotic cells with TUNEL, p21, and PD-L1 (labeled with Alexa Fluor-488 conjugated secondary antibody) in indicated groups. Slides were counterstained with hematoxylin in chromogenic sections, counterstained with nuclear fast red in β-gal assay, and counterstained with DAPI in immunofluorescence staining. Scale bars, 50 μm. (F–H) Tumor growth curve for KO1 (F), KO3 (G), and KO7 (H), three Braf/Pten melanoma cell lines derived from adaptive immune-cell-deficient Braf/Pten mouse, after subcutaneously engrafting into C57BL/6 wild-type mice and IFNγ−/− mice (n = 6–8 per group). (I) Tumor growth of Braf/Pten melanomas from PBS treatment (Control) and anti-IFNγ mAb treatment group. (J) Metabolite set enrichment analysis of Braf/Pten tumors from anti-IFNγ antibody treatment group versus matched control group. Data are the cumulative results from at least two independent experiments (B and C) or are representative images of two independent experiments with similar results (E–I). Each symbol represents one individual (C) or represents the average of positive percentage from random 4 field in a section of individual tumor (E). Data are means ± SEM and analyzed by two-tailed, unpaired Student’s t test.
Figure 4.
Figure 4.. IFNγ induces metabolic reprogramming in melanoma cells for supporting immune evasion
(A) PCA of transcriptome for WT primary melanoma cells and KO primary melanoma cells. (B) Gene set enrichment analysis showing upregulated expression of genes on IFNγ response and cMyc targets in WT primary melanoma cells compared with KO primary melanoma cells. (C) Significantly enriched transcription factors binding differentially accessible genomic loci in WT primary melanoma cells compared with KO primary melanoma cells. (D and E) Ratios of basal OCR versus ECAR in WT primary melanoma cells (D) and KO primary melanoma cells (E) treated with control vehicle (Ctrl) or IFNγ for 48 h prior to assay (n = 4). (F) Representative kinetic of OCR (left panel) following treatment with oligomycin (2 μM), FCCP (2 μM), etomoxir (40 μM), and antimycin A plus rotenone (0.5 μM each) in KO1 primary melanoma cells. Cells were incubated with control vehicle (Ctrl) or 100 ng mL−1 IFNγ for 48 h prior to assay. Relative etomoxir-sensitive OCR, calculated by measuring the differences of OCR levels between etomoxir and FCCP treatment, in indicated primary melanoma cells treated with control vehicle and IFNγ 48 h prior to assay (right panel) (n ≥ 5 per group). (G) Ratio of basal OCR versus ECAR in parental KO1 and escaped KO1 cells (left panel) and in parental KO7 and escaped KO7 cells (right panel). (H) PCA of metabolites in Braf/Pten tumors from non-escaped and escaped inducible Braf/Pten melanomas upon discontinuation of T cells depletion as illustrated in Figure 3A. (I) Metabolite set enrichment analysis of Braf/Pten melanomas from escaped versus non-escaped tumors. Data are representative results of two independent experiments with similar results (D–G). Each symbol represents one individual. Data are means ± SEM and analyzed by two-tailed, unpaired Student’s t test.
Figure 5.
Figure 5.. IFNγ-STAT3 signal axis promotes cMyc-dependent metabolic reprogramming and resistance to senescence
(A and B) Representative immunoblots (upper panel) of cMyc and β-actin and quantitative analysis of cMyc/β-actin ratios in primary WT melanoma cells (A) and KO melanoma cells (B) treated with or without IFNγ for 16 h. (C) Ratios of basal OCR/EACR in indicated KO cells transfected with short hairpin RNAs targeting scramble sequence (shCtrl) or cMyc sequence (shMyc #1 and shMyc #2). Cells were incubated with or without 100 ng mL−1 IFNγ for 48 h prior to assay. (D) Represented staining of β-gal activity in KO1 cells transfected with short hairpin RNAs targeting scramble sequence (shCtrl) or cMyc sequence (shMyc #1 and shMyc #2) upon exposure with or without IFNγ for 4 days. Scale bars, 50 μm. (E and F) Representative immunoblots (E) and quantitative results (F) of indicated proteins in KO1 cells expressing control short hairpin RNA (shCtrl) or cMyc short hairpin RNAs (shMyc #1, #2) upon exposure with or without IFNγ for 16 h. (G and H) Representative immunoblots (G) and quantitative results (H) of indicated proteins in KO1, KO3, and KO7 cells treated with indicated treatments for 16 h. Stattic: STAT3 inhibitor. (I and J) Representative immunoblots (I) and quantitative results (J) of indicated proteins in WT primary melanoma cells treated with indicated treatments for 16 h. (K) Representative immunoblots of indicated proteins in indicated cell lines with quantitative analysis for STAT1/STAT3 ratios (right panel). (L) Representative immunoblot (upper panel) and quantitative results (bottom panels) for indicated proteins in the primary HCC cells harboring β-catenin overexpression and Pten deletion derived from immunocompetent mice (WT cells) or Rag1−/− mice (KO cells). (M) Representative immunoblots (left panel) and quantitative results (right panels) of indicated proteins in KO cells expressing control gRNA (Ctrl gRNA) or gRNAs targeting STAT1 (STAT1 gRNA) upon exposure with or without IFNγ for 16 h. (N) Representative immunoblots (left panel) and quantitative results (right panels) of indicated proteins in WT cells expressing control gRNA (Ctrl gRNA) or gRNAs targeting STAT1 (STAT1 gRNA) upon exposure with or without IFNγ for 16 h. (O) Illustration of the proposed model. (P) Tumor growth curve for KO1, KO3, and KO7 expressing either control (Ctrl) or c-Myc overexpression vector (Myc_OE) upon subcutaneously engrafted into C57BL/6 wild-type mice (n = 5–8 per group). Data are representative or cumulative results of at least two independent experiments with similar results. Each symbol represents one individual. Data are means ± SEM and analyzed by two-tailed, paired (A and B) or unpaired (C, F, H, and J–N) Student’s t test.
Figure 6.
Figure 6.. In vivo CRISPR screening identifies metabolism pathways regulating the anti-tumor immunity
(A) Diagram of in vivo screening system for metabolism-guided immunoediting. (B) Hits from screen for regulating tumor immunity. The x axis shows the log2 (fold change) comparing gRNA levels of tumors from WT (B6 cas9) with those from Rag1−/− mice, and the y axis denotes the −log10 of p value for differential expression obtained by MAGeCK. (Red symbol represents c-Myc target genes; Ido1, Fasn, and Slc23a2 are highlighted as open circle.) (C) Frequency histograms of enrichment (Z score) for sgRNAs targeting indicated genes. (D) Spearman correlation of Fasn (left) or Slc23a2 (right) expression (Z score) with IFNγ (n = 401 biologically independent melanoma tumor samples from TCGA cohort). (E) Boxplot with Tukey whiskers showing varied Fasn (left) or Slc23a2 (right) expression (Z score) in CD8Ahigh and CD8Alow melanoma patients from TCGA cohort (n = 272). (F and G) Tumor volume for Yumm1.7 tumors with control gRNA or gene deletions as indicated in WT (F) and Rag1−/− mice (G). (H) Population of CD4+ (right) and CD8+ (left) T cells in Fasn-null, Slc23a2-null, or control tumors. (I) Ratio of CD8+ T cells/FoxP3+ Treg in Fasn-null, slc23a2-null, or control tumors. (J–M) Representative plots and percentages of the PD-1+ Tim3+ T cells (J and K) and the TCF1+ Tim3+ T cells (L and M) among total tumor-infiltrating CD44+ CD8+ T cells from the indicated mice. (N and O) Representative plots (N) and percentages (O) of the IFNγ and TNF-α-producing tumor-infiltrating T cells from the indicated tumor samples after ex vivo restimulation with CD3/CD28. Data are the cumulative results from at least two independent experiments (F–O). Each symbol represents one individual. Data are means ± SEM and analyzed by two-tailed, unpaired Student’s t test.

Comment in

References

    1. Hanahan D, and Weinberg RA (2011). Hallmarks of cancer: the next generation. Cell 144, 646–674. 10.1016/j.cell.2011.02.013. - DOI - PubMed
    1. Kim J, and DeBerardinis RJ (2019). Mechanisms and implications of metabolic heterogeneity in cancer. Cell Metab. 30, 434–446. 10.1016/j.cmet.2019.08.013. - DOI - PMC - PubMed
    1. Fendt SM, Frezza C, and Erez A (2020). Targeting metabolic plasticity and flexibility dynamics for cancer therapy. Cancer Discov. 10, 1797–1807. 10.1158/2159-8290.CD-20-0844. - DOI - PMC - PubMed
    1. Ho PC, Bihuniak JD, Macintyre AN, Staron M, Liu X, Amezquita R, Tsui YC, Cui G, Micevic G, Perales JC, et al. (2015). Phosphoenolpyruvate is a metabolic checkpoint of anti-tumor T cell responses. Cell 162, 1217–1228. 10.1016/j.cell.2015.08.012. - DOI - PMC - PubMed
    1. Chang CH, Qiu J, O’Sullivan D, Buck MD, Noguchi T, Curtis JD, Chen Q, Gindin M, Gubin MM, van der Windt GJ, et al. (2015). Metabolic competition in the tumor microenvironment is a driver of cancer progression. Cell 162, 1229–1241. 10.1016/j.cell.2015.08.016. - DOI - PMC - PubMed

Publication types

Substances