. 2023 Jan 3;35(1):166-183.e11.
doi: 10.1016/j.cmet.2022.12.004.

Profiling mouse brown and white adipocytes to identify metabolically relevant small ORFs and functional microproteins

Affiliations

Profiling mouse brown and white adipocytes to identify metabolically relevant small ORFs and functional microproteins

Thomas F Martinez et al. Cell Metab. .

Abstract

Microproteins (MPs) are a potentially rich source of uncharacterized metabolic regulators. Here, we use ribosome profiling (Ribo-seq) to curate 3,877 unannotated MP-encoding small ORFs (smORFs) in primary brown, white, and beige mouse adipocytes. Of these, we validated 85 MPs by proteomics, including 33 circulating MPs in mouse plasma. Analyses of MP-encoding mRNAs under different physiological conditions (high-fat diet) revealed that numerous MPs are regulated in adipose tissue in vivo and are co-expressed with established metabolic genes. Furthermore, Ribo-seq provided evidence for the translation of Gm8773, which encodes a secreted MP that is homologous to human and chicken FAM237B. Gm8773 is highly expressed in the arcuate nucleus of the hypothalamus, and intracerebroventricular administration of recombinant mFAM237B showed orexigenic activity in obese mice. Together, these data highlight the value of this adipocyte MP database in identifying MPs with roles in fundamental metabolic and physiological processes such as feeding.

Keywords: Ribo-seq; brown adipose tissue; data-independent acquisition mass spectrometry; diet-induced obesity; microproteins; ribosome profiling; secreted microproteins; small ORFs; white adipose tissue.


Conflict of interest statement

Declaration of interests All authors affiliated with the Novo Nordisk Research Center Seattle, Inc. have worked for a for-profit commercial pharmaceuticals company that produces and sells medicines for the treatment of obesity and diabetes. B.C.S. is a founder and shareholder of Proteome Software. M.J.M. has a sponsored research agreement with and is a paid consultant for Thermo Fisher Scientific. A. Saghatelian is a paid consultant and shareholder for and cofounder of Exo Therapeutics and Velia Therapeutics. T.F.M. is a paid consultant and shareholder of Velia Therapeutics. C.A.B. is a current employee of Velia Therapeutics.

Figures
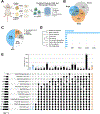
Fig. 1.
Fig. 1.. Ribosome profiling to define primary differentiated white, brown, and beige mouse adipocyte microproteins.
(A) Primary subcutaneous white, beige (from subcutaneous WAT), and brown adipocytes were generated from freshly isolated subcutaneous white adipose tissue (WAT) and brown adipose tissue (BAT). Primary differentiated adipocytes were then analyzed by Ribosome Profiling (Ribo-Seq), leading to the identification of thousands of microprotein-encoding small open reading frames (smORFs) not found in curated databases (UniProt, Refseq, Ensembl). (B) A Venn Diagram of the identified smORF distributions between primary white, beige, and brown adipocytes. (C) Homer analysis of the microprotein-encoding smORF positions was used to estimate numbers of smORFs in non-coding/intergenic regions, those downstream of a CDS (downstream ORF (dORF)/translational termination site (TTS)), intronic regions, antisense RNAs, and upstream of a CDS (upstream ORF (uORF)/translational start site (TSS)). (D) Unrooted phylogenetic tree inferred from the mitochondrial DNA sequences of closely-related species. The bars on the side represent the number of homologous sequences for the novel smORFs that could be found in the transcriptome of the species in the tree with a tBLASTn search. (E) UpSet plot showing the overall tissue distribution of the smORF-containing transcripts (SCTs) in mouse ENCODE samples. Each row in the lower part of the plot represents a different tissue or cell type. The linked dots in these rows represent an intersection of the SCTs for a given sample. For instance, the linked dots in the third column represent SCTs that are expressed only in the lean, DIO, and adrenal gland samples. Blue dots denote a subset of SCTs that are unique to the RNA-Seq datasets generated in this study. Black dots represent subsets of SCTs that are also expressed in the analyzed datasets from the mouse ENCODE project. Orange dots represent a subset of SCTs that are present in every group. The bar plots on the upper part of the plot represent the number of expressed SCTs unique to that subset. Bar plots on the left side of the lower part of the plot denote the number of SCTs with at least 1 TPM that are expressed in a given sample.
Fig. 2.
Fig. 2.. Schematic of Data-independent Acquisition Mass Spectrometry (DIA-MS) method that employs the chromatogram library approach.
An idealized experiment with two groups of six (red and blue) is depicted in the upper left. A small volume of each sample is split and pooled for peptide identification analysis (purple). First, the pool is subjected to high pH reversed-phase (RP) fractionation where peptide identifications are generated from DDA injections of each RP fraction. The Ribo-Seq generated smORF-encoded microprotein sequences are amended to the canonical reviewed UniProt proteome database (blue/grey library icon) where each RP fraction DDA injection is searched (Comet + PeptideProphet) with the results used to make a spectral library of peptide identifications (orange library icon). The pool is also subjected to a small (4 m/z) DIA gas-phase fractionation (GPF) window. The GPF chromatogram library method utilizes 6 replicate injections of the sample pool with small, staggered windows (4 m/z) across a short mass range (100 m/z). Each short mass range injection covers one sixth of the total mass range of the profiling method used on each sample. The profiling method for quantifying each sample uses larger staggered windows (8 m/z) from a mass range of 400–1000 that covers the entire mass range of the GPF injections. The GPF injections are inserted into the randomized queue of individual samples to be quantified, allowing very accurate retention time realignment and improved accuracy in the peptide extractions from the DIA-MS profiling data. EncyclopeDIA is first used to create the chromatogram library (green library icon) that contains all of the DIA-based peptide identifications and accurate retention times. EncyclopeDIA is then used again to extract fragment ion-based peptide information from the profiling injections using the chromatogram library generated from the GPF injections. Extracted ion chromatograms for each peptide are then post-processed in Skyline, allowing for viewing the data, proteome regulation analysis (generation of protein or peptide volcano plots), and exporting the summed peptide fragment ion intensities for each peptide. Multiple peptides per protein can be summed to quantify individual proteins, but the method is also highly accurate on a single peptide level. Box 1 depicts how this methodology is important for smORF-encoded microprotein discovery. Each smORF sequence may only generate a small number of analytical peptides in a tryptic digest (or any given sample prep methodology). In contrast, a canonical ORF may generate many analytical peptides per protein in a tryptic digest.
Fig. 3.
Fig. 3.. DIA-MS quantitation of canonical ORF proteins and small ORF microproteins in primary differentiated brown and subcutaneous white adipocytes.
(A) A schematic of the experimental design quantifies the proteomes of primary differentiated brown and subcutaneous white adipocytes, allowing for identification with DDA and quantification with DIA-MS of canonical ORF proteins smORF-encoded microproteins in whole-cell lysates and conditioned media (secretomes). (B) DIA-MS quantification of canonical ORF proteins UCP1, PLIN1, and GLUT4 from the whole-cell lysates of the same primary differentiated brown and subcutaneous white adipocytes analyzed with Ribo-Seq in Figure 1. (C) DIA-MS quantification of known secreted proteins APOE and ADIPOQ (Adiponectin). (D) Ribo-Seq coverage of a conserved smORF (chr6:148354710–148355199) identified in both primary differentiated subcutaneous white and brown adipocytes (E) DIA-MS quantification of microproteins in the whole-cell lysates and secretomes of both the differentiated brown and subcutaneous white adipocyte cultures showing 4 microproteins quantified in both the whole cell lysates and secretomes that includes microproteins from the smORFs: chr6:148354710–148355199 (seen in panel E Ribo-Seq); chr1:156615947–156616057; chr2:129306194–129306639; and chr2:6872358–6872429. (scale bar = 25 μm in Panel A, statistics performed with paired t-test where * = p-value < 0.05, ** = p-value < 0.01, and *** = p-value < 0.001).
Fig. 4.
Fig. 4.. Adipose protein-coding smORFs are differentially transcribed in diet-induced obese mice.
(A) Representation of human and mouse PTEN and PPAR-δ mRNAs, with uORFs in red and mORFs in blue, as well as the translation of the 5’-UTRs to reveal MPs above the mRNAs. With PPAR-δ, the presence of non-conserved uORFs in mice and humans supports a role for uORFs in translational regulation of PPAR-δ, but the lack of conservation makes it unlikely that the MPs from these uORFs are functional. By contrast, the uORFs from PTEN can regulate PTEN translation, but are also very likely to be functional in their own right because of the strong conservation between mouse and human PTEN uORF MPs. Thus, non-sequence conserved uORFs could still reveal post-transcriptional regulation across evolution. (B) Changes in RNA expression for adipose protein-coding smORFs induced by DIO in various tissues (padj < 0.05 and |log2 fold change| ≥ 1). (C) PCA analysis of non-uORF protein-coding smORF RNA expression levels in tissues derived from DIO and lean mice.
Fig. 5.
Fig. 5.. Adipose protein-coding smORFs are located throughout the genome and can be co-expressed with important lipid metabolism regulators.
(A) Circular genome plot showing the genomic landscape of the novel smORFs. The annotated genes are represented as red bars in the outermost section, while the smORFs are depicted as purple bars in the second section. The third ring depicts the smORFs with a positive transmembrane prediction from TMHMM. The fourth ring summarizes the PhyloCSF information, with peaks representing positive PhyloCSF scores. The bars in the fifth ring represent the presence of homologous sequences in human identified with tBLASTn for the smORF in the same coordinates. The sixth ring represents smORFS with a positive signal peptide from either of Signal P 5.0 or Phobius or both. The center of the plot contains links illustrating the co-expression between one of the top 10 ranked SCTs in the network and another gene. (B) Network showing co-expression of smORFs with genes whose functions are related to lipid metabolism. Cyan diamonds represent a smORF, and yellow circles represent an annotated gene. Edges correspond to a correlation between the expression levels of two different nodes across multiple conditions.
Fig. 6.
Fig. 6.. Plasma proteomics of aged obese mice identifies evidence for multiple smORF-encoded microproteins with one FRS2 uORF circulating at a higher level in the aged obese state
(A) Experimental design for plasma proteomics of 26-week and 41-week old mice with both DIO and lean groups in both ages (n=12 per group). (B) Strategy for non-quantitative DDA-based deep identification of canonical ORF proteins and smORF-encoded microproteins in lean mouse plasma shows a combinatorial fractionation strategy designed to enrich small proteins using both C8 and C18 based fractionation with both trifluoroacetic acid (TFA) and triethylammonium formate (TEAF) ion-pairing agents. Additionally, plasma from the experiment depicted in Panel A was fractionated (not pictured) with high pH RP fractionation as depicted in Figure 2. (C) Summary of all proteins identified with the fractionation strategies outlined in Panel B showing peptides and proteins identified from both the canonical ORFs and smORF-encoded microproteins. (D) Annotated MS2 fragment ion spectrum of a peptide (VFC*HQANDVHIYQTQVVMTNTLETSSGK++++, *=reduced and alkylated cysteine) that maps to a microprotein generated from the lincRNA AW112010 (chr19:11047983–11050396) discovered in the circulation via the plasma fractionation depicted in Panel B. The peptide is depicted in a butterfly plot with the measured MS2 spectrum above the x-axis and the Prosit-predicted fragment ion pattern below the x-axis (E) Volcano plot of DIA-MS quantification of the experiments depicted in Panel A comparing the DIO old condition to the lean old condition depicting regulated canonical ORF proteins along with a regulated smORF-encoded microprotein that correlates to chr10:117081098–117085087. (F) Quantification with DIA-MS of a tryptic peptide (sequence: MINLLMQHQR++) for the smORF-encoded microprotein from chr10:117081098–117085087 across all of the biological conditions in Panel A. (G) The amino acid sequence of the smORF-encoded microprotein from chr10:117081098–117085087 that maps to the uORF region of fibroblast receptor substrate 2 (FRS2) with the identified tryptic peptide (sequence: MINLLMQHQR) depicted in yellow and the whole smORF in blue/yellow. (H) Annotated MS2 fragment ion spectrum of the tryptic peptide from the FRS2 uORF (sequence: MINLLMQHQR++) was used to quantify this microprotein in Panels E and F with DIA-MS. (statistics performed with one-way ANOVA where **** = p-value < 0.0001).
Fig. 7.
Fig. 7.. Translation, expression, and activity of Gm8773.
(A) Ribo-Seq evidence for the translation of Gm8773 in both differentiated subcutaneous white and brown adipocytes. (B) Amino acid level conservation of the predicted protein sequence of Gm8773 along with the two residues that have a positive O-linked glycosylation prediction score (NetOGlyc 4.0). (C) Signal peptide (Signal P 5.0) and transmembrane domain (TMHMM 2.0) predictions for Gm8773 predicted protein sequence. (D) Replotting of published transcriptional co-expression data of Gm8773 expression within specific nuclei of the hypothalamus and other regions of the brain; Note Gm8773 co-expressed with NPY containing neurons (E) Relative comparative tissue level mRNA expression with qPCR of Gm8773 across a panel of mouse tissues. (F) In situ hybridization of Gm8773 mRNA localization to the arcuate nucleus of the hypothalamus, showing (D.i), the arcuate nucleus and median eminence (D.ii), and arrows denoting mGm8773+ cells in the mediobasal hypothalamus. Scale bars = 500 μm (D.i), 250 μm (D.ii), 50 μm (D.iii). (G) Expression of recombinant Gm8773 in HEK cells showing a double band at the molecular weight of a protein monomer in both reducing and non-reducing conditions (left side) along with the collapsing of the Gm8773 doublet protein band down to a single band upon treatment with an O-linked glycosylation deglycosylating enzyme (right side). (H) Increased food intake is observed in mice following the intracerebroventricular (ICV injection) administration of the recombinant Gm8773 protein from Panel G (statistics performed with two-way ANOVA with significant time by treatment interaction where **** = p-value < 0.0001).

References

    1. Chen J, Brunner A-D, Cogan JZ, Nuñez JK, Fields AP, Adamson B, Itzhak DN, Li JY, Mann M, Leonetti MD, et al. (2020). Pervasive functional translation of noncanonical human open reading frames. Science 367, 1140–1146. - PMC - PubMed
    1. Ingolia NT, Ghaemmaghami S, Newman JRS, and Weissman JS (2009). Genome-Wide Analysis in Vivo of Translation with Nucleotide Resolution Using Ribosome Profiling. Science 324, 218–223. - PMC - PubMed
    1. Ingolia NT, Lareau LF, and Weissman JS (2011). Ribosome profiling of mouse embryonic stem cells reveals the complexity and dynamics of mammalian proteomes. Cell 147, 789–802. - PMC - PubMed
    1. Martinez TF, Chu Q, Donaldson C, Tan D, Shokhirev MN, and Saghatelian A (2020). Accurate annotation of human protein-coding small open reading frames. Nat Chem Biol 16, 458–468. - PMC - PubMed
    1. Slavoff SA, Mitchell AJ, Schwaid AG, Cabili MN, Ma J, Levin JZ, Karger AD, Budnik BA, Rinn JL, and Saghatelian A (2013). Peptidomic discovery of short open reading frame–encoded peptides in human cells. Nat. Chem. Biol 9, 59–64. - PMC - PubMed

Publication types