. 2023 Jan 17;4(1):100878.
doi: 10.1016/j.xcrm.2022.100878. Epub 2023 Jan 3.

CD8+ T cell-intrinsic IL-6 signaling promotes resistance to anti-PD-L1 immunotherapy

Affiliations

CD8+ T cell-intrinsic IL-6 signaling promotes resistance to anti-PD-L1 immunotherapy

Mahrukh A Huseni et al. Cell Rep Med. .

Abstract

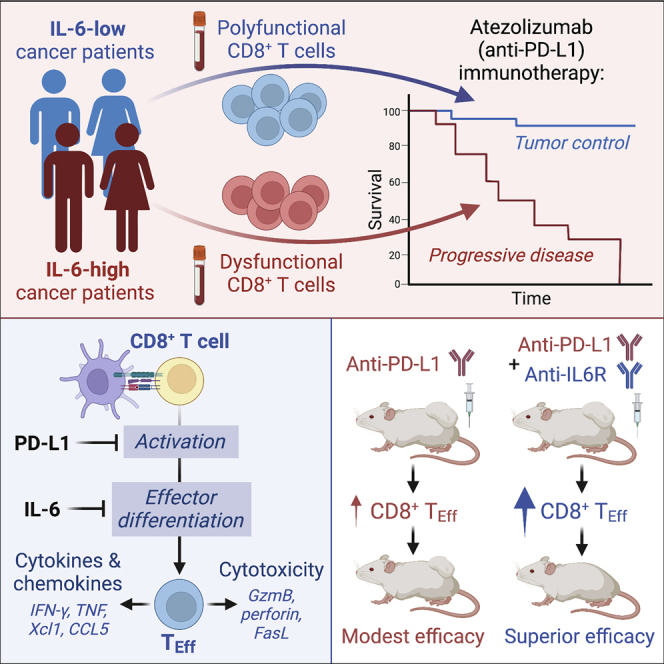
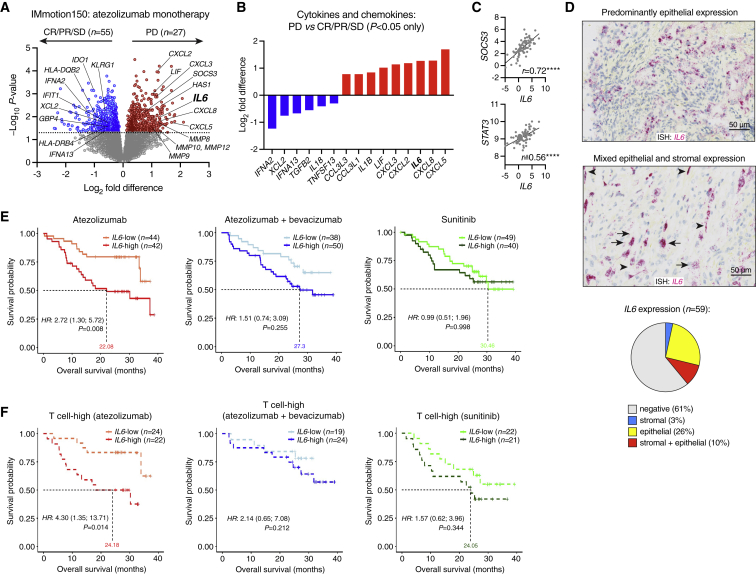
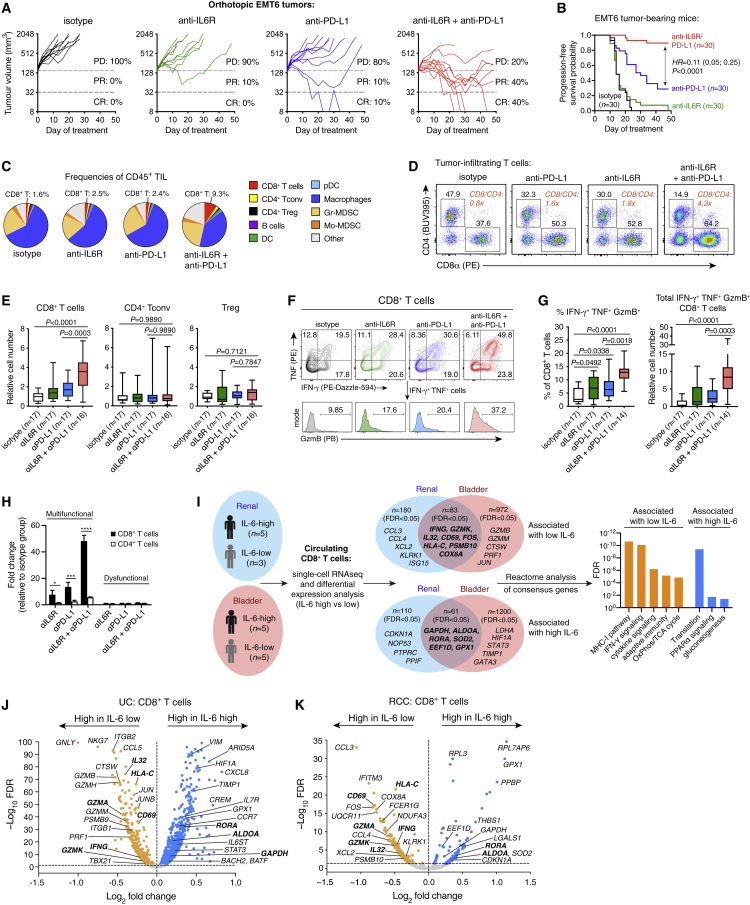
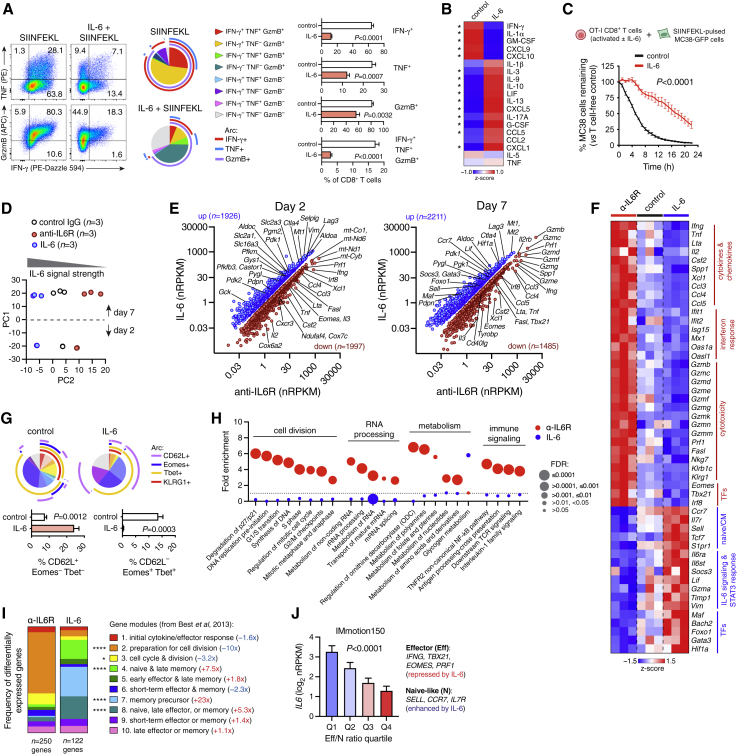
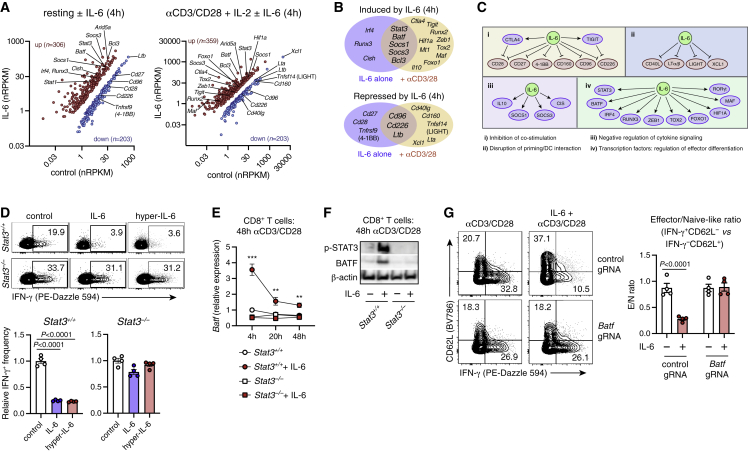
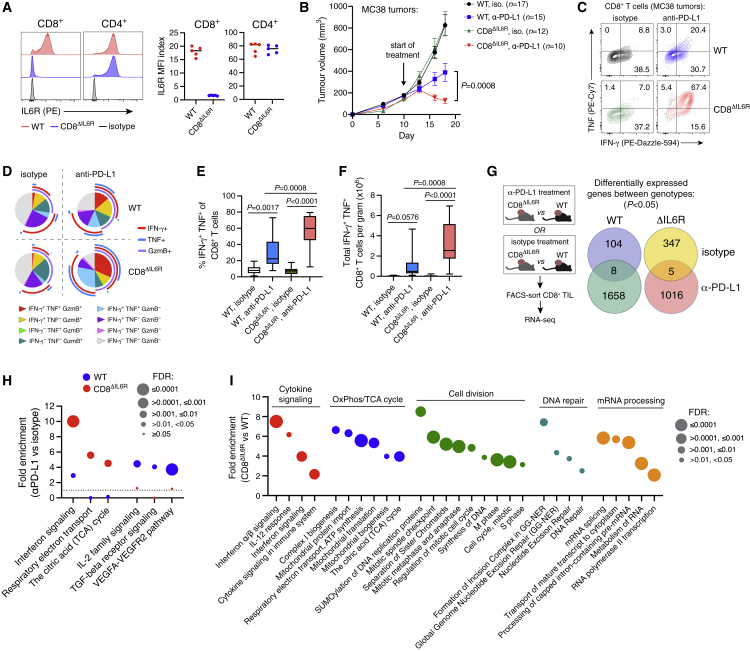
Although immune checkpoint inhibitors (ICIs) are established as effective cancer therapies, overcoming therapeutic resistance remains a critical challenge. Here we identify interleukin 6 (IL-6) as a correlate of poor response to atezolizumab (anti-PD-L1) in large clinical trials of advanced kidney, breast, and bladder cancers. In pre-clinical models, combined blockade of PD-L1 and the IL-6 receptor (IL6R) causes synergistic regression of large established tumors and substantially improves anti-tumor CD8+ cytotoxic T lymphocyte (CTL) responses compared with anti-PD-L1 alone. Circulating CTLs from cancer patients with high plasma IL-6 display a repressed functional profile based on single-cell RNA sequencing, and IL-6-STAT3 signaling inhibits classical cytotoxic differentiation of CTLs in vitro. In tumor-bearing mice, CTL-specific IL6R deficiency is sufficient to improve anti-PD-L1 activity. Thus, based on both clinical and experimental evidence, agents targeting IL-6 signaling are plausible partners for combination with ICIs in cancer patients.

Keywords: CD8 T cell; IL-6; PD-L1; atezolizumab; cancer; checkpoint blockade immunotherapy; clinical trial; interleukin 6.


Conflict of interest statement

Declaration of interests M.A.H., K.Y., L.W., J.E.K., L.L., Y.L., V.G., C.L., D.R., C.O., S.M., S.K., Y.J.C., J.P., Y.S., Z.M., B.B., E.J.F., N.L., H.K., J.Z., M.F., P.W., M.W., I.M., S.J.T., M.M., S.M., L.M., and N.R.W. are employees of Genentech, Inc. M.A.H., K.Y., L.W., J.E.K., L.L., Y.L., P.W., M.M., S.M., L.M., and N.R.W. are inventors on patents related to IL-6. P.S.H. is an employee of Foundation Medicine Inc. K.H. is an employee of Roche Products Ltd. D.F.M. reports a consulting/advisory role for Bristol-Myers Squibb, Merck, Roche/Genentech, Pfizer, Exelixis, Novartis, Eisai, X4 Pharmaceuticals, and Array BioPharma; he also reports that his home institution receives research funding from Prometheus Laboratories. T.P. reports honoraria and consulting/advisory roles with Roche/Genentech, Bristol-Myers Squibb, and Merck; consulting/advisory role with AstraZeneca and Novartis; research funding from AstraZeneca/MedImmune and Roche/Genentech; and other relationships with Ipsen and Bristol-Myers Squibb. L.E. reports honoraria from or consulting/advisory roles with AbbVie, Amgen, AstraZeneca, Bayer, Bristol Meyers Squibb, Celgene, Chugai, eTHeRNA, Genentech, Gritstone, Medimmune, Molecuvax, Macrogenics, Novartis, Peregrine, Replimune, Roche, Silverback, Syndax, and Vaccinex; she reports that her home institution receives funding from Aduro Biotech, AstraZeneca, Breast Cancer Research Foundation, Bristol Meyers Squibb, Corvus, Department of Defense, EMD Serono, Genentech, HeritX, Inc., Maxcyte, Merck, National Cancer Institute, NSABP Foundation, Roche, Tempest, Translational Breast Cancer Research Consortium. J.E.R. has received non-financial support from Roche Genentech and consulting fees from Agensys, Eli Lilly, Sanofi, and Oncogene.

Figures

None
Graphical abstract
Figure 1
Figure 1
IL6 expression associates with poor clinical outcome in atezolizumab-treated patients with metastatic RCC (A–C) RNA-seq analysis of pre-treatment tumor samples from the atezolizumab monotherapy arm of IMmotion150. (A) Differential gene expression analysis (Limma-voom), comparing PD (progressive disease) versus SD (stable disease), PR (partial response), or CR (complete response). Nominal p values are shown. (B) Differentially expressed cytokine and chemokine genes. (C) Pearson correlation of IL6 with SOCS3 and STAT3. ∗∗∗∗p < 0.0001. (D) ISH analysis of IL6 mRNA in RCC tumors from IMmotion150 (n = 59). Black arrows, epithelial cell expression; arrowheads, stromal cell expression. Scale bar, 50 μm. Pie chart: proportions of tumors with IL6 expression (staining in ≥1% of cells) in epithelial cells only (yellow), stromal cells only (blue), or both epithelial and stromal cells (red). (E) Association of tumor IL6 mRNA with overall survival (OS) in IMmotion150. (F) Association of tumor IL6 mRNA with OS in patients with high intratumoral T cell signature expression (>median). In (E) and (F), HR (+/− 95% CI) and p values were adjusted after multivariate analysis including the following co-variates: MSKCC (Memorial Sloan Kettering Cancer Center) prognostic risk score, previous nephrectomy, and liver metastasis.
Figure 2
Figure 2
IL-6 inhibits anti-PD-L1 efficacy and anti-tumor CTL response (A–H) Treatment of EMT6 tumor-bearing mice with antibodies targeting PD-L1 and/or IL6R. (A) Individual tumor growth curves (n = 10 per group) from one of three independent studies. PD, progressive disease; PR, partial response; CR, complete response. (B) Progression-free survival (time to 5x increase in tumor volume) of mice pooled from three independent studies, analyzed using log rank test. (C) Cellular composition of CD45+ tumor-infiltrating leukocytes, from one of three experiments. (D) Balance of CD4+ and CD8+ T cells (CTLs) among total TCRβ+ tumor-infiltrating T cells. Data are concatenated from n = 5 mice per group, from one of three studies. (E) Relative abundance (normalized to tumor weight) of CTLs, conventional CD4+ T cells, and regulatory (CD4+ Foxp3+) T cells in EMT6 tumors, pooled from three experiments. Groups compared using one-way ANOVA with Holm-Sidak’s multiple comparisons test. (F) Effector phenotype of tumor-infiltrating CTLs after re-stimulation with PMA/ionomycin. (G) Frequencies of polyfunctional cells among tumor-infiltrating CTLs (left panel), and their absolute abundance relative to isotype control (right panel). Data pooled from three experiments. Groups compared using one-way ANOVA with Holm-Sidak’s multiple comparisons test. (H) Relative abundance (mean ± SEM) of polyfunctional CTLs and IFN-γ+TNF+ CD4+ T cells (multifunctional cells) vs. dysfunctional cells (IFN-γ TNF GzmB CD8+ T cells, or IFN-γ TNF CD4+ T cells), from one of three experiments with n = 3–5 per group. Groups compared using one-way ANOVA with Holm-Sidak’s multiple comparisons test. ∗p = 0.0143, ∗∗∗p = 0.0001, ∗∗∗∗p < 0.0001. (I–K) Single-cell RNA-seq analysis of pre-treatment peripheral blood CD8+ T cells from patients with RCC (from IMmotion150) or UC (from IMvigor210). Differential expression analysis was performed on CD8+ T cells from patients with high (>10 pg/mL) versus low plasma IL-6 (separate analyses for each cancer type). Genes identified as concordant in both cohorts (“consensus genes”) were evaluated for Reactome pathway enrichment (I). Volcano plots of differential gene expression are shown for UC and RCC samples in (J) and (K), respectively.
Figure 3
Figure 3
IL-6 blocks CTL effector differentiation (A) Splenocytes from OT-I mice were stimulated with SIINFEKL peptide +/− IL-6 and analyzed by flow cytometry on day 7. Boolean analysis of IFN-γ, TNF, and GzmB expression in CTLs is shown. Groups (mean +/− SEM of n = 4 technical replicates) were compared by t test and represent one of three independent experiments. (B) Cytokine secretion (measured by Luminex multiplex assay) by FACS-purified CTLs activated with anti-CD3/CD28 +/− IL-6 for 3 days ∗p < 0.05 (t test; n = 3 technical replicates per condition). (C) OT-I CTLs were activated as described in (A) and co-cultured with SIINFEKL-pulsed MC38.GFP cells at a 5:1 effector/target ratio. MC38 destruction was quantified using Incucyte live-cell imaging. Groups compared using two-way ANOVA (n = 4 technical replicates per condition); data indicate mean ± SEM, and are representative of three independent experiments. (D–I) OT-I splenocytes activated with SIINFEKL peptide in the presence of IL-6, control IgG, or anti-IL6R antibody. CTLs were FACS-purified for RNA-seq analysis after 2 and 7 days (n = 3 technical replicates per condition/time point). Principal components analysis (PCA) is shown in (D). (E) Differentially expressed genes (FDR <0.05 and absolute fold change >1.5). (F) Heatmap of representative differentially expressed genes (day 7). (G) Boolean flow cytometry analysis of OT-I CTLs at day 7. Groups (mean +/− SEM of n = 4 technical replicates) compared using t tests, from one of three independent experiments. (H) Reactome pathway analysis of differentially expressed genes between IL-6- and anti-IL6R-treated cells at day 7. (I) Distribution of differentially expressed genes (day 7) among differentiation modules from Best et al. ∗p = 0.0239, ∗∗∗∗p < 0.0001 (Fisher’s exact test). Fold differences refer to IL-6 versus anti-IL6R treatment. (J) Tumor RNA-seq analysis from IMmotion150. Gene modules (average Z scores) associated with effector or naive-like CTLs were used to calculate an effector/naive-like (Eff/N) ratio. IL6 expression across Eff/N quartiles (mean +/− SEM, n = 65–66 per group) was compared using one-way ANOVA.
Figure 4
Figure 4
IL-6 regulates CTLs via STAT3-dependent BATF induction (A–C) RNA-seq analysis of WT naive CTLs stimulated with IL-6 +/− anti-CD3/CD28 antibodies for 4 h. (A) Differentially expressed genes (FDR <0.05 and absolute fold change >2). (B) IL-6-regulated genes with potential roles in CTL differentiation, and their functional categorization (C). (D) IFN-γ expression in WT or STAT3.ko CTLs (from CD4-Cre x Il6rloxP/loxP mice) activated with anti-CD3/CD28 +/− IL-6 or hyper-IL-6 for 3 days. Groups (mean ± SEM of n = 4 technical replicates) compared by t test; data representative of three independent experiments. (E) Batf mRNA expression (qRT-PCR) in WT or STAT3.ko CTLs activated +/− IL-6. ∗∗p < 0.01, ∗∗∗p < 0.001 (WT vs. STAT3.ko; t tests). Data points indicate mean +/− SEM of n = 4 technical replicates, from one of two independent experiments. (F) Western blot of BATF and p-STAT3 (Y705) in activated WT or STAT3.ko CTLs. Data represent one of two independent experiments. (G) BATF CRISPR-ko or control CTLs were activated +/− IL-6 and analyzed on day 3 (groups compared by t test; mean ± SEM of n = 4 technical replicates). Data representative of two independent experiments.
Figure 5
Figure 5
CTL-intrinsic IL-6 signaling impairs anti-PD-L1 efficacy (A) IL6R expression on lymph node T cells from CD8ΔIL6R mice or WT littermate controls (n = 5 mice per group). (B) Tumor growth (mean +/− SEM) in CD8ΔIL6R mice and WT littermates treated with anti-PD-L1 or control antibodies, pooled from two independent studies and compared using two-way ANOVA. (C–F) Cytokine expression in tumor-infiltrating CTLs after 1 week of treatment. Representative staining and Boolean analysis are shown in (C) and (D), respectively. Frequencies of IFN-γ+ TNF+ cells among tumor-infiltrating CTLs (E), and their absolute number (F), compared using one-way ANOVA with Holm-Sidak’s multiple comparisons test (n = 9–12 mice per group). Data pooled from two independent studies. (G–I) RNA-seq analysis of FACS-purified tumor-infiltrating CTLs from CD8ΔIL6R mice or WT littermates. Mice with established MC38 tumors (∼150 mm3) were treated with anti-PD-L1 or control antibodies for 7 days (n = 4–5 mice per group). (G) Differentially expressed genes between WT and CD8ΔIL6R CTLs. Separate comparisons were made based on treatment. (H) Reactome pathway analysis of anti-PD-L1-driven protein-coding genes (p < 0.05) in WT and CD8ΔIL6R CTLs. (I) Reactome pathway analysis of the top 500 protein-coding genes (ranked by p value) that were significantly associated with CD8ΔIL6R CTLs during anti-PD-L1 treatment.

Comment in

References

    1. Morad G., Helmink B.A., Sharma P., Wargo J.A. Hallmarks of response, resistance, and toxicity to immune checkpoint blockade. Cell. 2021;184:5309–5337. doi: 10.1016/j.cell.2021.09.020. - DOI - PMC - PubMed
    1. Hunter C.A., Jones S.A. IL-6 as a keystone cytokine in health and disease. Nat. Immunol. 2015;16:448–457. doi: 10.1038/ni.3153. - DOI - PubMed
    1. Schaper F., Rose-John S. Interleukin-6: biology, signaling and strategies of blockade. Cytokine Growth Factor Rev. 2015;26:475–487. doi: 10.1016/j.cytogfr.2015.07.004. - DOI - PubMed
    1. Jones S.A., Jenkins B.J. Recent insights into targeting the IL-6 cytokine family in inflammatory diseases and cancer. Nat. Rev. Immunol. 2018;18:773–789. doi: 10.1038/s41577-018-0066-7. - DOI - PubMed
    1. Tsukamoto H., Fujieda K., Miyashita A., Fukushima S., Ikeda T., Kubo Y., Senju S., Ihn H., Nishimura Y., Oshiumi H. Combined blockade of IL6 and PD-1/PD-L1 signaling abrogates mutual regulation of their immunosuppressive effects in the tumor microenvironment. Cancer Res. 2018;78:5011–5022. doi: 10.1158/0008-5472.CAN-18-0118. - DOI - PubMed

Publication types