. 2023 Feb;614(7947):326-333.
doi: 10.1038/s41586-022-05613-0. Epub 2023 Jan 4.

Identification of astrocyte regulators by nucleic acid cytometry

Affiliations

Identification of astrocyte regulators by nucleic acid cytometry

Iain C Clark et al. Nature. 2023 Feb.

Abstract

Multiple sclerosis is a chronic inflammatory disease of the central nervous system1. Astrocytes are heterogeneous glial cells that are resident in the central nervous system and participate in the pathogenesis of multiple sclerosis and its model experimental autoimmune encephalomyelitis2,3. However, few unique surface markers are available for the isolation of astrocyte subsets, preventing their analysis and the identification of candidate therapeutic targets; these limitations are further amplified by the rarity of pathogenic astrocytes. Here, to address these challenges, we developed focused interrogation of cells by nucleic acid detection and sequencing (FIND-seq), a high-throughput microfluidic cytometry method that combines encapsulation of cells in droplets, PCR-based detection of target nucleic acids and droplet sorting to enable in-depth transcriptomic analyses of cells of interest at single-cell resolution. We applied FIND-seq to study the regulation of astrocytes characterized by the splicing-driven activation of the transcription factor XBP1, which promotes disease pathology in multiple sclerosis and experimental autoimmune encephalomyelitis4. Using FIND-seq in combination with conditional-knockout mice, in vivo CRISPR-Cas9-driven genetic perturbation studies and bulk and single-cell RNA sequencing analyses of samples from mouse experimental autoimmune encephalomyelitis and humans with multiple sclerosis, we identified a new role for the nuclear receptor NR3C2 and its corepressor NCOR2 in limiting XBP1-driven pathogenic astrocyte responses. In summary, we used FIND-seq to identify a therapeutically targetable mechanism that limits XBP1-driven pathogenic astrocyte responses. FIND-seq enables the investigation of previously inaccessible cells, including rare cell subsets defined by unique gene expression signatures or other nucleic acid markers.


Conflict of interest statement

Competing interests The authors declare no competing interests.

Figures

Extended Data Fig. 1 |
Extended Data Fig. 1 |. Analysis of rare cells by FIND-seq.
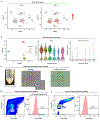
(a) Featureplots of Aqp4 and Edem1 expression in cells isolated from the mouse CNS during EAE reanalyzed from ref.. (b) Violin plots of Aqp4 and Edem1 by cluster from astrocytes isolated from the EAE CNS in a dataset re-analyzed from ref. . (c) Micrograph images of agarose beads containing captured nucleic acids from encapsulated cells. (d) Droplet cytometry plots showing an estimate of the number of cells captured (>1 million) in the bead volume shown in (c). (e) Negative control of droplet cytometry SYBR fluorescence.
Extended Data Fig. 2 |
Extended Data Fig. 2 |. Droplet formation and capture of mRNA by FIND-seq.
(a) Schematic of bubble trigger device that drives air-triggered droplet formation during cell encapsulation. (b) Air-triggered droplet formation enables kHz generation of beads from viscous molten agarose. Images from time-lapse videos of agarose jet breakup. (c) Functionalization of agarose with allyl groups is used to directly link acrydited primers. (d) Microscope images demonstrating successful conjugation of polyT primers to agarose with polyA-FAM probes. (e) Quantification of agarose-bound polyT.
Extended Data Fig. 3 |
Extended Data Fig. 3 |. Optimization of first-strand synthesis of agarose captured mRNA.
(a) Steric capture of cellular genomic DNA inside the agarose matrix. Left: brightfield image of agarose gels. Right: SYBR green fluorescence of stained genomes inside agarose gels. Cells are loaded at limiting dilution to ensure single-cell encapsulation; approximately one in every ten agarose hydrogels contains a cell. (b) Estimated number of cells per drop based on Poisson statistics for microfluidic loading during FIND-seq. (c) Quantification of live cells by flow cytometry using AmCyan live/dead cell dye. n = 4 mice. (d) Whole transcriptome amplification (WTA) of cDNA covalently attached to agarose beads shows full length material is captured and reverse transcribed. (e) WTA yield as a function of PCR cycle number. (f) Optimization of cDNA capture with buffer composition, enzyme, template switch oligonucleotide concentration and additives (6 mM Mg2+, 1M betaine, and 7.5% PEG-8000). (g) Quantification of the percent mitochondrial reads in bulk FIND-seq data for each replicate. n = 22 samples. (h) Calculation of score per cell from astrocytes derived from scRNA-seq from ref. or each bulk FIND-seq replicate for the pathway GOBP: Execution phase of apoptosis (GO: 0097194).
Extended Data Fig. 4 |
Extended Data Fig. 4 |. Agarose bead re-injection and sorting for single-cell detection of nucleic acid markers.
(a) Schematic of microfluidic for re-injection of agarose-captured genomes. (b) Microscope image of single agarose hydrogel beads inside droplets with measured size for each droplet and agarose sphere. (c) Optimization of droplet detection PCR to preserve cDNA quality during thermocycling. (d) Detection of a single-copy HIV genomic DNA target by FIND-seq in infected human JLat cells, but not in uninfected Jurkat control cells, as a proof-of-concept experiment testing FIND-seq sensitivity and specificity. The DNA target was amplified using TaqMan PCR in the FIND-seq workflow (Step 3 in Fig. 1d) followed by detection by droplet cytometry (Step 4 in Fig. 1f). (e) Schematic of microfluidic for droplet sorting using a concentric dielectrophoretic design. (f) Micrographs of droplet sorting. Top: time-lapse images from a droplet sorting video showing droplet deflection into the collection channel. Bottom: In the absence of FPGA sort-triggering, droplets are maintained, via bias oil flow, in the outer waste channel.
Extended Data Fig. 5 |
Extended Data Fig. 5 |. Benchmarking FIND-seq as a technology.
(a) Quantification of percent aquaporin-4-expressing cells in naïve mice by antibody-based flow cytometry (n = 4); FIND-seq (n = 3), or scRNA-seq reanalyzed from ref. . (b) Validation of FIND-seq specificity and sensitivity through the analysis of AQP4+ and AQP4− cells isolated by flow cytometry and subjected to FIND-seq. Percentages show number of cells expressing Aqp4 in each population based on 70% bead loading. (c) PCA plot of bulk FIND-seq analysis of Aqp4+Edem1− cells. (d) Comparison of FIND-seq detection sensitivity with comparable technologies. (e) Correlation of raw expression counts per gene between bulk FIND-seq-sorted Aqp4+Edem1+ cells and Edem1+ astrocytes extracted from droplet-based scRNA-seq data that we previously reported in. (f) Quantification of fraction of duplicate reads across bulk RNA-seq platforms. (g) Quantification of Ern1 in bulk FIND-seq data as a function of EAE and Edem1 expression. (h) Calculation of a signature score for transcripts enriched in astrocyte endfeet as reported by ref. , analyzed in astrocytes from ref. and bulk FIND-seq.
Extended Data Fig. 6 |
Extended Data Fig. 6 |. Single-cell analysis by FIND-seq.
(a) Visualization of a single droplet in flat-bottom microwell plates. Refraction of light at well edges obscures imaging. This is solved by sorting directly into hexadecane. HFE oil sinks, forming a convex shape that forces droplets to the center so that they can be imaged. (b) The percentage of reads mapping to mouse or human cells after single-cell sorting cell mixtures. Mouse (3T3) and human (JLat) cells were mixed 1:100, sorted based on a TaqMan PCR targeting JLat cells, and the transcriptome was sequenced. (c) Quality control analyses for scFIND-seq. (d) Marker genes of Aqp4+Edem1+/− cells from naïve or EAE mice analyzed by scFIND-seq. (e) Elbow plot of principal components detected by scFIND-seq.
Extended Data Fig. 7 |
Extended Data Fig. 7 |. In vivo screening of FIND-seq-identified candidate regulators of XBP1+ astrocytes.
(a) Predicted upstream regulator analysis showing Nr3c2 and Xbp1 from bulk FIND-seq data using Qiagen IPA. Differentially expressed genes were used as input and the overlap with the regulon controlled by each molecule was computed. Fisher’s exact test. (b) Left: Prediction of Nr3c2 as an upstream regulator in Aqp4+Edem1+ cells analyzed by FIND-seq during EAE using Qiagen IPA as in (a). Fisher’s exact test. Right: Identification of an NR3C2 motif by SeqPos in genes downregulated in Aqp4+Edem1+ versus Aqp4+Edem1− cells in EAE. (c) UMAP plot of Aqp4+Edem1+ cells from EAE mice analyzed by scFIND-seq. (de) Prediction of upstream regulators (d) and pathway analysis (e) based on Qiagen IPA in Cluster 1 astrocytes analyzed from Aqp4+Edem1+ cells in EAE mice shown in (c). Fisher’s exact test. (f) Schematic of lentiviral vector containing a sgRNA targeting candidate genes and spCas9 under the control of a Gfap promoter. EAE disease progression in mice transduced with sgScrmbl and candidate sgRNA lentiviruses. n = 4–5 mice per condition.
Extended Data Fig. 8 |
Extended Data Fig. 8 |. Control analyses of Nr3c2 and Ncor2 knockdown.
(a) Left: Upstream regulator analysis of RNA-seq data by Qiagen IPA from sgNr3c2-targeted versus sgScrmble-targeted mice shows NR3C2 downregulation. Fisher’s exact test. Right: Validation of NR3C2 knockdown by immunostaining quantification. n = 6 images per group from n = 3 mice. Unpaired two-sided t-test. (bc) FACS analysis of total CD4+ cells or FoxP3+, IFN𝛾+, IL17+, and IL10+ CD4 cell subsets in the (b) the spleen and (c) CNS. (d) Validation of NCOR2 knockdown by immunostaining. n = 6 images per group from n = 3 mice. Unpaired two-sided t-test. (ef) FACS analysis of total CD4+ cells or FoxP3+, IFNγ +, IL17+, and GM-CSF+ CD4 cell subsets in the (e) the spleen and (f) CNS.
Extended Data Fig. 9 |
Extended Data Fig. 9 |. Control analysis of cell subsets from Xbp1WT and Xbp1Astro mice.
(a) FACS analysis of astrocytes and microglia in the CNS. n = 3 per group. (b) Validation of XBP1 KO by immunostaining. n = 6 images from n = 3 mice per group. Unpaired two-sided t-test. (cd) FACS analysis of total CD4+ cells or FoxP3+, IFN𝛾+, and GM-CSF+ CD4+ T cell subsets from the (c) the spleen and (d) CNS of Xbp1WT and Xbp1Astro mice. (e) Pathways analyzed by pre-ranked gene set enrichment analysis (GSEA) of genes from RNA-seq data comparing Xbp1WT and Xbp1Astro mice.
Extended Data Fig. 10 |
Extended Data Fig. 10 |. Analysis of chromatin accessibility in genes responsive to mineralocorticoid signaling as a function of XBP1 expression in astrocytes.
(ab) Re-analysis of ATAC-seq data on bulk flow cytometry-sorted astrocytes that we reported in ref. , showing increased chromatin accessibility in NR3C2 responsive genes (a) and in Nr3c2 and Ncor2 (b) as a function of Gfap-specific shRNA-driven lentiviral knockdown of Xbp1.
Fig. 1 |
Fig. 1 |. Development of FIND-seq to study rare astrocyte subsets.
a, Left, clustering of scRNA-seq data from the CNS of EAE mice (re-analysed from ref. ). Right, extraction and re-clustering of EAE astrocytes showing Aqp4 and Edem1 expression superimposed on all clusters. b, Schematic of air-triggered droplet generation of molten agarose functionalized with polyT oligonucleotides (step 1). c, Micrographs of cells encapsulated in molten agarose droplets. d, Schematic of reverse transcription of cDNA on agarose beads (left, step 2) followed by agarose bead re-injection for digital PCR detection (right, step 3). e, Bead re-injection. Bottom left, micrographs of agarose hydrogel beads after solidification and removal from oil. Genomes are visualized with SYBR staining. Bottom right, agarose beads re-encapsulated in oil. Droplets maintain single-cell resolution during PCR detection. f, Schematic of dielectrophoretic sorting of droplets into either 100-cell bins or 96-well plates for single-cell analysis (step 4). g, Micrographs of single-cell droplet PCR detection before sorting (bottom left) and after sorting (bottom right). Data are mean ± s.e.m.
Fig. 2 |
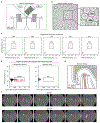
Fig. 2 |. FIND-seq analysis of XBP1-driven astrocytes.
a, Schematic showing the generation of functional XBP1S and Edem1 expression following Xbp1u mRNA splicing. b, Naive and EAE mice were analysed by FIND-seq using Aqp4 and Edem1 expression as markers of astrocytes and Xbp1 mRNA splicing, respectively. c, Representative droplet cytometry plots. Numbers in each quadrant are the percentage of positive drops. Top quadrants contain Aqp4+ cells, and the top-right quadrant contains Aqp4+Edem1+ cells. d, Percentage and absolute numbers of Aqp4+Edem1+ cells in naive and EAE mice. n = 3 mice per group. Unpaired two-sided t-test. e, Immunostaining analysis of XBP1S+ GFAP+ astrocytes in the grey and white matter of the brain and spinal cord in naive and EAE mice. n = 6 images per group from n = 3 mice. Unpaired two-sided t-test. f, Heat map of genes that are differentially expressed between naive and EAE Aqp4+ astrocytes (defined by P < 0.05 and |[log2(fold change)]| > 2). BR, biological replicate. Two technical replicates were analysed for each mouse in each condition. g, Pathways analysed by pre-ranked gene set enrichment analysis (GSEA) of genes from RNA-seq data comparing EAE Aqp4+Edem1 with naive Aqp4+Edem1 cells. h, Canonical inflammatory pathways in EAE Aqp4+Edem1 cells relative to EAE Aqp4+Edem1 cells. i, IPA analysis of FIND-seq data comparing Aqp4+Edem1+ to Aqp4+Edem1 cells during EAE showing prediction of XBP1 as an upstream regulator in EAE Aqp4+Edem1+ cells. This analysis is performed by computing the overlap in the differentially expressed genes of the FIND-seq dataset with the genes regulated by XBP1 by Fisher’s exact test. Data are mean ± s.e.m.
Fig. 3 |
Fig. 3 |. NR3C2–NCOR2 signalling limits disease-promoting astrocyte responses.
a, Schematic of scFIND-seq applied to Aqp4+Edem1+ astrocytes in EAE. b, Uniform manifold approximation and projection (UMAP) plots of Aqp4+Edem1+ and Aqp4+Edem1 astrocytes from naive and EAE mice analysed by scFIND-seq. c, Analysis of marker genes in Aqp4+Edem1+ or Aqp4+Edem1 astrocytes from naive and EAE mice. d, Pathway analysis of cluster 1 astrocytes analysed by scFIND-seq using IPA. Fisher’s exact test. e, In vivo knockdown of Nr3c2 in astrocytes. Top, schematic of the lentiviral vector containing sgRNA targeting Nr3c2 and Streptococcus pyogenes Cas9 under the control of a Gfap promoter. Bottom, EAE disease progression in mice transduced with sgScrmbl (n = 14) or sgNr3c2 (n = 7) lentiviruses. Two-way repeated measures ANOVA. f, Quantitative PCR with reverse transcription Il1b, Il6 and Ccl2 after 24 h and Xbp1 after 4 h in primary mouse astrocytes treated with or without 1 ng ml−1 IL-1β and TNF in the presence of 1 μM finerenone or vehicle. n = 5 per group. Unpaired two-sided t-test. g, Left, heat map of RNA-seq data from of astrocytes isolated from sgScrmbl and sgNr3c2 mice. n = 3 per group. Right, GSEA pre-ranked analysis of RNA-seq data comparing astrocytes isolated from sgNr3c2 versus sgScrmbl mice. h, FACS analysis of spliced XBP1 (XBP1S+) in astrocytes from sgScrmbl and sgNr3c2 mice (n = 3 per group). Unpaired two-sided t-test. i, Left, prediction of decreased NCOR2 activation by IPA in cluster 1 scFIND-seq data compiled from all cells. Fisher’s exact test. Right, differential gene expression of candidate co-regulators of NR3C2 in sgNr3c2 versus sgScrmbl astrocytes showing Ncor2 as the top candidate. j, Analysis of EAE mice transduced with lentivirus co-expressing Gfap::Cas9 and sgNcor2 (n = 9) or sgScrmbl (n = 9). Top, schematic of the lentiviral vector containing sgRNA targeting Ncor2 and S. pyogenes Cas9 under the control of a Gfap promoter. Bottom, disease progression in sgScrmbl versus sgNcor2 mice. Two-way repeated measures ANOVA. k, Heat map of RNA-seq data from astrocytes in sgScrmbl versus sgNcor2 mice. n = 3 per group. l, GSEA pre-ranked analysis of scRNA-seq data in astrocytes from sgScrmbl versus sgNcor2 mice. Data are mean ± s.e.m.
Fig. 4 |
Fig. 4 |. XBP1 limits NR3C2–NCOR2 signalling in EAE and multiple sclerosis.
a, Mice with a floxed Xbp1 allele were crossed to mice expressing creERT2 under control of the Aldh1l1 promoter to generate tamoxifen-inducible Xbp1 astrocyte (Xbp1Astro) conditional-knockout mice. b, EAE disease progression in wild-type Xbp1 (Xbp1WT) (n = 8) and Xbp1Astro knockout (n = 7) mice. c, Analysis of RNA-seq data comparing astrocytes isolated from Xbp1WT and Xbp1Astro mice. n = 3 per group. ER UPR, endoplasmic reticulum unfolded protein response; GOBP, Gene Ontology biological process; KO, knockout. d, Re-analysis of scRNA-seq datasets from patients with multiple sclerosis (previously reported in ref. ), showing expression of NR3C2 and NCOR2 in human astrocytes. e, GSEA pre-ranked analysis comparing NCOR2+ astrocytes to NCOR2 astrocytes and NR3C2+ astrocytes to NR3C2 astrocytes in patients with multiple sclerosis. f, Quantification of NR3C2+ astrocytes identified by immunostaining of tissue from patients with multiple sclerosis. n = 3 patients and n = 9 images per group. Unpaired two-sided t-test. g, Violin plots depicting the signature score calculated for the indicated gene set in astrocytes isolated from controls or patients with multiple sclerosis, derived from data in d. Data are mean ± s.e.m.

References

    1. Baecher-Allan C, Kaskow BJ & Weiner HL Multiple sclerosis: mechanisms and immunotherapy. Neuron 97, 742–768 (2018). - PubMed
    1. Lee H-G, Wheeler MA & Quintana FJ Function and therapeutic value of astrocytes in neurological diseases. Nat. Rev. Drug Discovery 21, 339–358 (2022). - PMC - PubMed
    1. Linnerbauer M, Wheeler MA & Quintana FJ Astrocyte crosstalk in cns inflammation. Neuron 108, 608–622 (2020). - PMC - PubMed
    1. Wheeler MA et al. Environmental control of astrocyte pathogenic activities in CNS inflammation. Cell 176, 581–596.e518 (2019). - PMC - PubMed
    1. Börner K et al. Anatomical structures, cell types and biomarkers of the human reference atlas. Nat. Cell Biol 23, 1117–1128 (2021). - PMC - PubMed

Publication types