. 2023 Feb;614(7948):530-538.
doi: 10.1038/s41586-022-05660-7. Epub 2023 Jan 4.

Neonatal imprinting of alveolar macrophages via neutrophil-derived 12-HETE

Affiliations

Neonatal imprinting of alveolar macrophages via neutrophil-derived 12-HETE

Erwan Pernet et al. Nature. 2023 Feb.

Abstract

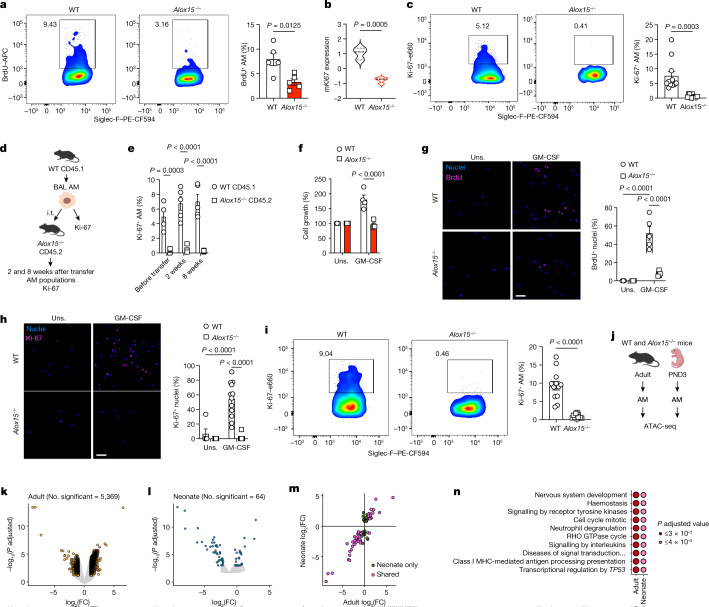
Resident-tissue macrophages (RTMs) arise from embryonic precursors1,2, yet the developmental signals that shape their longevity remain largely unknown. Here we demonstrate in mice genetically deficient in 12-lipoxygenase and 15-lipoxygenase (Alox15-/- mice) that neonatal neutrophil-derived 12-HETE is required for self-renewal and maintenance of alveolar macrophages (AMs) during lung development. Although the seeding and differentiation of AM progenitors remained intact, the absence of 12-HETE led to a significant reduction in AMs in adult lungs and enhanced senescence owing to increased prostaglandin E2 production. A compromised AM compartment resulted in increased susceptibility to acute lung injury induced by lipopolysaccharide and to pulmonary infections with influenza A virus or SARS-CoV-2. Our results highlight the complexity of prenatal RTM programming and reveal their dependency on in trans eicosanoid production by neutrophils for lifelong self-renewal.


Conflict of interest statement

The authors declare no competing interests.

Figures

Fig. 1
Fig. 1. ALOX15 is required for AM maintenance.
a, Representative FACS plots (left) and quantification (right) of AM numbers (gated on single live cells, CD45.2+CD11c+Siglec-F+) in the lungs of adult WT (n = 7) and Alox15−/− (n = 6) mice. b, AM numbers in BAL (n = 9 mice per group). c, Quantification of the AM population in the lungs of BM chimeras 8 weeks after reconstitution (left to right, n = 5, 5, 8, 11, 11, 9 and 5 mice per group, respectively). d, Model of AM development. eg, Numbers of fetal monocytes (e), pre-AMs (f) and AMs (g) in WT and Alox15−/− lungs at various ages (n = 6 (PND0) or 8 (PND1 and PND3) per group). h, Top upregulated and downregulated pathways from KEGG Pathway enrichment analysis. i, Violin plot (left) and heatmap (right) of mRNA transcripts significantly upregulated and downregulated in the cell cycle pathway (n = 3 (WT) or 4 (Alox15−/−)). Data are presented as the mean ± s.e.m. and are from one experiment (h,i) or pooled from two (a,c,eg) or three (b) independent experiments. Data were analysed using unpaired two-tailed t-test (a,b), Mann–Whitney two-tailed test (i) or one-way analysis of variance (ANOVA) followed by Tukey’s multiple comparisons test (c). The model in d was created using BioRender (https://biorender.com). Source data
Fig. 2
Fig. 2. Alox15−/− AMs are intrinsically impaired in proliferation.
a, Representative FACS plots (left) and quantification (right) of BrdU+ AMs in adult WT and Alox15−/− lungs after a 7-day BrdU pulse (n = 5 mice per group). b, Mouse Ki67 (mKi67) expression from the RNA-seq dataset (n = 3 (WT) or 4 (Alox15−/−)). c, Representative FACS plots (left) and quantification (right) of Ki-67+ AMs in adult WT and Alox15−/− lungs (n = 11 per group). d, Scheme of the adoptive transfer protocol. e, Ki-67+ AMs before and after transfer (WT CD45.1 (left to right), n = 4, 5 or 5; Alox15−/− CD45.2, n = 5 per group). f, Growth of AMs after culture with GM-CSF for 3 days (n = 4 biological replicates per group). g,h, Representative micrographs (left) and quantification (right) of BrdU+ (g) (n = 3 (unstimulated (Uns.) or 5 (GM-CSF) fields of view) and Ki-67+ (h) (n = 5 (Uns.), 12 (WT GM-CSF) or 10 (Alox15−/− GM-CSF) fields of view) AMs after 3 days of culture with GM-CSF. Scale bar, 50 µm. i, Representative FACS plots (left) and quantification (right) of Ki-67+ AMs in PND3 lungs (n = 12 mice per group). j, Scheme of ATAC-seq of AMs from adult (BAL) or PND3 (sorted) WT and Alox15−/− mice (n = 3 mice per group). k,l, Volcano plots for differential accessibility results in adult (k; knockout (KO) versus WT) and pups (l). Yellow (k) or blue (l) highlighted peaks have a P-adjusted value of <0.05 and absolute log2(fold change (FC)) of ≥1. m, The log2(FC) difference in accessibility in adults and pups for all significant peaks within pups. Pink highlighted points are DA in both adults and pups. Green points are significant only in pups. n, Top ten enriched pathways in adults and pups from a GSEA of genes matched to the closest DA peaks. Data are presented as the mean ± s.e.m. and are from one (e,kn) or pooled from three (c,i) or four (f) independent experiments or representative of two (a) or three (g,h) independent experiments. Data were analysed using unpaired two-tailed t-test (ab,i) or two-way ANOVA followed by Sidak’s (e) or Tukey’s (f–h) multiple comparisons test. The models in d and j were created using BioRender (https://biorender.com). Source data
Fig. 3
Fig. 3. Alox15−/− AMs are senescent.
a, Scheme of BAL-isolated AMs from adult (6–8 weeks) WT and Alox15−/− mice. b,c, Heatmap of selected mRNA transcripts of cell cycle inhibitors (b) and expression of Cdkn1a and Cdkn2a (c) in adult WT and Alox15−/− AMs (n = 3 (WT) or 4 (Alox15−/−)). d, Representative micrographs of SA-β-galactosidase expression assessed by colorimetric or fluorescence assays. Scale bars, 25 µm (left) and 50 µm (right). e,f, Representative curves (left) and quantification (right) of the oxygen consumption rate (OCR) (e) and the extracellular acidification rate (ECAR) (f) (n = 3 biological replicates/group). gi, Scheme of experiment (g), Cdkn1a and Cdkn2a expression (h) (n = 3 biological replicates per group) and SA-β-galactosidase expression (i) in AMs from PND3 WT and Alox15−/− mice. Scale bars, 25 µm (left) and 50 µm (right). jl, Scheme of experiment (j), heatmap of selected mRNA transcripts of the prostanoid pathway (k) and expression of Ptgs1 (l) from adult WT and Alox15−/− AMs (n = 3 (WT) or 4 (Alox15−/−)) in bulk RNA-seq. m, PGE2 production by resting AMs (24 h) from WT and Alox15−/− mice (n = 4 biological replicates per group). n,o, Scheme of experiment (n) and Ptgs1 and Ptgs2 expression (o) by AMs from WT and Alox15−/− PND3 mice (n = 3 biological replicates per group). p, PGE2 production by resting AMs (24 h) from WT and Alox15−/− PND3 mice (n = 3 biological replicates per group). q, BAL AMs were isolated from adult (6–8 weeks) WT mice, and the AMs were cultured with or without GM-CSF (20 ng ml–1) for 3 days and treated or with or without 10 µM of exogenous PGE2. r,s, Cdkn1a and Cdkn2a expression (e) (n = 3 biological replicates per group) and SA-β-galactosidase expression (s). Scale bar, 50 µm. Data are presented as the mean ± s.e.m. and are from one experiment (b,c,kl) or from three (e,f,h,o,p,r) or four (m) independent experiments, or representative of two (d,l,s) independent experiments. Data were analysed using unpaired (c,l,m,p) or paired (e,f) two-tailed t-test or two-way ANOVA followed by Sidak’s multiple comparisons test (h,o,r). The models in a, g, j and n were created using BioRender (https://biorender.com). Source data
Fig. 4
Fig. 4. Alox15−/− AMs have dysregulated responses to sterile inflammation and viral infection.
a, WT or Alox15−/− AMs were transferred (intratracheal (i.t.)) into Csf2rb−/− mice, and BAL protein levels were determined 6 weeks after transfer (left to right, n = 6, 11, 9 or 9 per group). b, CXCL1 production by WT or Alox15−/− AMs after stimulation with LPS (100 ng ml–1) (n = 4 biological replicates per group). cf, LPS (20 µg) was delivered intranasally to adult WT and Alox15−/− mice. c, BAL CXCL1 levels (left to right, n = 3, 11 or 7 (WT) or 3, 10 or 8 (Alox15−/−) mice per time point). d, Pulmonary pathology after LPS treatment. Scale bar, 100 µm. e, BAL protein levels (left to right, n = 3, 11 or 7 (WT) or 3, 9 or 7 (Alox15−/−) mice per time point). f, BAL neutrophil numbers (left to right, n = 3, 11 or 7 (WT) or 3, 10 or 8 (Alox15−/−) mice per time point). g,h, Intravital microscopy following 2 h of intravenous LPS (20 µg) treatment. g, Intravascular neutrophil (cyan) aggregation (top) and cluster formation quantified (bottom) by defining contiguous objects and measuring the areas (blue, low; red, high area clusters). Vascular endothelium is red. h, Clusters were classified as large (≥3,000 µm2) (n = 5 (WT) or 17 (Alox15−/−) cells), medium (500–2,999 µm2) (n = 105 (WT) or 66 (Alox15−/−) cells) or small or individual neutrophils (500 µm2) (n = 16 (WT) or 161 (Alox15−/−) cells). n = 3 per group with 3 fields of view per mouse. i,j, Scheme (i) and quantification (j) of PGE2 production by WT and Alox15−/− AMs 4 h after IAV infection (multiplicity of infection of 1) (n = 3 biological replicates per group). k, PGE2 production by BAL AMs from IAV-infected mice (day 1, 50 p.f.u.) after 4 h of culture (n = 5 (WT) or 4 (Alox15−/−)). ln, WT and Alox15−/− mice were infected with IAV (50 p.f.u.). l, BAL levels of PGE2 (left to right, n = 6, 9, 9 or 8 (WT) or 5, 7, 9 or 7 (Alox15−/−) per time point). m, IFNβ (left to right, n = 3, 7, 9 or 8 (WT) or 3, 6, 10 or 7 (Alox15−/−) per time point). n, Pulmonary viral loads (n = 4 (day 3) or 3 (day 6) mice per group). o, Survival of WT (n = 15) and Alox15−/− (n = 16) animals infected with IAV (90 p.f.u.). p, WT AMs were transferred into Alox15−/− mice. Animals were infected 2 h after transfer with IAV (50 p.f.u.). Pulmonary viral loads were determined 3 days after infection (left to right, n = 8, 7 or 6 per group). q, Pulmonary viral loads in IAV-infected (50 p.f.u.) WT and Alox15−/− mice (treated or with or without mPGES1 inhibitor) (n = 5 per group). r,s, Scheme (r) and survival of Alox15+/+ (n = 20) and Alox15−/− (n = 17) K18-hACE2 mice infected with SARS-CoV-2. Data are presented as the mean ± s.e.m. and are from one experiment (k,q), pooled from two (a,c,e,f,m,p,s), three (g,h,j,l,o) or four (b) independent experiments, or representative of two (n) independent experiments or six biological replicates (d). Data were analysed using two-tailed unpaired t-test (k), two-tailed Mann–Whitney test (h), one-way ANOVA followed by Tukey’s multiple comparisons test (a,p,q), two-way ANOVA followed by Sidak’s multiple comparisons test (b,c,e,f,j,ln) or log-rank test (o,s). The models in a, I, p and r were created using BioRender (https://biorender.com). Source data
Fig. 5
Fig. 5. Neonatal neutrophil-derived 12-HETE programmes AM proliferation.
a, Pulmonary levels of 12(S)-HETE in PND1, PND3 and adult WT mice (left to right, n = 10, 8 or 8 per group). b, Scheme (left) and BAL AM numbers (right) in 12-HETE-treated Alox15−/− pups that were left to age until adulthood (n = 5 per group). c, Left, BrdU+ AMs after GM-CSF culture (n = 5 (Uns.) or 11, 10 or 12 (GM-CSF) fields of view (FOVs) per group). Right, basal Cdkn1a expression in AMs (n = 3 biological replicates per group). d, BAL PGE2 levels (left) and pulmonary viral loads (right) at day 3 after IAV infection (50 p.f.u.) (n = 4 per group). e, Left, quantification of ALOX15 expression in CD45+ or CD45 lung cells at various ages (n = 4 mice per group). MFI, mean fluorescence intensity. Right, ALOX15+ CD45+ cells were further gated using CD11b, Ly6C and Ly6G in PND1 lungs (n = 8 mice per group). f, Postnatal neutrophil depletion in WT mice using anti-Ly6G (left) and quantification (right) of BAL AMs in animals that were left to age until adulthood (n = 6 (isotype) or 5 (anti-Ly6G) mice per group). g, Left, BrdU+ AMs after GM-CSF culture (n = 3 (Uns.) or 5 (GM-CSF) fields of view per group). Right, basal Cdkn1a and Cdkn2a expression in AMs (n = 3 biological replicates per group). h, BAL PGE2 levels (left) and pulmonary viral loads (right) at day 3 after IAV infection (50 p.f.u.) (n = 4 mice per group). i, Lungs were isolated from PND1 or adult (6–8 weeks) WT mice and stained for Ly6G (neutrophils, red), CD11c (AMs, blue) and CD31 (endothelial cells, green). j, Quantification of macrophages and neutrophils (PND1: n = 6, Adults: n = 11). k, Mean distance between neutrophils and macrophages (PND1: n = 45, Adult: n = 43). l, Left, generation of neutrophil-specific Alox15lox/loxMrp8cre mouse model. Right, BAL AM numbers in adult mice (n = 4 per group). m, Left, BrdU+ AMs after GM-CSF culture (n = 4 (Uns.) or 6 (GM-CSF) fields of view). Right, basal Cdkn1a expression (n = 3 biological replicates per group). n, Representative uniform manifold approximation and projection (UMAP) plots of Gpr31b and Ltb4r2 expression by single-cell RNA-seq in PND1 lungs. o, BAL AM numbers in adult WT and Ltb4r2−/− mice (n = 4 per group). p, BrdU+ AMs after GM-CSF culture (left; n = 3 (Uns.) or 6 (GM-CSF) fields of view per group) and basal Cdkn1a expression (right; n = 3 biological replicates per group) in adult WT and Ltb4r2−/− AMs. q, Postnatal inhibition of LTB4R2 signalling using LY255283 in WT mice (left) and BAL AM numbers in adult mice (right) (n = 7 per group). r, BrdU+ AMs after GM-CSF culture (left; n = 3 (Uns.) or 5 (GM-CSF) fields of view per group) and basal expression of Cdkn1a (right; n = 3 biological replicates per group) in adult AMs. Data are presented as the mean ± s.e.m. and are pooled from one (d,h,n), two (a,b,e,f,l,o,q) or three (c,g,ik,m,p,r) independent experiments or representative of two (c,g,m,p,r (left)) independent experiments and were analysed using two-tailed unpaired t-test (eh,km,or), one-way ANOVA followed by Tukey’s multiple comparisons test (ad) or two-way ANOVA followed by Tukey’s (c) or Sidak’s (e,g,j,m,p,r) multiple comparisons test. The models in b, f, l and q were created using BioRender (https://biorender.com). Source data
Extended Data Fig. 1
Extended Data Fig. 1. ALOX15, but not ALOX5, is required for AM homeostasis.
(a) AM frequencies in the lungs of adult WT (n = 7) and Alox15−/− (n = 6) mice. (b) Representative FACS plot and quantification of AM frequencies in the BAL of adult WT and Alox15−/− mice (n = 9 mice/group). (c) Representative FACS plot and quantification of AM frequencies and numbers in the lungs of adult Alox15−/− (n = 9) and Alox15+/+ (n = 7) littermate control mice. (d) Representative FACS plot and quantification of AM frequencies and numbers in the lungs of adult WT (n = 10) and Alox5−/− (n = 9) mice. (e) Quantification of lung innate cells in adult WT and Alox15−/− mice (n = 8/8/8/8/6/6/6/group). See also Supplementary Fig. 1 for gating strategy. (f) Weight of spleen, lungs, brain and top liver lobe from WT and Alox15−/− adult mice (n = 8 mice/group). (g-h) Representative FACS plot (g) and quantification (h) of resident tissue macrophages in adult WT (n = 3/6/7/7/group) and Alox15−/− mice (n = 3/5/6/6/group). (i) Bone marrow chimera model. (j-k) Representative FACS plots (j) and AM chimerism 8 weeks post-BM reconstitution (right) (n = 8/11/11/9/group). Data are presented as mean ± s.e.m and are pooled from two (a, c-e, f-k) or three (b-e) independent experiments and were analyzed using unpaired two-tailed t-test (a, c) or two-way ANOVA followed by Sidak’s multiple comparisons test (k). The model in (i) was created using BioRender (https://biorender.com). Source data
Extended Data Fig. 2
Extended Data Fig. 2. Alox15−/− AM seeding and maturation.
(a) Representative FACS plot for the determination of AM progenitors (pre-AM and fetal liver monocytes) and AM in the lungs of PND0, PND1 and PND3 WT and Alox15−/− mice. (b) Weight of lungs from PND1 and PND3 WT (n = 7/group) and Alox15−/− mice (n = 6/group). (c-f) Lungs from PND1 or PND3 WT and Alox15−/− mice were harvested and the levels of TGF-β1 (c) (PND1, WT: n = 6, Alox15−/−: n = 7; PND3, WT: n = 8, Alox15−/−: n = 7), GM-CSF (d) (PND1, WT: n = 6, Alox15−/−: n = 7; PND3, WT: n = 8, Alox15−/−: n = 8), type 1 and type 2 cytokines (e- PND1: WT: n = 6, Alox15−/−: n = 7, f- PND3: n = 8/group) were determined by ELISA. (g-h) BAL-AM were isolated from PND3 WT and Alox15−/− mice for gene expression analysis (n = 3 biological replicates/group). (i) BAL-AM were isolated from adult naïve animals and cell death was assessed by flow cytometry using AnnexinV/7AAD staining (n = 7/group). (j-l) Batch effect examinations. (j) PCA and (k) heatmap plots that suggest WT4 is an outlier. (l) A heatmap that indicates the similarity between different samples. Data are presented as mean ± s.e.m and are pooled from two (b-f, i) or three (g-h) independent experiments. Source data
Extended Data Fig. 3
Extended Data Fig. 3. Intact PM and BMDM proliferation.
(a-b) Peritoneal macrophages (PM) were harvested from adult naïve WT and Alox15−/− mice and BrdU incorporation after 7 days pulse (a) or Ki67 expression (b) were determined by flow cytometry (n = 5/group). (c-d) Bone marrow-derived macrophages were generated from adult WT and Alox15−/− mice and were treated with BrdU (day 3 and 5 of differentiation). At day 6 BrdU incorporation (c) (n = 6/group) and Ki67 expression (d) (n = 9/group) were evaluated by flow cytometry. (e) Representative FACS plot and quantification of Ki67+ AM frequencies in the lungs of adult WT and Alox5−/− mice (n = 4/group). (f-g) AM kinetics following local depletion by clodronate liposomes. Adult WT (control: n = 3/6/9/timepoint, clodronate: n = 3/6/10/timepoint), Alox15−/− (control: n = 3/6/10 mice/timepoint, clodronate: n = 3/6/9/timepoint) or Ccr2−/− (n = 3/3/5/group/timepoint) mice were given control or clodronate liposomes intranasally (70 µl). AM populations were assessed in the airways at day 2 and 14 post-delivery. (f) Numbers of AM in the BAL at various days post-infection. (g) Frequency of Ki67+ AM in the BAL at day 14 (n = 5/group). (h) Representative FACS plot of Ki67+ CD45.1 BAL AM before adoptive transfer. (i) Representative FACS plots of AM in the lungs of Alox15−/− mice 2 and 8 weeks after WT CD45.1 AM transfer. (j) Quantification of WT CD45.1+ or Alox15−/− CD45.2+ AM post-adoptive transfer in ALOX15-deficient mice (n = 5/group). (k) BAL AM from adult WT and Alox15−/− mice were cultured with M-CSF for 3 days before cell growth was evaluated (n = 3 biological replicates/group). (l) PM isolated from adult WT and Alox15−/− mice were cultured with M-CSF+IL-4 for 3 days before cell growth was evaluated (n = 3 biological replicates/group). (m) BMDM generated from adult WT (n = 4 biological replicates) and Alox15−/− (n = 3 biological replicates) mice were cultured with M-CSF for 3 days before cell growth was evaluated. (n-r) WT and Alox15−/− AM from adult and PND3 mice were subjected to ATAC-Seq (n = 3/group). (n) Principal component analysis of WT versus KO adult and pup cells. (o) The number of differentially accessible peaks comparing ALOX15-deficient and WT cells using the cutoffs: p.adj < 0.05 and abs(log2FC) > 1. Upward bars indicate increased accessibility in the KO condition and downward bars indicate decreased accessibility. (p) Venn diagram showing the relative numbers of DA peaks in adults and pups. Circle size is proportional to the number of DA peaks. Out of 64 total peaks with p.adj < 0.05 and abs(log2FC) > 1 in pups, ~65% (42/64) overlapped with the DA peaks set in adults. (q) Correlation (pearson cor = 0.702, p < 2.2e-16) of normalized enrichment scores (NES) for all enriched pathways in adults and pups. Pink highlighted points are the top 10 pathways in both adults and pups. (r) Heatmap showing the gene set enrichment results specifically for reactome pathways related to proliferation. Shading is indicative of significance with darker red colors indicating lower p.adjusted values. Data are presented as mean ± s.e.m and are from one (e, g-j, n-r), or pooled from two (c, f) or three (d, k-m) or representative of two (a-b) independent experiments. Data were analyzed using two-way ANOVA followed by Tukey’s (f) or Sidak’s (g, j-k) multiple comparisons test. Source data
Extended Data Fig. 4
Extended Data Fig. 4. Intact GM-CSF and TGF-β1 signalling in Alox15−/− AM.
BAL (a) (WT: n = 11/10/group, Alox15−/−: n = 12/11/group) and lung tissue (b) (WT: n = 9/group, Alox15−/−: n = 9/8/group) levels of GM-CSF and TGF-β1 in adult WT and Alox15−/− mice. (c-f) BAL-AM were isolated from adult naïve animals and phosphorylation of pAKT1 (c) (n = 6/group), pERK1/2 (d) (n = 6/group), pSMAD2/3 (e) (n = 3/group), pSTAT5 (f) (WT: n = 17, Alox15−/−: n = 16) were assessed by flow cytometry. (g) BAL-AM were isolated from adult naïve animals and cultured with GM-CSF (10 ng/ml) for various time points before phosphorylation of STAT5 was evaluated. Bar = 50 µm. (h) Expression of Cdkn1a in AM, PM and BMDM from adult WT and Alox15−/− mice by qPCR (n = 6/group). (i) Left, representative micrographs of H&E-stained adult WT and Alox15−/− AM harvested by BAL. Bar = 10 µm. Right, percentage of bi-nucleated cells in BAL AM (n = 5 fields of view/group). (j) Representative histograms (left) and quantification (right) of DNA content in BAL AM from adult WT and Alox15−/− mice (n = 6/group). (k) Representative curve (left, n = 3/group) and quantification (right, n = 3 biological replicates/group) of OCR in PM isolated from adult WT and Alox15−/− mice. (l) Representative curve (left, n = 5/group) and quantification (right, n = 5 biological replicates/group) of OCR in BMDM generated from adult WT and Alox15−/− mice. (m) Representative immunoblot (left) and quantification (right) of cytokine production in the supernatant of resting (24 h) pooled from adult WT or Alox15−/− BAL AM. (n) Representative curve (left, WT: n = 5, Alox15−/−: n = 3) and quantification (right, n = 3 biological replicates/group) of OCR in AM from PND3 WT and Alox15−/− mice. Data are presented as mean ± s.e.m and are from one (e, m) or pooled from two (c-d, h, j), three (a-b, k-l, n), or five (f, i) independent experiments or representative of two (g) independent experiments. Data were analyzed using unpaired two-tailed t-test (i) or two-way ANOVA followed by Sidak’s multiple comparisons test (h, j). Source data
Extended Data Fig. 5
Extended Data Fig. 5. No difference in canonical senescence pathways.
(a) Representative histograms and quantification of p53 MFI in PND3 AM from WT (n = 5) and Alox15−/− (n = 6) animals. (b) Expression of Trp53 in adult AM from WT and Alox15−/− mice (n = 6/group). (c-f) Representative histograms and quantification of p53 (c) (n = 5/group), MitoSox (d) (n = 3/group), p-p38 (e) (n = 3/group) and p-γH2AX (f) (n = 5/group) in BAL AM isolated from adult WT and Alox15−/− mice. (g-h) Heatmap and quantification of genes involved in antioxidant response (g) or interferon response (h) in BAL AM isolated from adult WT (n = 3) and Alox15−/− (n = 4) mice in bulk RNA-Seq dataset. (i) Expression of Ptgs/Ptges (WT n = 5/group, Alox15−/− n = 6/5/6/6/6/group) and Ptger genes by BAL AM from adult WT and Alox15−/− mice (n = 6/group). (j) Expression of Ptgs1 by AM, PM and BMDM from adult WT and Alox15−/− mice (n = 6/group). (k-l) PGE2 production by naïve resting (24 h) peritoneal macrophages (k) or bone marrow derived macrophages (l) from adult WT and Alox15−/− mice (n = 6/group). (m-n) BAL AM were isolated from adult (6–8 weeks) WT mice, and they were cultured or not with GM-CSF (20 ng/ml) for 3 days and treated or not with various concentrations of exogenous PGE2. (m) Representative micrographs of Ki67+ AM after 3 days of culture with GM-CSF and treated or not with PGE2 (1–10 µM). Bar = 50 µm. (n) AM growth was assessed after culture with GM-CSF and treatment with PGE2 (10 µM) (n = 3 biological replicates/group). (o) Heatmap and quantification of lipoxygenase pathway related genes in BAL AM from adult WT (n = 3) and Alox15−/− (n =  4). (p) Production of LTB4 and cysteinyl leukotrienes by resting adult WT and Alox15−/− BAL AM (24 h) (n = 3 biological replicates/group). Data are presented as mean ± s.e.m and are from one (e, g-h, o) or pooled from two (b, i-l) or three (n, p) independent experiments or representative of two experiments (a, c-f, m) independent experiments. Data were analysed using two-way ANOVA followed by Sidak’s multiple comparisons test (i-j, n). Source data
Extended Data Fig. 6
Extended Data Fig. 6. Homeostatic Alox15−/− AM are similar to WT AM.
(a) Heatmap and quantification of genes previously associated with alveolar macrophages or monocytes lineages (WT: n = 3, Alox15−/−: n = 4). (b) Representative FACS plots and quantification of surface markers expression determined by flow cytometry. (c) Heatmap and quantification of genes previously associated with alveolar macrophages phenotype (WT: n = 3, Alox15−/−: n = 4). (d) Representative FACS plots of AM population in 6–8 weeks and 52 weeks old WT and Alox15−/− mice. (e) AM numbers in the lungs of 6–8 (WT: n = 3, Alox15−/−: n = 5) or 52-weeks old (n = 5/group) WT and Alox15−/− mice. (f) BAL total protein levels in 6–8 (n = 3/group) or 52-weeks old (n = 5/group) WT and Alox15−/− mice. (g) Representative micrographs of lung sections from naïve 6–8 weeks and 52 weeks old WT and Alox15−/− mice. Bar = 100 µm. (h-i) Adult WT (n = 5) and Alox15−/− (n = 6) mice were used to measure resistance (h) and elastance (i). (j) Phagocytic capacity of naïve BAL AM from adult WT and Alox15−/− mice (WT: n = 7, Alox15−/−: n = 6 biological replicates). (k) Representative micrographs of BAL AM, cytospun, and stained with H&E (top) or Oil red O (bottom). Bar = 20 µm. (l-n) BAL was collected from adult WT, Alox15−/− and Csf2rb−/− mice, and BAL turbidity (l) (n = 10/14/11/group), total protein content (p) (n = 13/15/15/group) and SP-A levels (q) (n = 5/6/5/group) were measured. Data are presented as mean ± s.e.m and are from one (a, c, d-f) or pooled from two (h-j) or three (l-m) independent experiments or representative of two (b, k) independent experiments or 5 biological replicates (g). Data were analyzed using two-way ANOVA followed by Tukey’s multiple comparison test (f), two-tailed unpaired t-test (e), or one-way ANOVA followed by Tukey’s multiple comparisons test (l-n). Source data
Extended Data Fig. 7
Extended Data Fig. 7. Alox15−/− mice are more susceptible to acute viral infections.
(a) BAL AM from adult WT and Alox15−/− mice were stimulated in vitro using LPS (100 ng/ml) and TNFa (left) or IL6 (right) production was assessed by ELISA (n = 3 biological replicates/group). (b-c) Peritoneal macrophages (b) or BMDM (c) from adult WT and Alox15−/− were stimulated with LPS (100 ng/ml) and production of TNFα and CXCL1/KC was evaluated by ELISA (n = 3 biological replicates/group). (d) TNFα and IL6 levels in BAL from adult WT and Alox15−/− mice treated or not with 20 µg LPS intranasally (WT: n = 3/11/7/timepoint, Alox15−/−: TNFα n = 3/10/8 and IL6 3/10/9/timepoint). (e) BAL cellularity in LPS-treated (20 µg/mouse) WT and Alox15−/− mice at various days post-delivery (WT: n = 3/11/7/timepoint, Alox15−/−: n = 3/10/8/timepoint). (f) BAL AM from adult WT and Alox15−/− mice were stimulated in vitro using poly(I:C) (50 µg/ml) and CXCL1/KC, CCL2 and TNFα production were assessed by ELISA (n = 3 biological replicates/group). (g-o) Adult WT and Alox15−/− mice were infected with IAV (50 pfu). (g-i) BAL levels of IFNα (g) (WT: n = 3/5/8/7/timepoint, Alox15−/−: n = 3/5/9/7/timepoint), IFNλ (h) (WT: n = 3/5/7/8 /timepoint, Alox15−/−: n = 3/4/7/7/timepoint) and CCL2 (i) (WT: n = 3/6/6/11/7/timepoint, Alox15−/−: n = 3/6/6/10/5/timepoint) at various days post-infection. (j-k) Numbers of monocytes in the BAL (j) (WT: n = 3/8/9/timepoint, Alox15−/−: n = 3/7/8/timepoint) and lungs (k) (WT: n = 5/4/5/timepoint, Alox15−/−: n = 5/3/5/timepoint) at various days post-infection. (l) Protein levels in BAL (WT: n = 4/5/6/timepoint, Alox15−/−: n = 4/4/5/timepoint). (m) Representative micrographs of lung sections at day 6 post-IAV infection. Bar = 100 µm. (n) Oxygen saturation at various days post-infection (WT: n = 3/5/9/timepoint, Alox15−/−: n = 3/5/8/timepoint). (o) Wet/dry ratio (Uninf.: n = 3/group, IAV: n = 4/group). (p-q) Representative micrographs and quantification of Evans blue extravasation in the lungs (p) and BAL (q) of IAV-infected mice at day 6 post-infection (Uninf.: n = 3/group, IAV: 5/group). (r) Representatives weight loss curves after infection with LD50 dose (90 pfu) of IAV (n = 11/group). Data are presented as mean ± s.e.m and are pooled from two (d-e, g-j, n, r) or three (a-c, f) or representative of two (k, o-q) independent experiments or 6 biological replicates (m). Data were analyzed using two-way ANOVA followed by Sidak’s multiple comparisons test (a, d-g, i-l, n-r). Source data
Extended Data Fig. 8
Extended Data Fig. 8. ALOX15-deficient mice are more susceptible to a low dose of IAV.
(a-c) WT and Alox15−/− animals were infected with IAV (50 pfu, in). (a) At various days post-infection, expression of ALOX15 was evaluated by flow cytometry (ICS) in CD45 cells as well as various leukocyte populations. The expression was normalized to Alox15−/− mice used as controls for gating (n = 4/5/3/5/group). (b) Levels of 12-HETE (left, n = 5/10/8/13/group) and 15-HETE (right, n = 6/12/8/13/group) in the BAL at various days post-infection. (c-i) WT and Alox15−/− animals were infected with IAV (20 pfu, in). (c) Pulmonary viral loads at day 3 post-infection (n = 4/group). (d-h) BAL levels of IFNβ (d) (0: n = 3/group, 3: n = 5/group) and PGE2 (e) (n = 5/group) at day 3 post-infection. (f) BAL levels of CCL2 (left) and CXCL1/KC (right) at various days post-infection (WT: n = 3/5/9/5/6/3/group, Alox15−/−: n = 3/5/8/6/5/3 mice/group). (g) BAL numbers of AM (left), monocytes (middle) and neutrophils (right) at various days post-infection (WT: n = 3/5/5/5/6/3/timepoint, Alox15−/−: n = 3/5/5/6/5/3/timepoint). (h) Total BAL protein levels at various days post-infection (WT: n = 3/5/9/5/6/3/group, Alox15−/−: n = 3/5/7/6/5/3/group). (i) Representative micrographs of H&E lung sections at various days post-infection. (j) Alox15−/− mice were treated daily with exogenous 12-HETE or 15-HETE or vehicle. Lungs were harvested at day 3 post-infection for assessment of pulmonary viral loads (n = 8/8/7/8/group). (k) Alox15−/− mice were treated daily with exogenous 12-HETE or 15-HETE or vehicle starting on the day of infection (IAV, 90 pfu, in) for 3 days. The survival was monitored overtime (n = 8/10/9/9/group). (l) Weight loss curves after SARS-CoV-2 infection (k18-hACE2 Alox15+/+: n = 19, k18-hACE2 Alox15−/−: n = 17). Data are presented as mean ± s.e.m and are from one (a, c-e, k) or pooled from two (b, f-h, j, l) independent experiments or representative of 5 (i) biological replicates. Data were analyzed using two-tailed unpaired t-test (c, e), one-way ANOVA followed by Tukey’s multiple comparisons test (b, j), two-way ANOVA followed by Sidak’s multiple comparisons test (d, f-h) or log-rank test (k). Source data
Extended Data Fig. 9
Extended Data Fig. 9. 12-HETE-treated pups have restored proliferation.
(a) Alox15 expression was measured in BAL AM (PND3 and adult mice) or peritoneal macrophages using qPCR (n = 5/3/3 biological replicates/group). (b) Pulmonary levels of 15(S)-HETE in PND1, PND3 and adult WT mice (n = 10/8/8/group). (c) Representative FACS plots and quantification of Ki67+ AM after 12-HETE treatment (Veh.: n = 7, 12-HETE: n = 5). (d) AM populations after 12-HETE treatment (Veh.: n = 7, 12-HETE: n = 6). (e) Representative FACS plots and quantification of Ki67+ AM after 15-HETE treatment (Veh.: n = 3, 15-HETE: n = 4). (f) Representative micrographs of BrdU staining in vitro after AM culture with GM-CSF. Bar=50 µm. (g-i) PND1 WT pups were delivered intranasally anti-FcεR1 antibodies or isotype controls for two consecutive days. (g) Basophil depletion, (h) AM populations and (i) Ki67+ AM were determined at PND3 (Iso.: n = 4, α-FcεRI: n = 6). (j) Representative histograms of ALOX15 expression in CD45+ or CD45 lung cells at various ages of WT and Alox15−/− mice. (k) PND1 ALOX15+ CD45+ cells were further gated using CD11b, Ly6C and Ly6G. (l) Lung and blood neutrophils were isolated from PND1 or adults (6–8 weeks) WT or Alox15−/− mice. Expression of ALOX15 and Ly6G were assessed by immunofluorescence. Blue: DAPI. Bar = 20 µm. (m) Representative micrographs of ALOX15 and Ly6G expression in frozen lung sections of PND1 WT pups. Data are presented as mean ± s.e.m and are from one (g-i) or pooled from two (c-e) or three (a-b) independent experiments or representative from two (f, j, k, l, m) independent experiments. Data were analyzed using two-tailed unpaired t-test (c, g) or one-way ANOVA followed by Tukey’s multiple comparisons test (b). Source data
Extended Data Fig. 10
Extended Data Fig. 10. Neonatal neutrophils program AM proliferative capacity.
(a) CD45+ cells were isolated from the lungs of PND1 WT and Alox15−/− pups and subjected to scRNA-Sequencing. (b) Uniform Manifold Approximation and Projection (UMAP) embedding of integrated CD45+ cells from the lungs of WT and Alox15−/− mice. Unsupervised clusters were labelled using CelliD and the expression levels of canonical cell type markers. Neutrophils were further partitioned through label transfer from adult mouse neutrophil cell atlas to create a final assignment (left). A graph representation of the results from Milo differential abundance testing (right). Nodes are neighbourhoods, coloured by their log fold change between WT and Alox15−/− cells. Non-DA neighbourhoods (FDR > 10%) are coloured white, and sizes correspond to the number of cells in a neighbourhood. There is a marked increase in the relative abundance of WT cells in the “Neutrophil-G5b” cluster compared to Alox15−/− cells. (c) Beeswarm plot showing the distribution of log-fold change between WT and Alox15−/− cells in neighborhoods containing cells from different cell type clusters. Blue refers to neighborhoods within particular cell types that are significantly enriched (FDR<5%) in WT compared to Alox15−/− animals and brown neighborhoods enriched in Alox15−/− animals relative to WT. (d) Cell type label frequencies from PanglaoDB predictions within finalized manual labeling clusters (vertical facets) and split by condition. Confirms finalized labels as consistent with automated predictions. (e-g) quantification of neutrophils (e), total (f) and Ki67+ (g) alveolar macrophages in the lungs of PND3 WT mice following isotype or anti-Ly6G treatment (Iso.: n = 8, α-Ly6G: n = 10). (h) Representative micrographs of BrdU staining in vitro after AM culture with GM-CSF. Bar = 50 µm. (i-j) Parenchymal neutrophils were determined in WT mice at various ages by intravascular and ex vivo CD45.2 staining. Representative FACS plots (i) and quantification (j) (n = 11/4/5/group). (k) Expression of various genes involved in proliferation in BAL AM from adult Alox15lox/lox and Alox15lox/lox MRP8Cre (n = 3 biological replicates/group). The genes were previously identified in our bulk RNA-Seq dataset on whole body Alox15−/− mice. (l) Representative micrographs of SA-β-galactosidase in BAL AM from Alox15lox/lox and Alox15lox/lox MRP8Cre mice. Bar=10 µm. (m) Model of EP2 signaling inhibition with TG6-10-1 in pups (left) and BAL AM numbers in adult mice (right) (n = 5/6/8/group). (n) BrdU+ AM following GM-CSF culture in vitro (left) (Uns.: n = 3, GM-CSF: n = 5 fields of view/group) and basal Cdkn1a expression (right) (n = 3 biological replicates/group) in BAL AM from adult mice. (o-p) Adult WT mice were treated with LY255283 and adult Alox15−/− mice were treated with TG6-10-1 or 12-HETE for three consecutive days. AM populations in the BAL were evaluated after 7 days resting period (o) (left, n = 5/group; right, WT: n = 5, Untreated: n = 5, 12-HETE: n = 5, TG6-10-1: n = 6) and BrdU+ AM after 3 days of culture with GM-CSF in vitro (p) (Uns.: n = 3, GM-CSF: n = 4 fields of view/group). Data are presented as mean ± s.e.m and are from one (a-d, o-p) or pooled from two (e-g, i-j, m) or three (k, n) independent experiments or representative of two (h, l, n, p) independent experiments. Data were analyzed using two-tailed unpaired t-test (e, g, k), one-way ANOVA followed by Tukey’s multiple comparison test (j, m-o) or two-way ANOVA followed by Sidak’s multiple comparisons test (n, p). The models in (a, m, q) were created using BioRender (https://biorender.com). Source data

References

    1. Schneider C, et al. Induction of the nuclear receptor PPAR-γ by the cytokine GM-CSF is critical for the differentiation of fetal monocytes into alveolar macrophages. Nat. Immunol. 2014;15:1026–1037. doi: 10.1038/ni.3005. - DOI - PubMed
    1. Guilliams M, et al. Alveolar macrophages develop from fetal monocytes that differentiate into long-lived cells in the first week of life via GM-CSF. J. Exp. Med. 2013;210:1977–1992. doi: 10.1084/jem.20131199. - DOI - PMC - PubMed
    1. Hussell T, Bell TJ. Alveolar macrophages: plasticity in a tissue-specific context. Nat. Rev. Immunol. 2014;14:81–93. doi: 10.1038/nri3600. - DOI - PubMed
    1. Sabatel C, et al. Exposure to bacterial CpG DNA protects from airway allergic inflammation by expanding regulatory lung interstitial macrophages. Immunity. 2017;46:457–473. doi: 10.1016/j.immuni.2017.02.016. - DOI - PubMed
    1. Gibbings SL, et al. Three unique interstitial macrophages in the murine lung at steady state. Am. J. Respir. Cell Mol. Biol. 2017;57:66–76. doi: 10.1165/rcmb.2016-0361OC. - DOI - PMC - PubMed

Publication types

MeSH terms

Substances