. 2023 Feb;614(7949):752-761.
doi: 10.1038/s41586-022-05670-5. Epub 2023 Jan 4.

Influenza vaccination reveals sex dimorphic imprints of prior mild COVID-19

Collaborators, Affiliations

Influenza vaccination reveals sex dimorphic imprints of prior mild COVID-19

Rachel Sparks et al. Nature. 2023 Feb.

Abstract

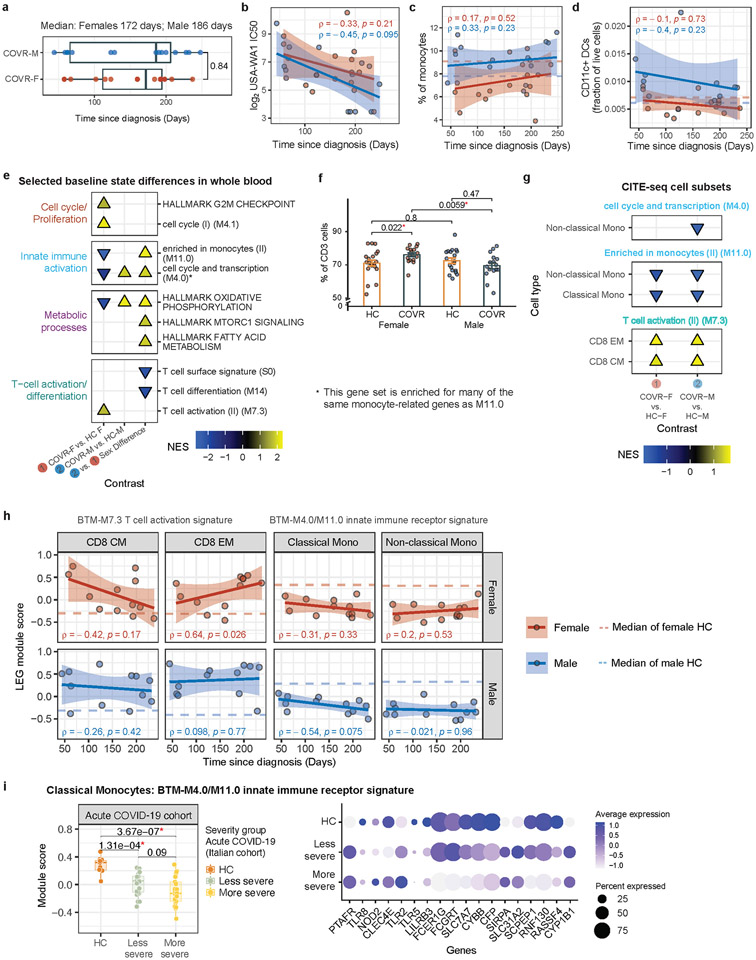
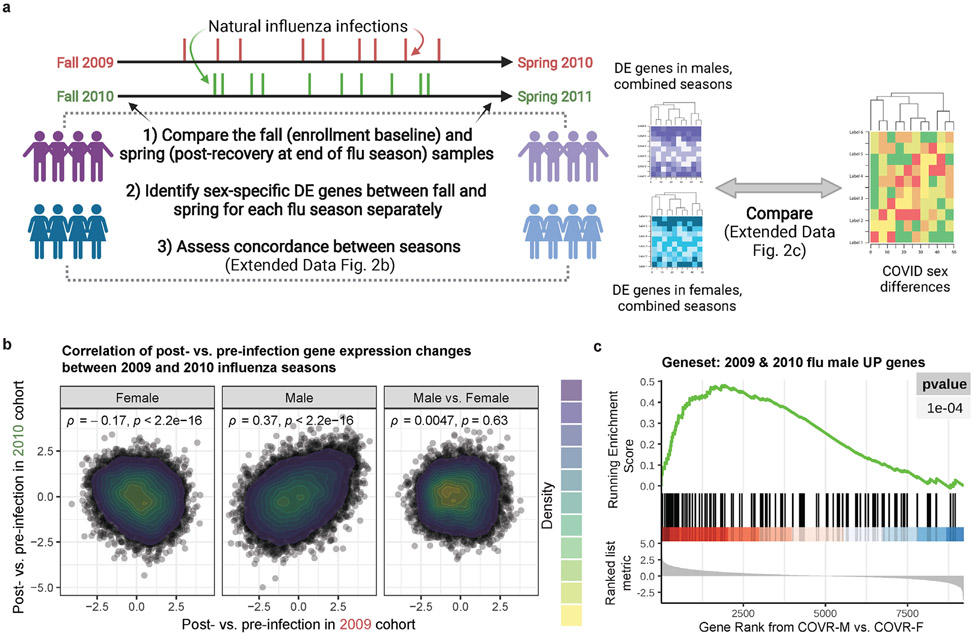
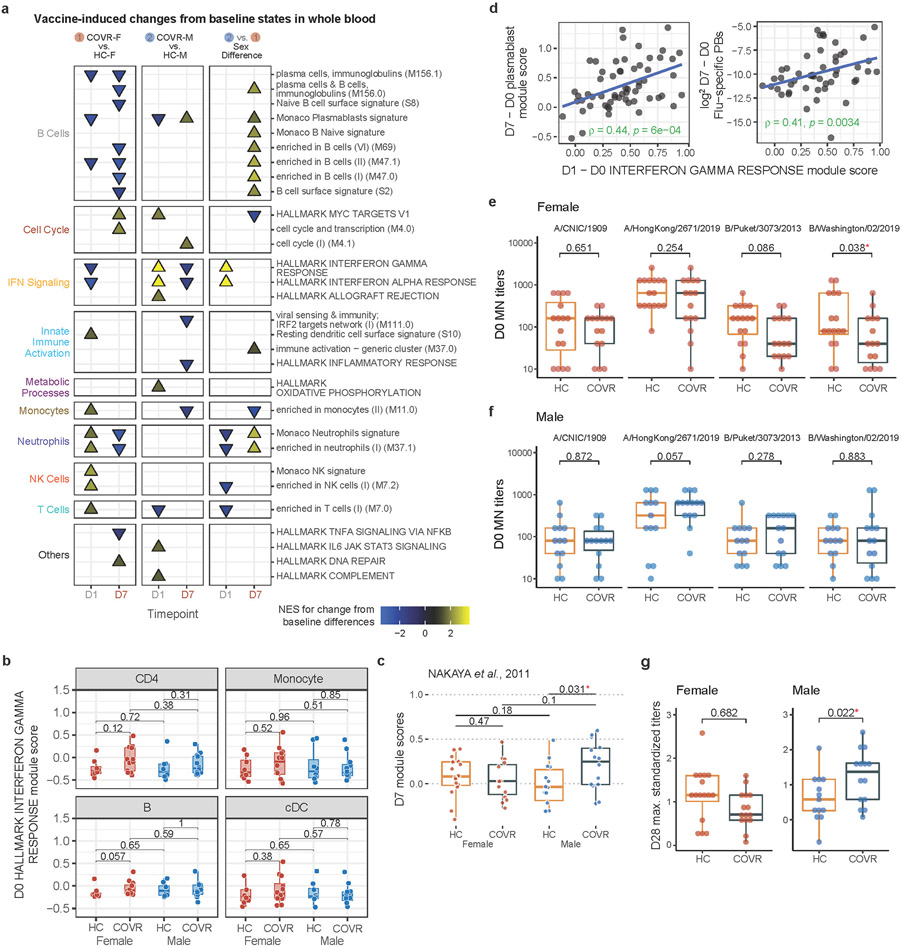
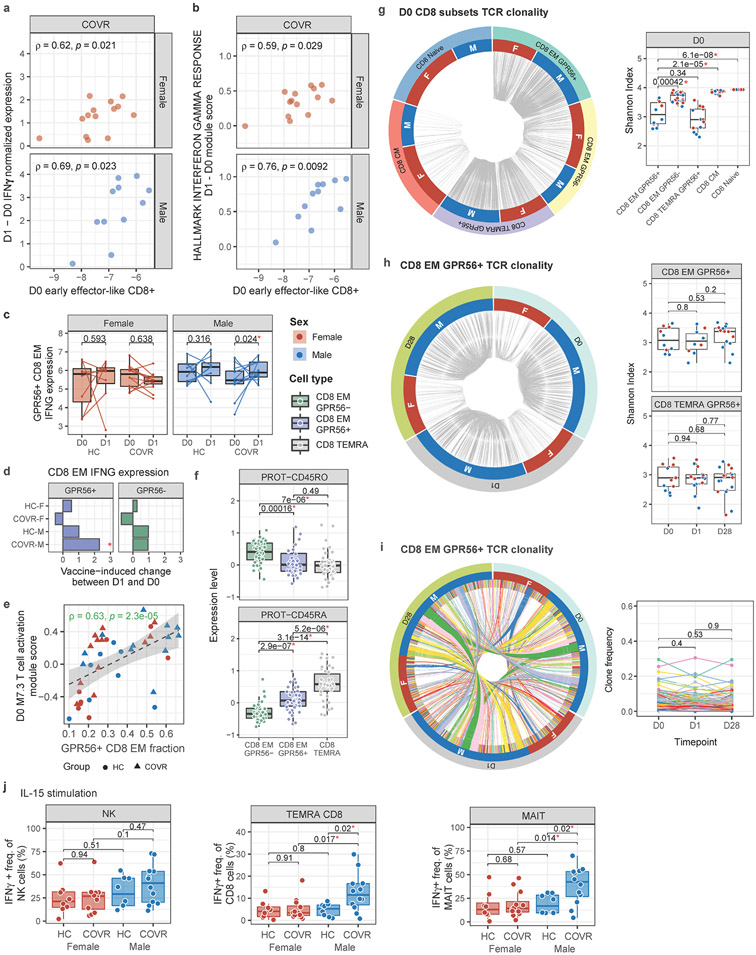
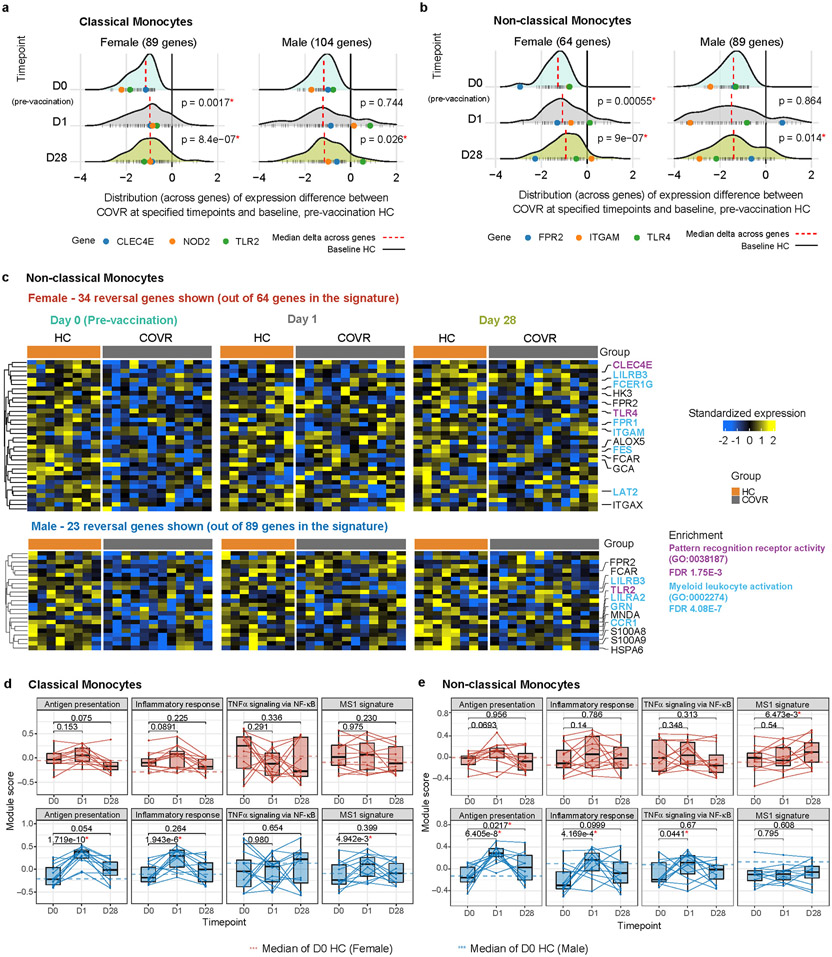
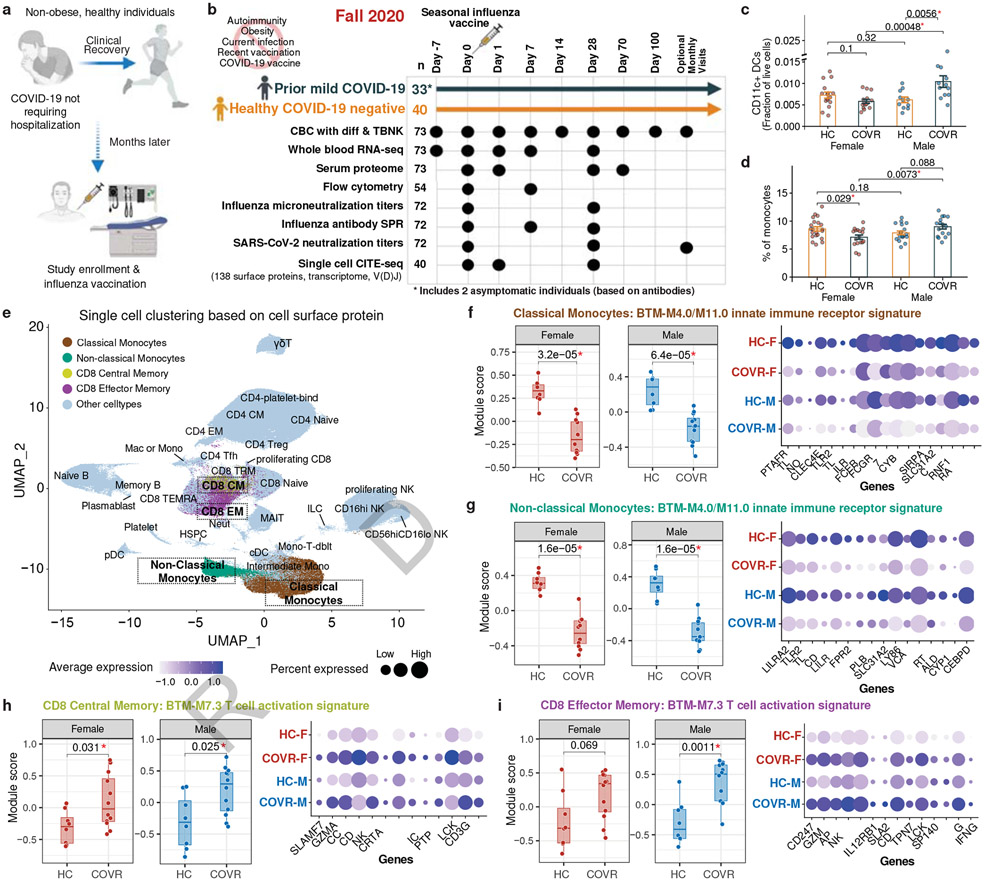
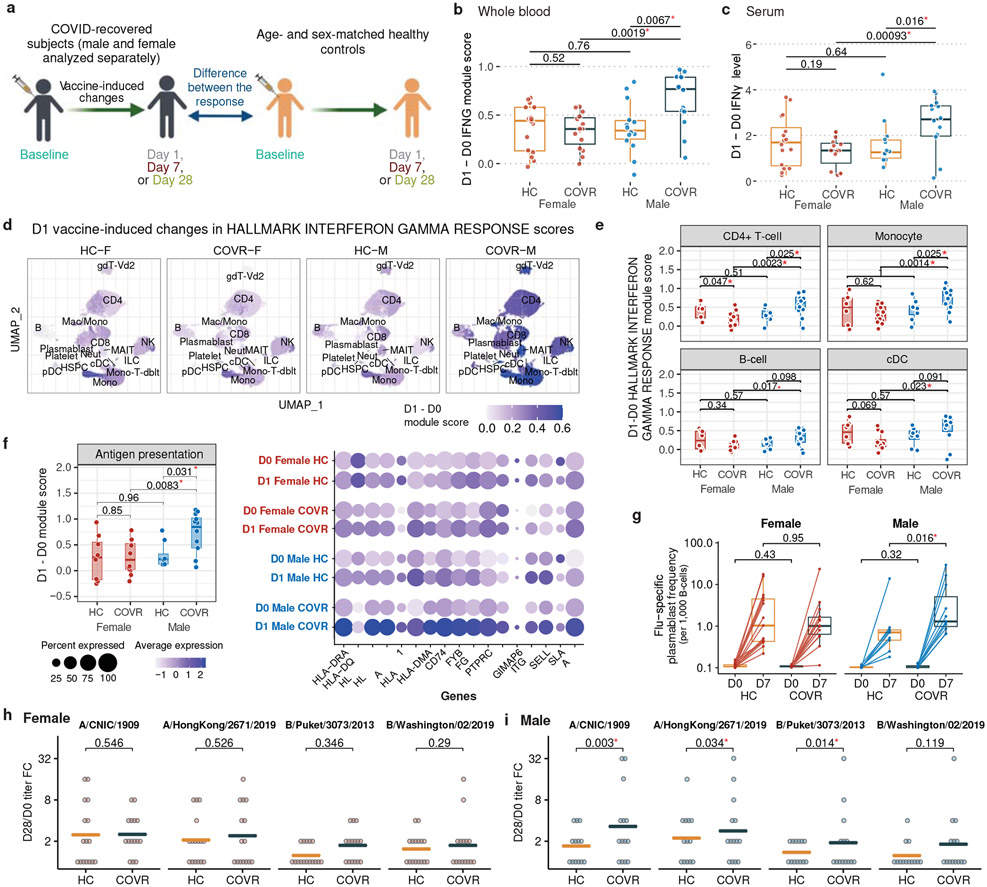
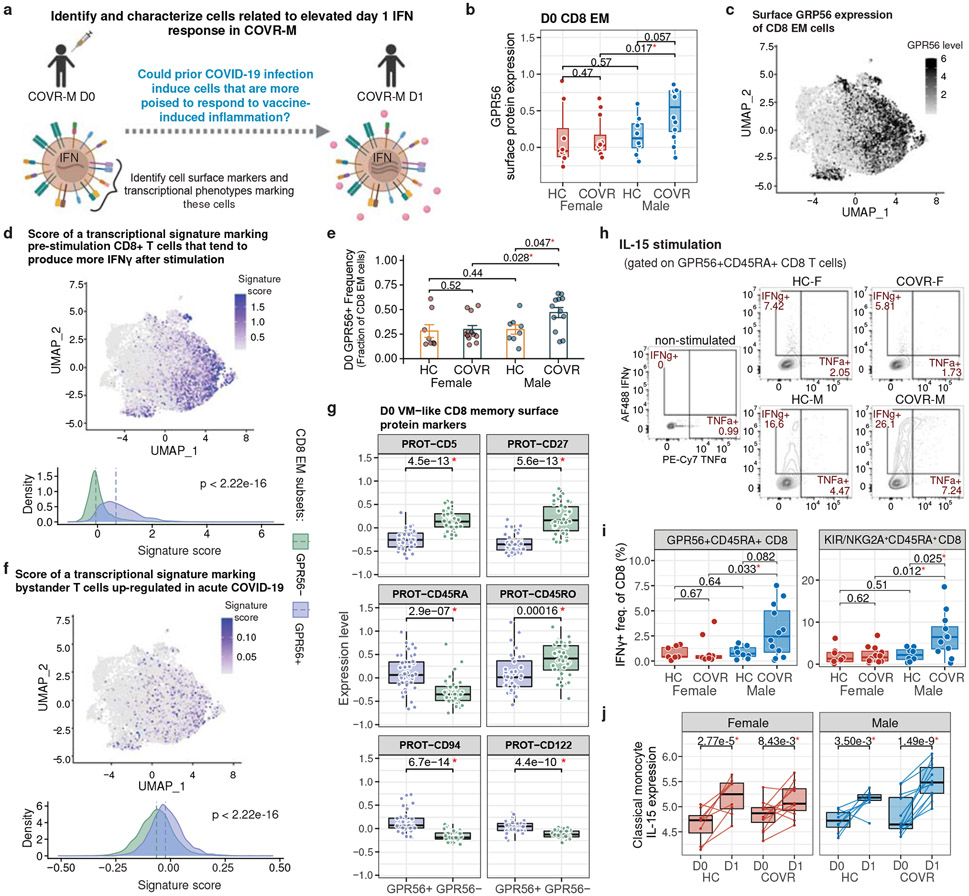
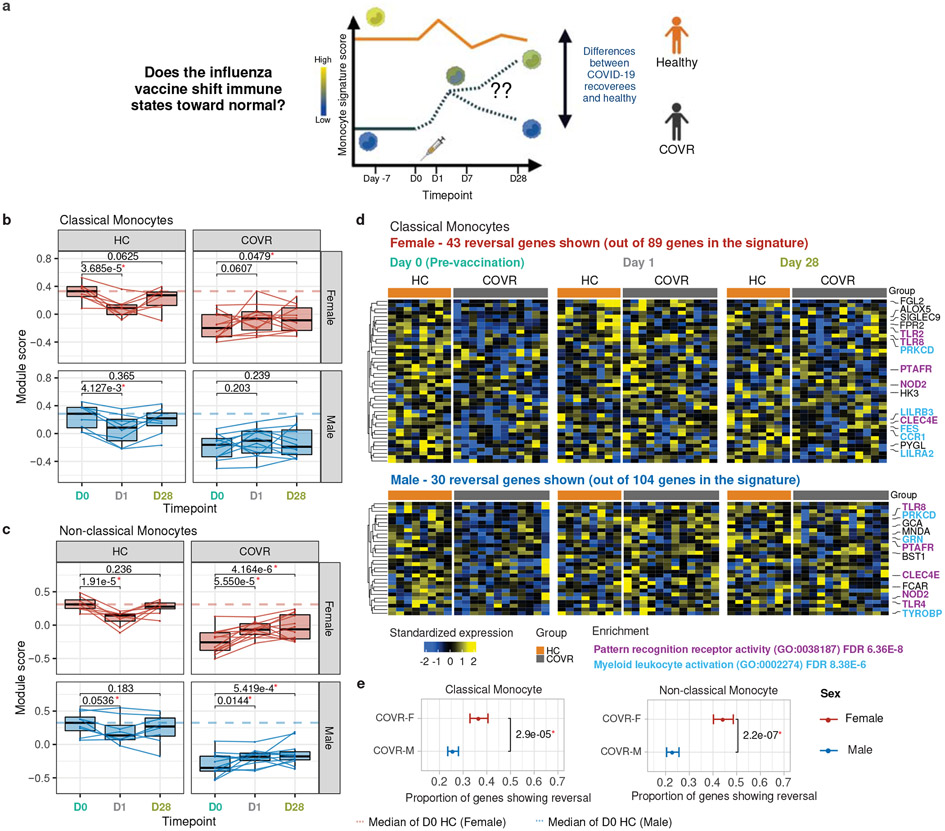
Acute viral infections can have durable functional impacts on the immune system long after recovery, but how they affect homeostatic immune states and responses to future perturbations remain poorly understood1-4. Here we use systems immunology approaches, including longitudinal multimodal single-cell analysis (surface proteins, transcriptome and V(D)J sequences) to comparatively assess baseline immune statuses and responses to influenza vaccination in 33 healthy individuals after recovery from mild, non-hospitalized COVID-19 (mean, 151 days after diagnosis) and 40 age- and sex-matched control individuals who had never had COVID-19. At the baseline and independent of time after COVID-19, recoverees had elevated T cell activation signatures and lower expression of innate immune genes including Toll-like receptors in monocytes. Male individuals who had recovered from COVID-19 had coordinately higher innate, influenza-specific plasmablast, and antibody responses after vaccination compared with healthy male individuals and female individuals who had recovered from COVID-19, in part because male recoverees had monocytes with higher IL-15 responses early after vaccination coupled with elevated prevaccination frequencies of 'virtual memory'-like CD8+ T cells poised to produce more IFNγ after IL-15 stimulation. Moreover, the expression of the repressed innate immune genes in monocytes increased by day 1 to day 28 after vaccination in recoverees, therefore moving towards the prevaccination baseline of the healthy control individuals. By contrast, these genes decreased on day 1 and returned to the baseline by day 28 in the control individuals. Our study reveals sex-dimorphic effects of previous mild COVID-19 and suggests that viral infections in humans can establish new immunological set-points that affect future immune responses in an antigen-agnostic manner.


Figures

Extended Data Figure 1.
Extended Data Figure 1.. Baseline differences between COVID-19-recovered subjects and matching controls.
a, Box plot showing the distribution of time since diagnosis (TSD; x-axis) in COVR-F (n=16) and COVR-M (n=15). Two participants with asymptomatic COVID-19 infection and thus unknown TSD are not included. Significance of group difference is determined by two-tailed Wilcoxon test. b, Scatterplot showing the correlation between the TSD (x-axis) and the SARS-CoV-2 neutralization titer (WA1 strain; y-axis) for COVR subjects at D0 prior to influenza vaccination. Spearman’s rank correlation and unadjusted p values are shown. Participants with asymptomatic COVID-19 infection not included in TSD analyses. The shaded area represents 95% confidence interval. c, Similar to (b), but for the percentage of monocytes in peripheral blood as measured by the complete blood count (y-axis) at D0. Dotted lines represent median level in HC-F and HC-M. d, Similar to (b), but for the proportion of CD11c+ dendritic cells (DCs; as fraction of live cells; y-axis) as measured by flow cytometry of PBMCs at D0. e, Blood transcriptomic analysis of the stable baseline (pre-vaccination) differences among COVR and HC groups. Enrichment plot shows the normalized enrichment scores (NES) of selected gene sets of the different comparisons (GSEA FDR < 0.05; see Methods; see Supplementary Table 3 for all significant gene sets with FDR < 0.05). The NES are plotted separately for COVR-F versus HC females (HC-F), COVR-M versus HC males (HC-M), or the difference between the two sets of comparisons (COVR-M versus COVR-F taking healthy sex differences into account). Positive (negative) NES indicates that gene set scores are higher (lower) in the first group than the second group listed in the comparison. Only gene sets not correlated with TSD across COVR subjects at baseline are considered stable. f, Similar to Fig. 1d, but for percent of CD3+ cells (T cells). g, Similar to (e), but for a subset of monocyte and T-cell activation gene sets with significant enrichment (p < 0.05) using the D0 CITE-seq pseudobulk expression for the specified cell types (see Methods; see Supplementary Table 5 for complete results). h, Scatterplots showing the relationship between the TSD and leading-edge gene (LEG) module scores [left two boxes: the T-cell activation gene set (BTM-M7.3); right two boxes: the union of the LEGs from gene sets BTM M4.0 and M11.0; see Methods] in COVR-F (n=12) (top row) and COVR-M (n=12) (bottom row) at D0 using the CITE-seq pseudobulk data of the indicated cell types. Each dot represents a COVR subject. The dotted lines represent the median score for the sex-matched HC group at D0 in the comparison shown. Spearman’s rank correlation and p values are shown. The shaded area represents 95% confidence interval. i, (left) Box plot comparing the classical monocyte pseudobulk module scores of the LEGs used in Fig. 1f (union of female (F) and male (M) gene sets) in an acute COVID-19 CITE-seq dataset from Liu et al. Both M (n=50) and F (n=9) subjects are included in all three groups (HC n=13, less severe n=21, more severe n=25). Each dot represents a sample. Unadjusted p values from the indicated two-group comparisons are shown. P values were generated using the moderated T statistics from a linear model in which samples from the same donors were treated as duplicates (See Methods). (right) Bubble plot showing expression of the genes in Fig. 1f right panel within the classical monocyte CITE-seq data from Liu et al. in the same three patient groups shown in the left panel. All box plot elements are the same as indicated in Fig. 1.
Extended Data Figure 2.
Extended Data Figure 2.. Persistent post-infection gene expression changes following natural influenza infection.
a, Schematic showing the approach used to evaluate changes in blood gene expression between before (pre-infection baseline) and months after natural influenza infection over two distinct seasons published in Zhai et al, and how those gene changes may relate to sex-specific differences resulted from prior COVID-19 in this study. b, Scatter density plot showing the correlation between the gene expression changes (see Extended Data Table 7) before (fall) and after (spring) natural influenza A infection in 2009 (x-axis) and 2010 (y-axis) for females (F; left), males (M; center), and M vs F contrast (right). Shown are Spearman’s rank correlation and unadjusted p values. c, Gene set enrichment plot of the genes that increased in M between fall (pre-infection) and spring (post-infection) in both 2009 – 2010 and 2010 – 2011 seasons. Genes were ranked by the signed log10(unadjusted p-value) in the COVID-19-recovered (COVR)-M vs COVR-F contrast at baseline using only subjects under 65 years of age. The tick marks denote the location of the genes in the influenza gene set.
Extended Data Figure 3.
Extended Data Figure 3.. Sex-specific molecular, cellular, and humoral response differences to influenza vaccination in COVID-19-recovered individuals and matching controls.
a, Similar to Extended Data Fig. 1e but here showing enriched gene sets in whole blood comparing the early [day 1 (D1) and day 7 (D7)] influenza vaccination responses in COVID recovered (COVR) vs. healthy control (HC) subjects for females (F; Contrast 1), males (M; Contrast 2), and sex differences (Contrast 2 vs. 1; i.e., COVR-M versus COVR-F taking healthy sex differences into account; see Methods). Plotted are the gene sets that show significant changes from the baseline [day −7 and day 0 (D0)] within each comparison group [e.g., COVR-F and HC-F for D1] and significant differences between the two groups at the indicated timepoints (FDR < 0.05; see Supplementary Table 5). b, Similar to Fig. 2e, but showing the D0 Hallmark IFNγ Response module score for the indicated cell types from the CITE-seq pseudobulk expression data. CD4 = CD4+ T-cells; cDC = conventional/myeloid dendritic cells; B = B-cells. c, Box plot showing the D7 whole blood signature score from genes identified in Nakaya et al whose D7/D0 fold-change positively correlated with day 28 (D28) influenza hemagglutination inhibition titers. Only subjects under 65 years of age [COVR-F (n=15), COVR-M (n=14), and HC-F (n=16), and HC-M (n=14)] are included. Significance of differences is determined by two-tailed Wilcoxon test. d, Scatter plot showing the correlation of the whole blood D1 – D0 Hallmark Interferon Gamma Response gene set module score (x-axis) to the whole blood D7 – D0 plasmablast (PB) gene set module score (left y-axis; Monaco et al) and D7 – D0 difference of influenza-specific PB (all HA+ CD27+ CD38+ CD20low CD21low) frequency from flow cytometry (right y-axis; as fraction of CD19+ B-cells). Only study participants < 65 years of age are included. Spearman’s rank correlation and unadjusted p values are shown. e, Box plots showing the D0 (pre-vaccination) microneutralization titers for each of the four strains in the seasonal influenza vaccine (columns) in females (COVR-F and HC-F) under the age of 65. Unadjusted p values are from linear models accounting for age and race (see Methods). f, Similar to (e) but for males (COVR-M and HC-M) under 65 years of age. g, Maximum standardized influenza vaccine titer (among the four strains in the vaccine) at D28 after vaccination for females (left) and males (right), respectively. Unadjusted p values are from linear regression models accounting for age, race, influenza vaccination history, and baseline influenza titer (see Methods). Unadjusted p values are shown. All box plot elements are the same as indicated in Fig. 2.
Extended Data Figure 4.
Extended Data Figure 4.. GPR56+ virtual memory-like CD8+ T-cells contribute to increased day 1 IFNγ response in COVID-19-recovered males.
a, Scatterplots showing the correlation between the day 0 (D0) log2 frequency of early effector-like CD8+ T-cells measured by flow cytometry (as fractions of live lymphocytes; see Population 50 in Supplementary Table 9 and Supplementary Fig. 1; x-axis) and the change (D1 – D0) in serum interferon gamma (IFNγ) protein levels measured by the OLINK platform (y-axis) for COVID-19-recovered (COVR) females (COVR-F; top, n=14) and COVR males (COVR-M; bottom; n=11). Spearman’s rank correlation and p values are shown. b, Similar to (a) but showing the correlation between the D0 log2 frequency of early effector-like CD8+ T-cells measured by from flow cytometry (as fraction of live lymphocytes; x-axis) and the change (D1 - D0) in the whole blood signature score of the Hallmark IFNγ Response gene set (y-axis). c, Box plots comparing D0 and D1 pseudobulk IFNG gene expression (y-axis) in GPR56+ CD8 EM population for HC-F (n=8), COVR-F (n=12), HC-M (n=8) and COVR-M (n=12). Significance is determined by a linear model accounting for age, race, and influenza vaccination history (see Methods). d, Bar plot showing the T statistic of the vaccine-induced change (D1 - D0) in IFNγ gene (IFNG) expression using CITE-seq pseudobulk data (x-axis) within the GPR56+ and GRP56− CD8 EM for HC-F (n=8), COVR-F (n=12), HC-M (n=8), and COVR-M (n=12). * p < 0.05 with exact value shown in (c). e, Scatter plot showing the correlation between GPR56+ CD8 EM cell frequency (as fractions of total CD8 EM in the CITE-seq data; x-axis) and BTM-M7.3 T-cell activation signature score of CD8 EM cells computed using CITE-seq pseudobulk gene expression data (y-axis). Spearman correlation and p values are shown. The shaded area represents the 95% confidence interval. f, Related to Fig. 3h but showing CD45RA and CD45RO only with CD8+ TEMRA cells included as an additional comparator. g, (left) Circos plot of T-cell receptor (TCR) clonality for different CD8+ T-cell subsets at D0. Segments in the outer circle represent different CD8+ T-cell populations. Segments in inner circle represent male (M) and female (F) for both COVR and HC subjects. Grey lines connect clones sharing identical CDR3 sequences within each individual. Cell subsets are downsampled for visualization (see Methods). (right) Box plot showing Shannon’s entropy index (y-axis) at D0 for each of the indicated CD8+ populations. Significance of differences is determined by two-tailed Wilcoxon test. Shannon’s entropy index evaluates the TCR repertoire diversity for each sample. Higher indices indicate higher diversity (i.e., fewer shared clones shown in Circos plot). EM = effector memory; CM = central memory; TEMRA = EM cells re-expressing CD45RA. h, (left) Circos plot of TCR clonality for GPR56+ CD8 EM cells at different timepoints. Segments in the outer circle represent different days in the study (D0, D1, D28). Segments in the inner circle represent males (M) and females (F) for both COVR and HC subjects. Grey lines connect clones sharing identical CDR3 sequences within each sample. Timepoints are downsampled for visualization purposes (see Methods). (right) Box plot showing Shannon’s entropy index (y-axis) of TCR clonality at each of the indicated time points (D0, D1, D28; x-axis) for GPR56+ CD8 EM T-cells (left) and GPR56+ CD8+ TEMRA (right). Significance of differences is determined by two-tailed Wilcoxon test. i, (left) Similar to (h), but showing the shared clones among different timepoints (segments in the outer circle). Segments in the inner circle represent unique clones for each individual. Clones and lines connecting shared clones are colored. Samples with less than 30 cells were filtered out for visualization purposes. (right) Line chart showing frequencies of each clone (y-axis) shown in Circos plot (left) at D0, D1 and D28 for each subject. P-values of paired Wilcoxon test are shown comparing the clone frequency differences among D0, D1 and D28. j, Related to Fig. 3i but showing the frequencies of IFNγ+ NK, IFNγ+ CD45RA+ CD45RO+ TEMRA CD8+ T-cells and IFNγ+ MAIT cells after IL-15 stimulation in vitro. All box plot elements are the same as indicated in Fig. 3. Unadjusted p values are shown.
Extended Data Figure 5.
Extended Data Figure 5.. Changes in immune states in COVID-19-recovered individuals following influenza vaccination.
a, Distributions of gene-level difference of the innate immune receptor (IIR) signature (see Fig. 1f) in classical monocytes separately for females (F) and males (M) [shown as z-scores, on a per gene level, capturing the average difference between COVID Recovered (COVR) at the indicated timepoint (top to bottom: D0, D1, and D28) and healthy control (HC) at D0; see Methods]. Dashed red vertical lines represent the median of the distribution. Dark tick marks at the bottom represent individual genes and colored dots highlight specific genes of interest. Significance of differences from D0 is determined by paired two-tailed Wilcoxon test. b, Similar to (a) but for the non-classical monocytes (see Fig. 1g). c, Similar to Fig. 4d but for non-classical monocytes (see Fig. 1g for the innate receptor signature in non-classical monocytes). d, Similar to Fig. 4b but for COVR-F (red) and COVR-M (blue) only and gene sets shown on top of each plot. Box plots showing the classical monocyte LEG module scores (y-axis) of gene sets from Supplementary Fig. 2: antigen presentation related gene sets, Hallmark Inflammatory response, Hallmark TNF-α signaling via NF-κB, and MS-1 signature from Reyes et al. LEGs from the first three gene sets were found to be repressed in acute COVID-19 patients in Liu et al. e, Similar to (d), but for non-classical monocytes. All box plot elements are the same as indicated in Fig. 4. Unadjusted p values are shown.
Figure 1.
Figure 1.. Study overview and baseline differences.
a, Schematic showing the study concept and design. b, Data generated in the study. Both COVID-19-recovered (COVR) subjects and healthy controls (HC) were enrolled at seven days before vaccination (Day −7) and sampled at the indicated timepoints relative to the day of influenza vaccination. The number of subjects assayed for each data type is indicated. CBC with diff = complete blood count with differential; TBNK = T- and B-lymphocyte and Natural Killer cell phenotyping; SPR = Surface plasmon resonance. c, Bar plots comparing the proportion of CD11c+ dendritic cells (DCs; as the fraction of live cells from flow cytometry) between COVR females (COVR-F; n=15), HC females (HC-F; n=16), COVR males (COVR-M; n=12), and HC males (HC-M; n=11) at day 0 (D0). The statistical significance is determined by two-tailed Wilcoxon test. Error bars indicate the standard error of each group. d, Similar to (c) but for monocytes (from CBC; y-axis) between COVR-F (n=17), COVR-M (n=16), HC-F (n=21), and HC-M (n=19) at baseline (average of Day −7 and D0). e, UMAP of the CITE-seq single cell data showing clustering of cells based on the expression of cell surface protein markers (632,100 single cells from all timepoints with CITE-seq data: days 0, 1, 28). Colored and boxed cell clusters are further explored in (f-i). f, (left) Box plots comparing the innate immune receptor signature scores (see Methods) between HC-F (n=8) and COVR-F (n=12) (left box) and HC-M (n=8) and COVR-M (n=12) (right box) using the CITE-seq classical monocyte pseudobulk expression data at D0. Each point represents a subject. (right) Bubble plot showing the average gene expression of selected genes, including those in the Gene Ontology (GO) “pattern recognition receptor activity” and “immune receptor activity” gene sets. g, Similar to (f) but showing the non-classical monocyte population at D0. h, Similar to (f) but showing the T-cell activation (BTM-M7.3) module scores of CD8+ central memory T cells at D0. Bubble plot showing the average gene expression of the selected genes shared by male and female from the gene set enrichment analysis (see Methods). i, Similar to (h) but showing the CD8+ T-cell effector memory population at D0. All box plots show the median, first and third quantiles (lower and upper hinges) and smallest [lower hinge – 1.5× interquartile range (IQR)] and largest (upper hinge + 1.5× IQR) values (lower and upper whiskers). Unless otherwise noted, statistical significance of difference between groups is determined by two-tailed Wilcoxon test.
Figure 2.
Figure 2.. Sex-specific response differences to influenza vaccination in COVID-19-recovered individuals and matching controls.
a, Schematic of the sex-specific comparisons of vaccine induced changes from baseline at timepoints post vaccination (D1, D7, and D28) between COVR and HC subjects. Analyses applied to subjects under 65 years of age (see Methods). b, Box plots of the D1 Interferon Gamma (IFNγ) transcriptional response score (D1 – D0, computed using genes from the Hallmark “Interferon Gamma Response” gene set) for COVR-F (n=15), COVR-M (n=14), HC-F (n=16), and HC-M (n=14). c, Box plots of the D1 response (D1 – D0) of serum IFNγ protein level for the subjects shown in (b). d, Surface protein expression-based UMAP (as in Fig. 1e) with cells colored by the D1 IFNγ transcriptional response score (D1 – D0; see (b) for the gene set used) within each cell subset for HC-F (n=8), COVR-F (n=12), and HC-M (n=8), COVR-M (n=12). Darker color indicates a greater difference between D1 and D0 for the indicated cell subset. e, Similar to (b), but for the indicated cell subsets (computed using the CITE-seq pseudobulk mRNA expression data for the cell subset) in HC-F (n=8), COVR-F (n=12), HC-M (n=8) and COVR-M (n=12). cDC = conventional/myeloid dendritic cells. f, (left) Box plot showing the D1 transcriptional response score (D1 – D0) of the antigen presentation related genes in classical monocytes for the same subjects in (e) (see Methods). (right) Bubble plot showing the averaged expression of individual leading-edge genes (LEGs) from the antigen presentation genes (see Methods) in classical monocytes. g, Influenza-specific plasmablast (PB; All HA+ CD27+CD38+CD20lowCD21low; see Methods and Supplementary Fig. 3) frequencies at D7 and D0, plotted separately for COVR-F (n=14), HC-F (n=15), COVR-M (n=11), and HC-M (n=9). Lines connect data points from the same subject at D0 and D7. h, Analysis of the D28/D0 microneutralization titer fold-change (FC) for each of the four strains in the seasonal influenza vaccine (columns) in COVR-F and HC-F. Each dot represents one individual. The orange and grey lines indicate the average fold change for the HC-F and COVR-F, respectively. Unadjusted p values are derived from generalized linear models accounting for age, race, influenza vaccination history and baseline influenza titers (see Methods). i, Similar to (h), but for COVR-M and HC-M. All box plots show the median, first and third quantiles (lower and upper hinges) and smallest (lower hinge – 1.5× interquartile range (IQR)) and largest (upper hinge + 1.5× IQR) values (lower and upper whiskers). Unadjusted p values are shown. Unless otherwise noted, statistical significance of difference between groups is determined by two-tailed Wilcoxon test.
Figure 3.
Figure 3.. Contributors to increased day 1 IFNγ responses in COVID-19-recovered males.
a, Schematic illustrating the study questions regarding why COVR-M had elevated early IFNγ responses. b, Box plots comparing the sample means of GPR56 surface expression in CD8+ effector memory T-cells (CD8+ EM) at D0 for COVR-F (n=12), HC-F (n=8), COVR-M (n=12), and HC-M (n=8). c, UMAP of the D0 surface GPR56 protein expression on CD8+ EM from all 40 subjects with CITE-seq data. UMAP was derived using the top 60 variable surface proteins within the CD8+ EM cells (see Methods). d, (top) Same UMAP as (c) but showing the D0 gene-expression signature score computed using genes associated with CD29hi CD8+ T-cells identified earlier in an independent study (Nicolet et al, see Methods). (bottom) Density plot showing the distribution of signature score above in the GPR56+ and GPR56− CD8+ EM. Dashed line indicates the median of the distribution. Significance of the difference between the medians is determined by two-tailed Wilcoxon test at single-cell level. e, Bar plots comparing the proportion of GRP56+ cells (as fractions of CD8+ EM in the CITE-seq data) between the same subjects as in (b) at D0. Significance is determined by two-tailed Wilcoxon test. Error bars indicate the standard error of each group. f, Similar to (d) but showing the bystander T-cell signature score at baseline (D0) (signature genes originated from Bangs et al and Bergamaschi et al, see Methods). g, Box plots comparing the average expression of the indicated cell surface protein markers for the GPR56+ versus GPR56− CD8+ EM at D0 for the same subjects as in (c). Each point represents a subject. h, Representative flow-cytometry contour plots of IFNγ+ and TNFα+ gates within GPR56+ CD45RA+ CD8+ T-cells after IL-15 stimulation in vitro in the indicated groups. The number shown for each gate denotes the percent of parent (i.e., GPR56+ CD45RA+ CD8+ T-cells). i, Boxplots showing the frequencies of IFNγ+ GPR56+ CD45RA+ VM-like CD8+ T-cells (left, as fractions of CD8+ T-cells) and IFNγ+ KIR/NKG2A+ CD45RA+ CD8+ T-cells (right, as fractions of CD8+ T-cells) in the same subjects as in (b) after IL-15 stimulation in vitro. j, Box plots comparing D0 and D1 pseudobulk IL-15 mRNA expression (y-axis) in classical monocytes for the same subjects as in (b). Significance is determined by a linear model accounting for age, race, and influenza vaccination history (see Methods). All box plots show the median, first and third quantiles (lower and upper hinges) and smallest (lower hinge – 1.57× interquartile range (IQR)) and largest (upper hinge + 1.5× IQR) values (lower and upper whiskers). Unless otherwise noted, statistical significance of difference between groups is determined by two-tailed Wilcoxon test.
Figure 4.
Figure 4.. Post mild COVID-19 gene expression imprints in monocytes shifted by influenza vaccination.
a, Schematic showing the study questions. b, Box plots showing the module scores of the innate immune receptor (IIR) signature (see Fig. 1f) in HC-F (n=8), HC-M (n=8), COVR-F (n=12) and COVR-M (n=12) at D0, D1 and D28 using the CITE-seq pseudobulk gene expression data in classical monocytes. The dashed line represents the median D0 score of the HCs of the same sex. Lines connect data points from the same subject at different timepoints. Statistical significance of differences is determined by a mixed-effects model accounting for age, race, and influenza vaccination history (see Methods). Unadjusted p values are shown. c, Similar to (b) but for non-classical monocytes (see Fig. 1g). d, Heatmap showing the expression of the “reversal” genes in classical monocytes (row-standardized; see Extended Data Fig. 5c for non-classical monocytes). Reversal genes are defined as those genes in the baseline IIR signature (see also Fig. 1f) whose expression in COVR subjects at D1 and D28 after vaccination moved towards the baseline (pre-vaccination) expression of HCs. COVR-F (top) and COVR-M (bottom) shown separately; HC are also included for comparison. The rows are genes and columns are individual samples (grouped by subject/timepoint) with timepoint and subject group labels shown at the top, including the same subjects as in (b) at each timepoint. The names of genes that belong to gene sets of functional interest are shown (FDR-corrected enrichment p values are shown). e, Comparison of the proportion of IIR signature genes (see Fig. 1f,g) that show partial reversal in COVR-F versus COVR-M in classical and non-classical monocytes. The mean and 95% confidence intervals (denoted by the bars) are derived from a bootstrapping procedure (see Methods). Significance is determined by the two-tailed Wilcoxon test between the bootstrapped samples. All box plots show the median, first and third quantiles (lower and upper hinges) and smallest (lower hinge – 1.5× interquartile range (IQR)) and largest (upper hinge + 1.5× IQR) values (lower and upper whiskers).

Update of

References

Main Text References

    1. Mina MJ et al. Measles virus infection diminishes preexisting antibodies that offer protection from other pathogens. Science 366, 599–606 (2019). - PMC - PubMed
    1. Tomalka JA, Suthar MS, Diamond MS & Sekaly RP Innate antiviral immunity: how prior exposures can guide future responses. Trends Immunol. 43, 696–705 (2022). - PubMed
    1. Tsang JS et al. Improving Vaccine-Induced Immunity: Can Baseline Predict Outcome? Trends Immunol. 41, 457–465 (2020). - PMC - PubMed
    1. Goodridge HS et al. Harnessing the beneficial heterologous effects of vaccination. Nat. Rev. Immunol 16, 392–400 (2016). - PMC - PubMed
    1. Aaby P, Netea MG & Benn CS Beneficial non-specific effects of live vaccines against COVID-19 and other unrelated infections. Lancet Infect. Dis S1473-3099(22)00498-4 (2022) doi:10.1016/S1473-3099(22)00498-4. - DOI - PMC - PubMed

Methods and Extended Data Figure References

    1. Harris PA et al. Research electronic data capture (REDCap)—A metadata-driven methodology and workflow process for providing translational research informatics support. J. Biomed. Inform 42, 377–381 (2009). - PMC - PubMed
    1. Harris PA et al. The REDCap consortium: Building an international community of software platform partners. J. Biomed. Inform 95, 103208 (2019). - PMC - PubMed
    1. Ravichandran S. et al. Antibody signature induced by SARS-CoV-2 spike protein immunogens in rabbits. Sci. Transl. Med 12, eabc3539 (2020). - PMC - PubMed
    1. Ravichandran S. et al. Longitudinal antibody repertoire in ‘mild’ versus ‘severe’ COVID-19 patients reveals immune markers associated with disease severity and resolution. Sci. Adv 7, eabf2467 (2021). - PMC - PubMed
    1. Tang J. et al. Antibody affinity maturation and plasma IgA associate with clinical outcome in hospitalized COVID-19 patients. Nat. Commun 12, 1221 (2021). - PMC - PubMed

Publication types

MeSH terms