. 2023 Jan 4;13(1):149.
doi: 10.1038/s41598-023-27461-2.

Characterization of metabolic reprogramming by metabolomics in the oncocytic thyroid cancer cell line XTC.UC1

Affiliations

Characterization of metabolic reprogramming by metabolomics in the oncocytic thyroid cancer cell line XTC.UC1

Tomomi Kurashige et al. Sci Rep. .

Abstract

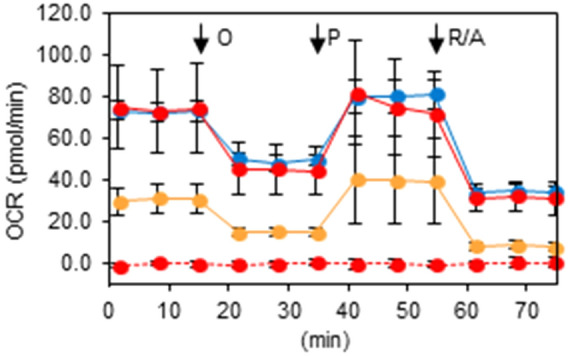
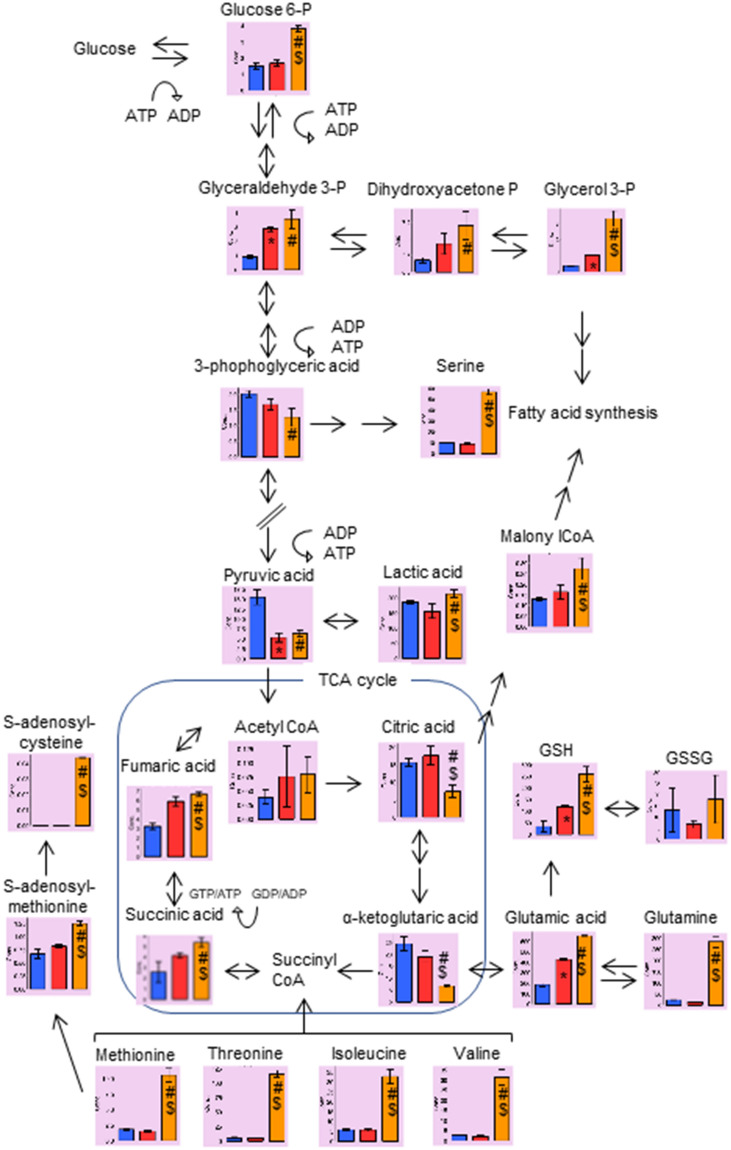
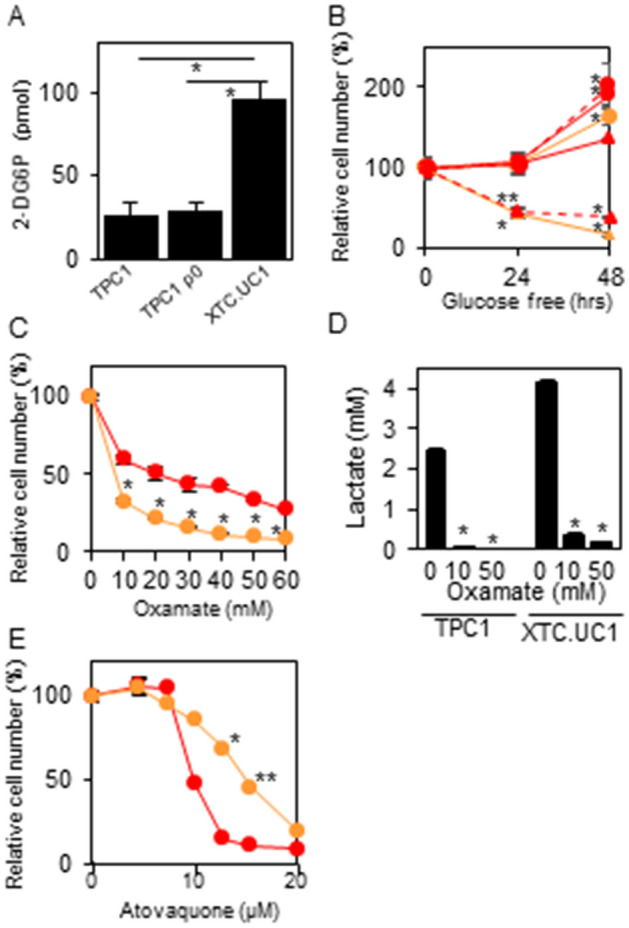
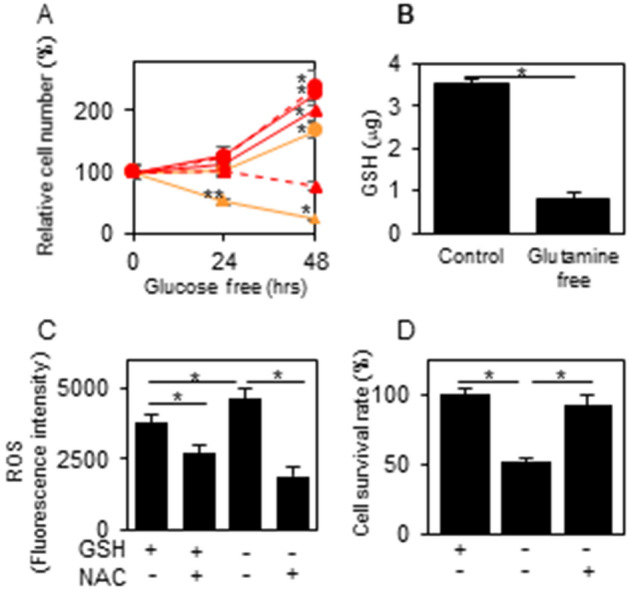
Oncocytic thyroid cancer is characterized by the aberrant accumulation of abnormal mitochondria in the cytoplasm and a defect in oxidative phosphorylation. We performed metabolomics analysis to compare metabolic reprogramming among the oncocytic and non-oncocytic thyroid cancer cell lines XTC.UC1 and TPC1, respectively, and a normal thyroid cell line Nthy-ori 3-1. We found that although XTC.UC1 cells exhibit higher glucose uptake than TPC1 cells, the glycolytic intermediates are not only utilized to generate end-products of glycolysis, but also diverted to branching pathways such as lipid metabolism and the serine synthesis pathway. Glutamine is preferentially used to produce glutathione to reduce oxidative stress in XTC.UC1 cells, rather than to generate α-ketoglutarate for anaplerotic flux into the TCA cycle. Thus, growth, survival and redox homeostasis of XTC.UC1 cells rely more on both glucose and glutamine than do TPC1 cells. Furthermore, XTC.UC1 cells contained higher amounts of intracellular amino acids which is due to higher expression of the amino acid transporter ASCT2 and enhanced autophagy, thus providing the building blocks for macromolecules and energy production. These metabolic alterations are required for oncocytic cancer cells to compensate their defective mitochondrial function and to alleviate excess oxidative stress.


Conflict of interest statement

The authors declare no competing interests.

Figures

Figure 1
Figure 1
Mitochondrial oxygen consumption rates in Nthy-ori 3-1, XTC.UC1, TPC1 and TPC1 ρ0 cells. The oxygen consumption rates were measured at the basal levels and after 2 μM oligomycin (O), 0.25 μM phenylhydrazone (P) and 0.5 μM rotenone/antimycin (R/A) treatments as described in the “Materials and methods”. Blue, Nthy-ori 3-1; yellow, XTC.UC1; red with solid lines, TPC1; red with broken lines, TPC1 ρ0 cells. Data are presented as means ± SE.
Figure 2
Figure 2
Representative data on glycolysis, the TCA cycle, lipid metabolism, glutathione synthesis and methionine metabolism. Blue, Nthy-ori 3-1; yellow, XTC.UC1; red with solid lines, TPC1; red with broken lines, TPC1 ρ0 cells. *, p < 0.01 vs. Nthy-ori 3-1; #, p < 0.01 vs. Nthy-ori 3-1; $, p < 0.01 vs. TPC1 cells. [Reproduced with permission from Human Metabolome Technologies, Inc., Tsuruoka, Japan with some modifications].
Figure 3
Figure 3
Glucose uptake (A), relative cell numbers in cells cultured in the presence and absence of glucose (B), with oxamate (C) or atovaquone (E), and the effect of oxamate on lactate production (D). Glucose uptake, cell number measurements and lactate measurements were performed as described in the “Materials and methods”; briefly, in (CE), the cells were treated with 10–60 mM oxamate or 5–20 μM atovaquone for 48 h. In (B), red circles with solid lines, TPC1/glucose ( +); red triangles with solid lines, TPC1/glucose free; red circles with broken lines, TPC1 ρ0 cells/glucose ( +); red triangles with broken lines, TPC1 ρ0 cells/glucose free; yellow circles, XTC.UC1/glucose ( +); yellow triangles, XTC.UC1/glucose free. In (C,E): red, TPC1; yellow, XTC.UC1 cells. Data are presented as means ± SE. In (B): * and **, p < 0.01 and 0.05, respectively, vs. 0 h; in (A) and (BD): *, p < 0.01; **, p < 0.05.
Figure 4
Figure 4
Effects of glutamine depletion on cell survival in XTC.UC1, TPC1 and TPC1 ρ0 cells (A), and on GSH and ROS productions and cell survival in XTC.UC1 cells treated with/without NAC (BD). GSH and ROS measurements and cell number measurements were performed as described in the “Materials and methods”; briefly, the cells were cultured in glutamine-containing or free medium for 48 h in (B), and in glutamine-containing or free medium with/without 4 mM NAC for 48 h in (C,D). In (A): red circles with solid lines, TPC1/ glutamine (+); red triangles with solid lines, TPC1/ glutamine free; red circles with broken lines, TPC1 ρ0 cells/ glutamine (+); red triangles with broken lines, TPC1 ρ0 cells/ glutamine free; yellow circles, XTC.UC1/ glutamine (+); yellow triangles, XTC.UC1/ glutamine free. Data are presented as means ± SE. In (A): * and **, p < 0.01 and 0.05, respectively, vs. 0 h; in (BD): *, p < 0.01.
Figure 5
Figure 5
Intracellular amino acid concentrations in Nthy-ori 3-1, TPC1 and XTC.UC1 cells (A); mRNA expression of amino acid transporters LAT1 and ASCT2 (B); autophagy activities in XTC.UC1 and TPC1 cells (B,C); and the effect of the autophagy inhibitor chloroquine on autophagic activity and intracellular amino acid levels in XTC.UC1 cells (D,E). The results in (A) are from Supplementary Fig. S1, and RT-PCR for LAT1 and ASCT2, mRNAs, WB for LC3, p62 and β-actin and intracellular amino acid measurements were performed as described in the “Materials and methods”. In A, blue, Nthy-ori 3-1; yellow, XTC.UC1; red, TPC1 cells. Data are presented as means ± SE (n = 3 for amino acid levels) or range (n = 2 for RT-PCR). *, p < 0.01 vs. Nthy-ori 3-1; #, p < 0.01 vs. Nthy-ori 3-1; $, p < 0.01 vs. TPC1 cells. In WB in (C,D), the blots were cropped, and uncropped images are shown in Supplementary Fig. S4A,B.

References

    1. McFadden, D. G. & Sadow, P. M. Genetics, diagnosis, and management of Hürthle cell thyroid neoplasms. Front. Endocrinol. 12, 696386. 10.3389/fendo.2021.696386 (2021). - PMC - PubMed
    1. Asa, S. L. & Mete, O. Oncocytic change in thyroid pathology. Front. Endocrinol.12, 678119. 10.3389/fendo.2021.678119 (2021). - PMC - PubMed
    1. Corver WE, et al. Near-haploidization significantly associates with oncocytic adrenocortical, thyroid, and parathyroid tumors but not with mitochondrial DNA mutations. Genes Chromosomes Cancer. 2014;53:833–844. doi: 10.1002/gcc.22194. - DOI - PubMed
    1. Gopal RK, et al. Widespread chromosomal losses and mitochondrial DNA alterations as genetic drivers in Hurthle cell carcinoma. Cancer Cell. 2018;34:242–255.e245. doi: 10.1016/j.ccell.2018.06.013. - DOI - PMC - PubMed
    1. Ganly I, et al. Integrated genomic analysis of Hurthle cell cancer reveals oncogenic drivers, recurrent mitochondrial mutations, and unique chromosomal landscapes. Cancer Cell. 2018;34:256–270.e255. doi: 10.1016/j.ccell.2018.07.002. - DOI - PMC - PubMed

Publication types

Supplementary concepts