. 2023 Jan 4;6(1):8.
doi: 10.1038/s42003-022-04404-7.

Transmembrane protein 135 regulates lipid homeostasis through its role in peroxisomal DHA metabolism

Affiliations

Transmembrane protein 135 regulates lipid homeostasis through its role in peroxisomal DHA metabolism

Michael Landowski et al. Commun Biol. .

Abstract

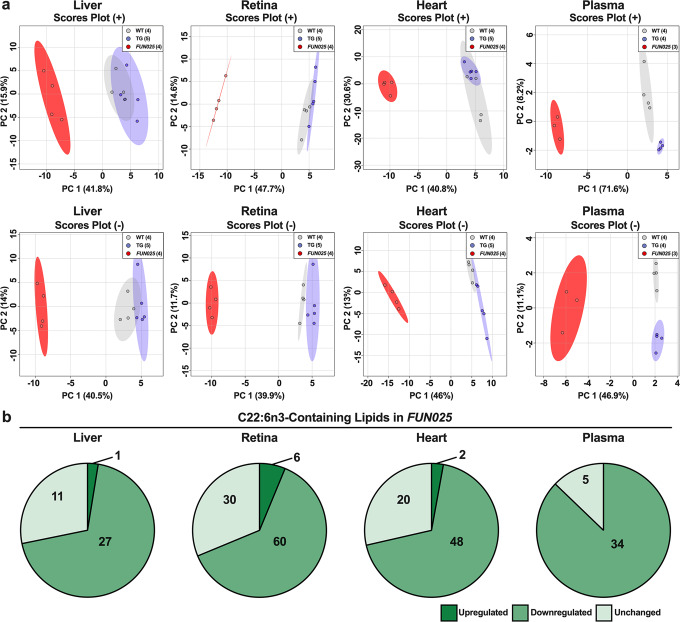
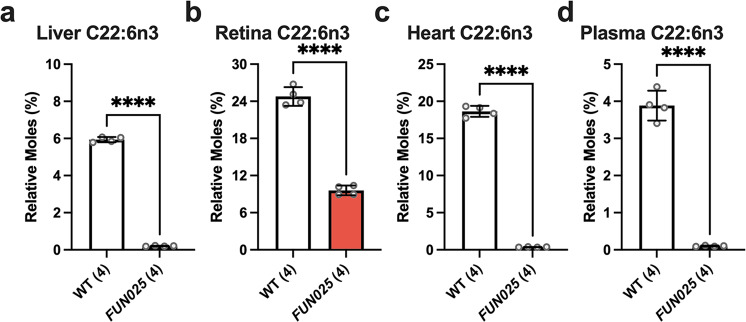
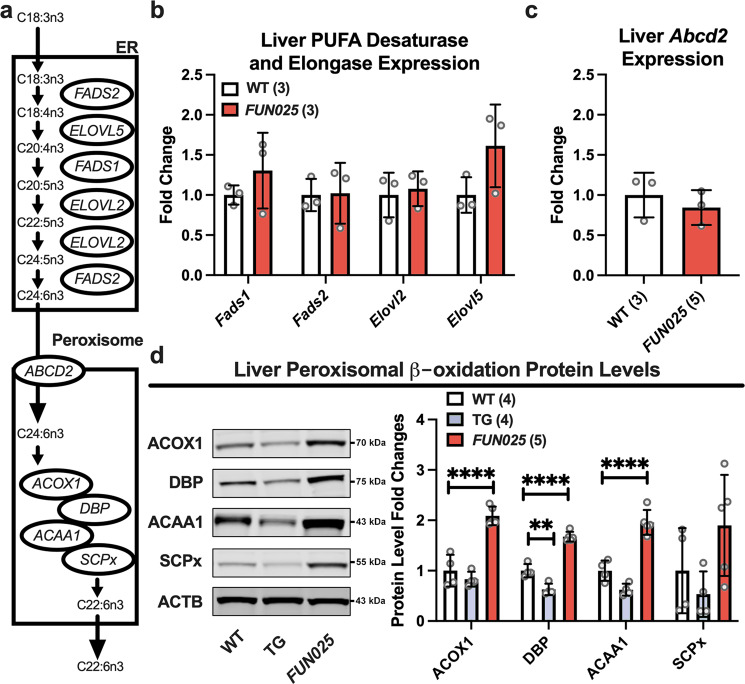
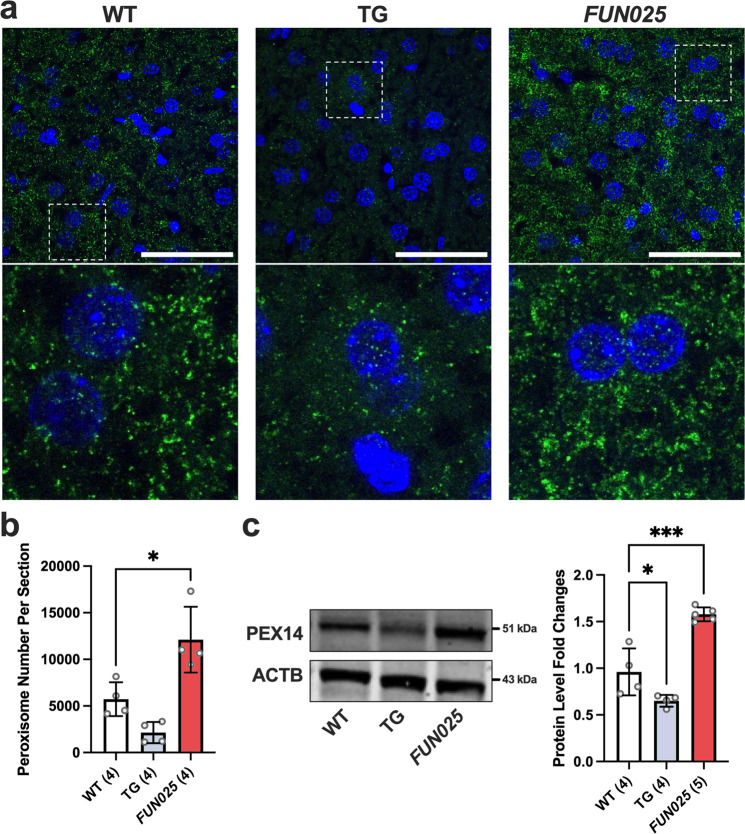
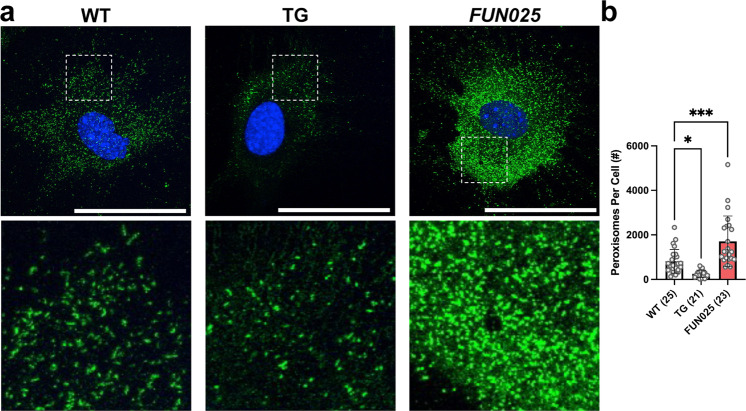
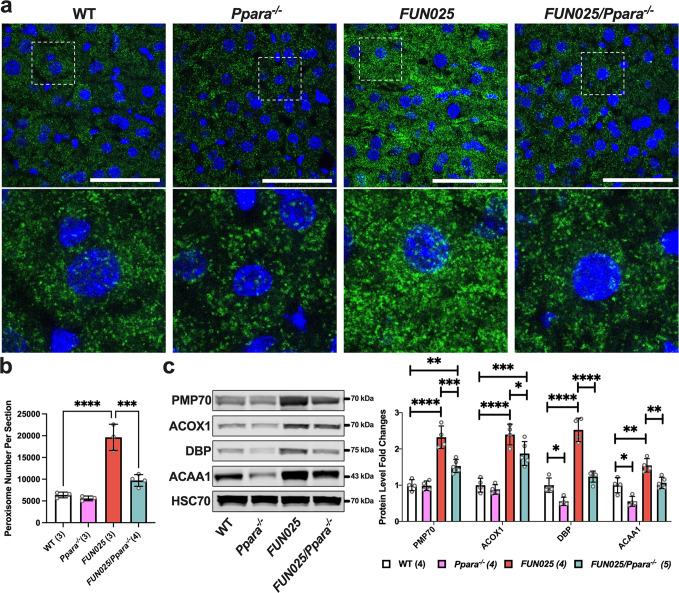
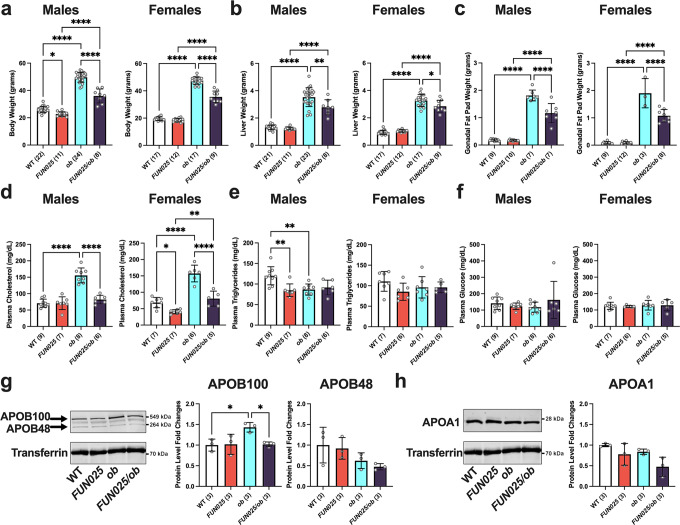
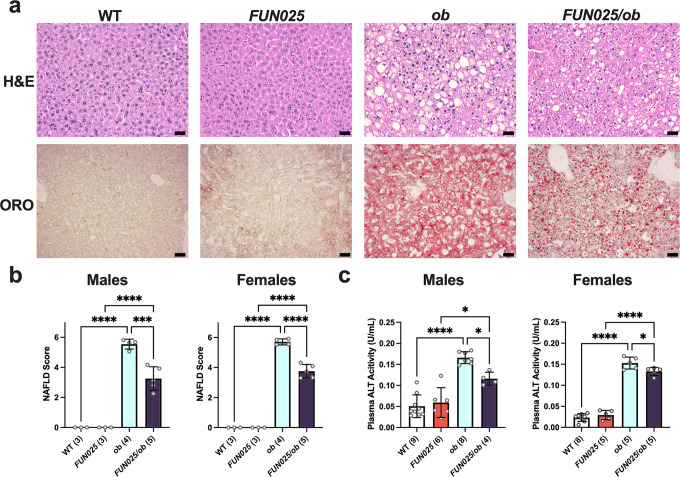
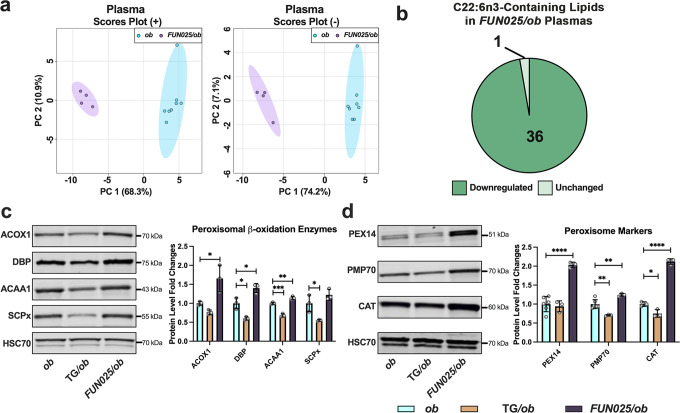
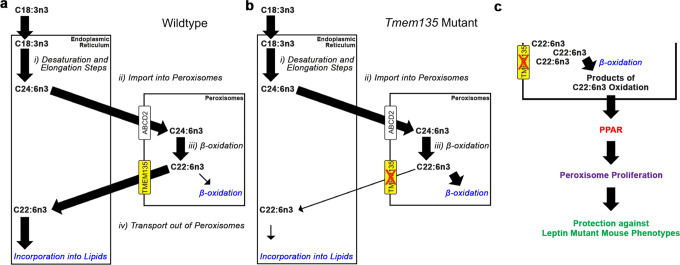
Transmembrane protein 135 (TMEM135) is thought to participate in the cellular response to increased intracellular lipids yet no defined molecular function for TMEM135 in lipid metabolism has been identified. In this study, we performed a lipid analysis of tissues from Tmem135 mutant mice and found striking reductions of docosahexaenoic acid (DHA) across all Tmem135 mutant tissues, indicating a role of TMEM135 in the production of DHA. Since all enzymes required for DHA synthesis remain intact in Tmem135 mutant mice, we hypothesized that TMEM135 is involved in the export of DHA from peroxisomes. The Tmem135 mutation likely leads to the retention of DHA in peroxisomes, causing DHA to be degraded within peroxisomes by their beta-oxidation machinery. This may lead to generation or alteration of ligands required for the activation of peroxisome proliferator-activated receptor a (PPARa) signaling, which in turn could result in increased peroxisomal number and beta-oxidation enzymes observed in Tmem135 mutant mice. We confirmed this effect of PPARa signaling by detecting decreased peroxisomes and their proteins upon genetic ablation of Ppara in Tmem135 mutant mice. Using Tmem135 mutant mice, we also validated the protective effect of increased peroxisomes and peroxisomal beta-oxidation on the metabolic disease phenotypes of leptin mutant mice which has been observed in previous studies. Thus, we conclude that TMEM135 has a role in lipid homeostasis through its function in peroxisomes.


Conflict of interest statement

The authors declare no competing interests.

Figures

Fig. 1
Fig. 1. Docosahexaenoic polyunsaturated fatty acid-containing lipids are reduced in Tmem135 mutant tissues.
a Principal component analysis of lipids detected in the positive (+) ion mode and negative (−) ion mode of male WT, Tmem135 TG (TG), and Tmem135FUN025/FUN025 (FUN025) livers, retinas, hearts, and plasmas based on log10 lipid concentrations. Number in parentheses represent the N of independent mouse samples per genotype used in the experiment. b Pie graphs of docosahexaenoic acid (DHA, C22:6n3)-containing lipids that were significantly upregulated (dark green) or downregulated (medium green) as well as unchanged (light green) in Tmem135FUN025/FUN025 tissues compared to WT. Numbers denote the total of lipids within the category. All altered lipid species can be found in Supplementary Tables 6–9. Significance was determined by one-way ANOVA with post hoc Tukey’s test between WT and Tmem135FUN025/FUN025 livers (P < 0.05).
Fig. 2
Fig. 2. Docosahexaenoic polyunsaturated fatty acid concentrations are reduced in Tmem135 mutant tissues.
Bar graphs depicting relative moles of docosahexaenoic acid (DHA, C22:6n3) quantified by gas chromatography mass spectrometry (GC-MS) in four 2.5-month-old wildtype (WT) (3 male/1 female) and Tmem135FUN025FUN025 (FUN025) (2 male/2 female) livers (a), retinas (b), hearts (c), and plasmas (d). All fatty acid data can be found in Table S3. **** indicates P < 0.0001 significance by two-way Student’s t test. Number in parentheses represents the N of independent mouse samples per genotype used in the experiment. Dots represent individual data points. Data are presented as mean ± SD.
Fig. 3
Fig. 3. Peroxisomal beta-oxidation enzymes are increased in Tmem135 mutant livers.
a Schematic of the Sprecher pathway of docosahexaenoic acid (C22:6n3) synthesis from alpha-linolenic acid (C18:3n3) through a series of elongation and desaturation steps in the endoplasmic reticulum (ER) that is finished within peroxisomes via their beta-oxidation machinery. b Gene expression analysis of the ER-localized Fatty acid desaturase 1 (Fads1) and 2 (Fads2) and Elongation of very-long-chain fatty acids-like 2 (Elovl2) and 5 (Elovl5) involved in the Sprecher pathway in the livers of three 2.5-month-old female WT and Tmem135FUN025/FUN025 (FUN025) mice. c Gene expression analysis of ATP binding cassette subfamily D member 2 (Abcd2) in the livers of three 2.5-month-old female WT and Tmem135FUN025/FUN025 mice. Ribosomal protein lateral stalk subunit P0 (Rlplp0) served as the housekeeping gene in these studies. d Western blot analysis of peroxisomal beta-oxidation enzymes including acyl-CoA oxidase 1 (ACOX1), D-bifunctional protein (DBP), acetyl-Coenzyme A acyltransferase 1 (ACAA1), and sterol carrier protein x (SCPx) using liver lysates from 2.5-month-old WT, Tmem135 TG (TG), and Tmem135FUN025/FUN025 mice. ACTB served as the loading control for these experiments. 4 WT (2 males/2 females), 4 Tmem135 TG (2 males/2 females), and 5 Tmem135FUN025/FUN025 (3 males/2 females) were used in these experiments. Asterisks (** and ****) indicates post hoc Tukey test for a P < 0.01 and P < 0.0001 significance following a significant difference detected by one-way ANOVA. Dots represent individual data points. The number in parentheses represents the N of independent mouse samples per genotype used in the experiment. The protein size next to the immunoblot images denotes the size of the immunoband measured for this analysis. These experiments were repeated twice to ensure reproducibility. Data are presented as mean ± SD.
Fig. 4
Fig. 4. TMEM135 regulates the number of peroxisome biogenesis factor 14 (PEX14) positive peroxisomes in mice.
a Representative 100x immunohistochemical images of PEX14 labeled (green) and DAPI stained (blue) WT, Tmem135 TG (TG), and Tmem135FUN025/FUN025 (FUN025) livers. The white boxes in these images were expanded to highlight differences in PEX14-positive peroxisome staining between these genotypes. Scale bar for images = 50 microns. b Quantitation of PEX14-positive peroxisomes from the 100x images of WT (2 males/2 females), Tmem135 TG (1 male/3 females), and Tmem135FUN025/FUN025 (2 males/2 females) livers using the Analyze Particles function in ImageJ. c Western blot analysis of peroxisome biogenesis factor 14 (PEX14) using livers from 2.5-month-old WT (2 males/2 females), Tmem135 TG (2 males/2 females), and Tmem135FUN025/FUN025 (3 males/2 females) mice. ACTB served as the loading control for this Western blot experiments. Asterisks (* and ***) indicates post hoc Tukey test for a P < 0.05 and P < 0.001 significance following a significant difference detected by one-way ANOVA. Number in parentheses represent the N of independent mouse samples per genotype used in the experiment. Dots represent individual data points. The protein size next to the immunoblot images denotes the size of the immunoband measured for this analysis. Data are presented as mean ± SD.
Fig. 5
Fig. 5. TMEM135 regulates peroxisome proliferation in vitro.
a Representative 60x immunohistochemical images of peroxisome biogenesis factor 14 (PEX14) labeled (green) and DAPI stained (blue) WT, Tmem135 TG (TG), and Tmem135FUN025/FUN025 (FUN025) fibroblasts. The white boxes in these images were expanded to show differences in the peroxisome number between these cells. Scale bar for images = 50 microns. b Quantitation of PEX14-positive peroxisomes from WT, Tmem135 TG, and Tmem135FUN025/FUN025 livers using the Analyze Particles function in ImageJ. Asterisks (* and ***) indicates post hoc Tukey test for a P < 0.05 and P < 0.001 significance following a significant difference detected by one-way ANOVA. Number in parentheses represent the N of individual fibroblasts per genotype assessed in this experiment. Dots represent individual data points. Data are presented as mean ± SD.
Fig. 6
Fig. 6. Tmem135 mutation activates peroxisome proliferator-activated receptor alpha (PPARa) in the mouse liver.
a Representative 100x immunohistochemical images of PEX14 labeled (green) and DAPI stained (blue) 3-month-old WT, Ppara−/−, Tmem135FUN025/FUN025 (FUN025), and Tmem135FUN025/FUN025/Ppara−/− (FUN025/Ppara−/−) livers. The white boxes in these images were expanded to highlight differences of the PEX14-positive peroxisome staining between these genotypes. Scale bar for images = 50 microns. b Quantitation of PEX14-positive peroxisomes from the 100x images of WT (1 male/ 2 females), Ppara−/− (1 male/2 females), Tmem135FUN025/FUN025 (1 male/2 females), and Tmem135FUN025/FUN025/Ppara−/− (1 male/ 3 females) livers using the Analyze Particles function in ImageJ. c Western blot analysis of peroxisomal proteins in the livers of 3-month-old WT (3 males/1 female), Ppara−/− (2 males/2 females), Tmem135FUN025/FUN025 (2 males/2 females), and Tmem135FUN025/FUN025/Ppara−/− (3 males/2 females) mice. HSC70 served as the loading control for these experiments. Asterisks (*, **, ***, and ****) indicates post hoc Tukey test for a P < 0.05, P < 0.01, P < 0.001, and P < 0.0001 significance following a significant difference detected by one-way ANOVA. PMP70, peroxisomal membrane protein 70. ACOX1, acyl-CoA oxidase 1. DBP, D-bifunctional protein. ACAA1, acetyl-Coenzyme A acyltransferase 1. Dots represent individual data points. Number in parentheses represents N of independent mouse samples per genotype used in the experiment. The protein size next to the immunoblot images denotes the size of the immunoband measured for this analysis. Data are presented as mean ± SD.
Fig. 7
Fig. 7. Tmem135 mutation reduces leptin mutation-induced obesity and dyslipidemia.
a Body, b liver, and c gonadal fat pad weights as well as d plasma cholesterol, e plasma triglyceride, and f plasma non-fasting glucose levels of 3-month-old WT, Tmem135FUN025/FUN025 (FUN025), Lepob/ob (ob), and Tmem135FUN025/FUN025/Lepob/ob (FUN025/ob) male and female mice. Western blot analysis of plasmas from 3-month-old WT, Tmem135FUN025/FUN025, Lepob/ob, and Tmem135FUN025/FUN025/Lepob/ob male mice for g apolipoprotein B100 (APOB100) and B48 (APOB48) and h apolipoprotein A1 (APOA1). Transferrin served as a loading control for these experiments. Number in parentheses represent the N of independent mice or mouse samples per genotype used in the experiment. Dots represent individual data points. The protein size next to the immunoblot images denotes the size of the immunoband measured for this analysis. Asterisks (*, **, and ****) indicate a P < 0.05, P < 0.01, and P < 0.0001 significance by post hoc Tukey test following a significant difference detected by one-way ANOVA. Data are presented as mean ± SD.
Fig. 8
Fig. 8. Tmem135 mutation reduces leptin mutation-induced liver phenotype.
a Representative 20x images of hematoxylin and eosin (H&E) and oil red o (ORO) stained liver sections from 3-month-old male WT, Tmem135FUN025/FUN025 (FUN025), Lepob/ob (ob), and Tmem135FUN025/FUN025/Lepob/ob (FUN025/ob) mice. Scale Bar = 100 microns. b Non-alcoholic fatty liver disease (NAFLD) severity scores. c Plasma ALT activity. Number in parentheses represent the N of independent mouse samples per genotype used in the experiment. Dots represent individual data points. Asterisks (*, ***, and ****) indicates a P < 0.05, P < 0.01, P < 0.001, and P < 0.0001 significance by post hoc Tukey test following a significant difference detected by one-way ANOVA. Data are presented as mean ± SD.
Fig. 9
Fig. 9. Tmem135 mutation decreases docosahexaenoic polyunsaturated fatty acid-containing lipids and increases peroxisomal proteins in leptin mutant mice.
a Principal component analysis of lipids detected in the positive (+) ion mode and negative (–) ion mode of 3-month-old male Lepob/ob (ob) (N = 8) and Tmem135FUN025/FUN025/Lepob/ob (FUN025/ob) (N = 4) plasmas based on log10 concentrations. b Pie graph of docosahexaenoic acid (DHA, C22:6n3)-containing lipids that were significantly downregulated (medium green) and unchanged (light green) in Tmem135FUN025/FUN025/Lepob/ob plasmas compared to Lepob/ob. Numbers denote the total of lipids within the category. All altered lipid species including DHA-containing lipids can be found in Supplementary Table 10. Significance was determined by two-way Student’s t test (P < 0.05). c Western blot analysis of peroxisomal beta-oxidation enzymes including acyl-CoA oxidase 1 (ACOX1), D-bifunctional protein (DBP), acetyl-Coenzyme A acyltransferase 1 (ACAA1), and sterol carrier protein x (SCPx) using liver lysates from 3-month-old male Lepob/ob (N = 3), Tmem135 TG/Lepob/ob (TG/ob) (N = 3) and Tmem135FUN025/FUN025/Lepob/ob (N = 3) mice. d Western blot analysis of peroxisome biogenesis factor 14 (PEX14), peroxisome membrane protein 70 (PMP70), and catalase (CAT) using livers from 3-month-old male Lepob/ob (N = 3–6), Tmem135 TG/Lepob/ob (N = 3) and Tmem135FUN025/FUN025/Lepob/ob (N = 3) mice. HSC70 served as the loading control for these experiments. Asterisks (*, **, ***, and ****) indicates post hoc Tukey test for a P < 0.05, P < 0.01, P < 0.001, and P < 0.0001 significance following a significant difference detected by one-way ANOVA. Dots represent individual data points. The protein size next to the immunoblot images denotes the size of the immunoband measured for this analysis. Data are presented as mean ± SD.
Fig. 10
Fig. 10. Schematic of proposed TMEM135 function.
a Cells depend on the interaction between the endoplasmic reticulum (ER) and peroxisomes to generate docosahexaenoic acid (C22:6n3). (i) The ER synthesizes C24:6n3 from C18:3n3 through a process of sequential desaturation and elongation steps. (ii) The ER transfers C24:6n3 to the cytosol for uptake by peroxisomes through ABCD2. (iii) One round of peroxisomal beta-oxidation converts C22:6n3 from C24:6n3. (iv) C22:6n3 leaves the peroxisome and migrates back to the ER for lipid incorporation. Since we observed reductions in DHA and no decreases of the components involved in steps i through iii in Tmem135 mutant mice, we hypothesized TMEM135 functions by exporting C22:6n3 from the peroxisome. b The consequence of the Tmem135 mutation may direct C22:6n3 away from the ER and toward peroxisomal beta-oxidation for its catabolism, thus accounting for the reduction of DHA in these mice. c The increased peroxisomal beta-oxidation of DHA within peroxisomes of Tmem135 mutant mice may generate or alter ligands required for the activation of peroxisome proliferator-activated receptors (PPARs). The activation of PPARs can lead to the augmentation of peroxisomes and their beta-oxidation enzymes as we observed in Tmem135 mutant mice. We hypothesized that the increased peroxisomes and their beta-oxidation enzymes due to the Tmem135 mutation may confer protection against the development of leptin mutant mouse phenotypes.

References

    1. Athyros VG, et al. Diabetes and lipid metabolism. Hormones (Athens) 2018;17:61–67. doi: 10.1007/s42000-018-0014-8. - DOI - PubMed
    1. Gupta M, et al. Novel emerging therapies in atherosclerosis targeting lipid metabolism. Expert Opin. Investig. Drugs. 2020;29:611–622. doi: 10.1080/13543784.2020.1764937. - DOI - PubMed
    1. Chew H, Solomon VA, Fonteh AN. Involvement of lipids in Alzheimer’s disease pathology and potential therapies. Front. Physiol. 2020;11:598. doi: 10.3389/fphys.2020.00598. - DOI - PMC - PubMed
    1. van Leeuwen EM, et al. A new perspective on lipid research in age-related macular degeneration. Prog. Retin Eye Res. 2018;67:56–86. doi: 10.1016/j.preteyeres.2018.04.006. - DOI - PubMed
    1. Aon MA, Bhatt N, Cortassa SC. Mitochondrial and cellular mechanisms for managing lipid excess. Front. Physiol. 2014;5:282. doi: 10.3389/fphys.2014.00282. - DOI - PMC - PubMed

Publication types

Substances