. 2023 Jan;613(7944):575-581.
doi: 10.1038/s41586-022-05528-w. Epub 2023 Jan 4.

A quantitative map of nuclear pore assembly reveals two distinct mechanisms

Affiliations

A quantitative map of nuclear pore assembly reveals two distinct mechanisms

Shotaro Otsuka et al. Nature. 2023 Jan.

Abstract

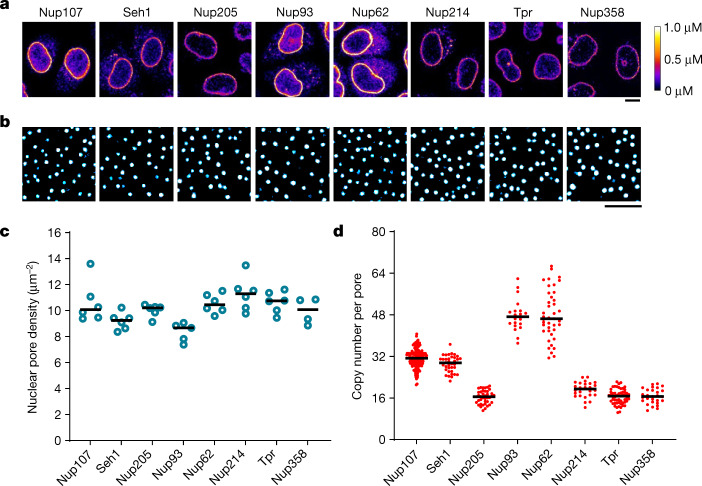
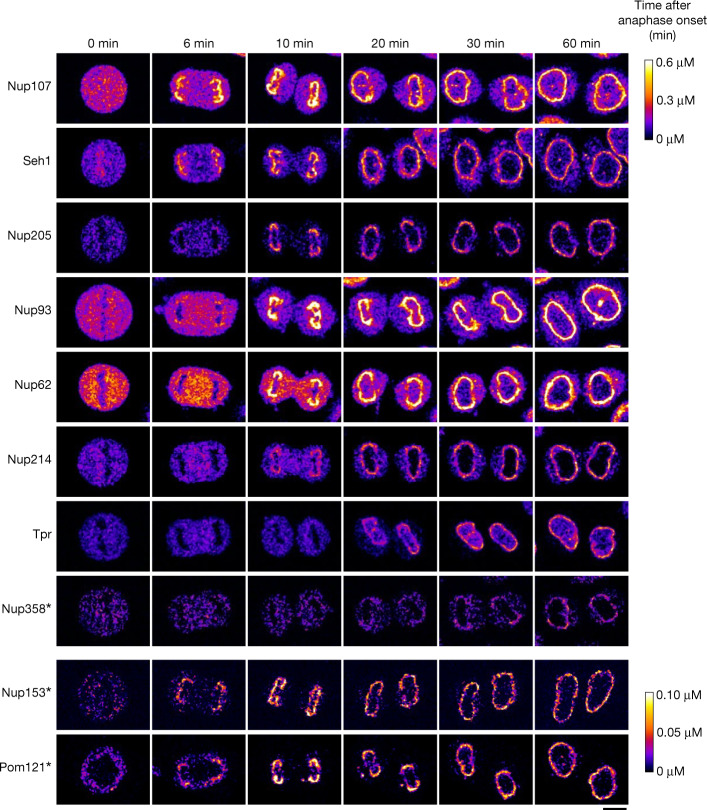
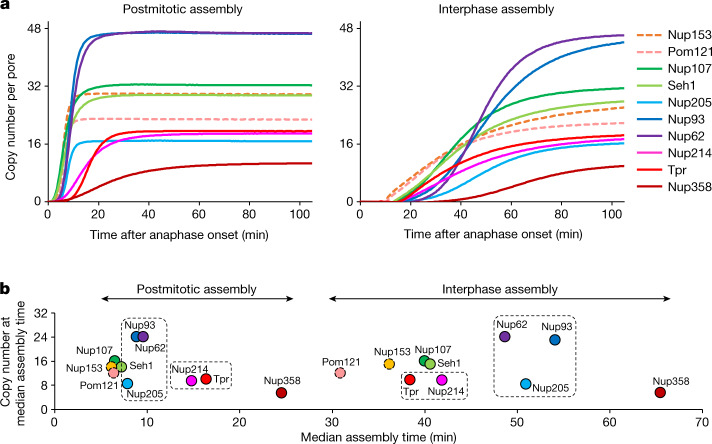
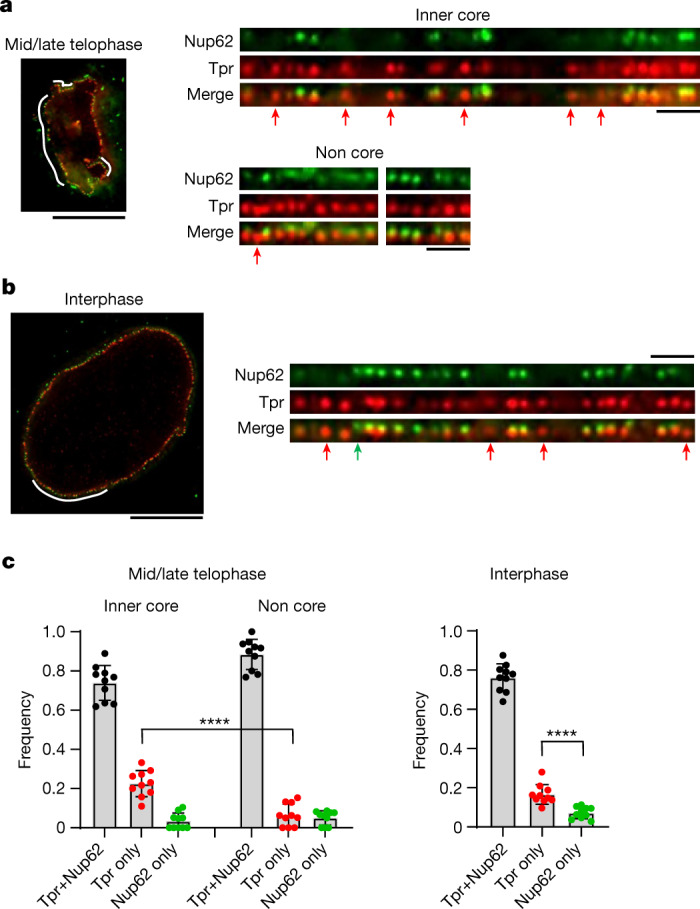
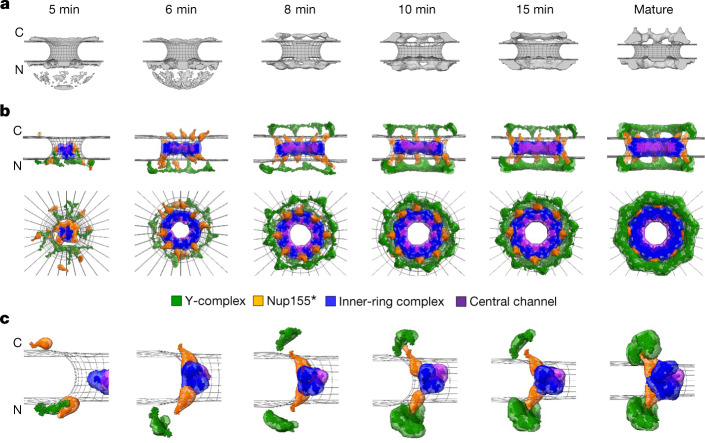
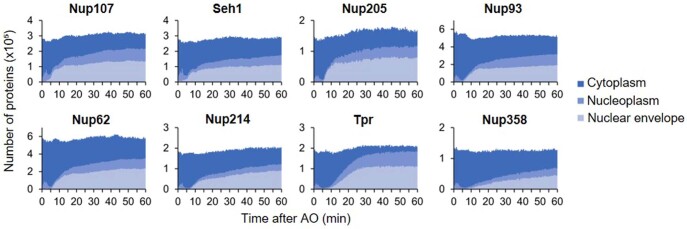
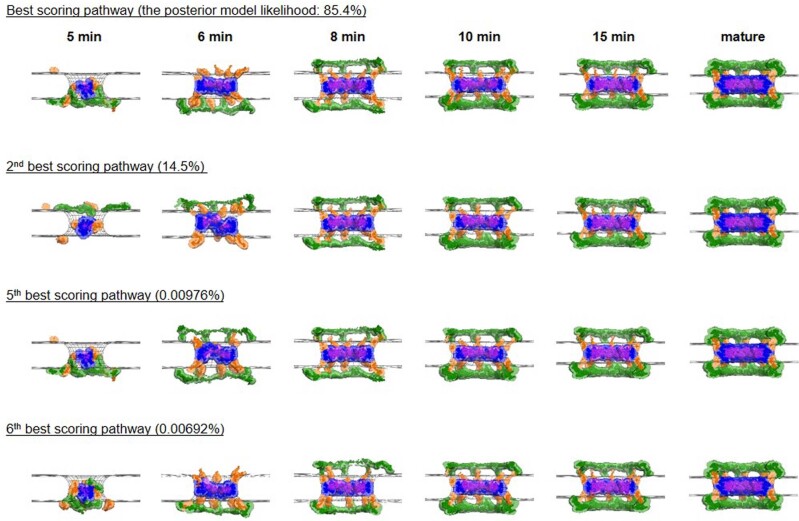
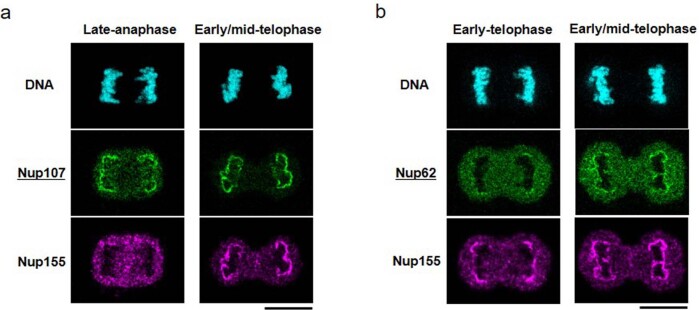
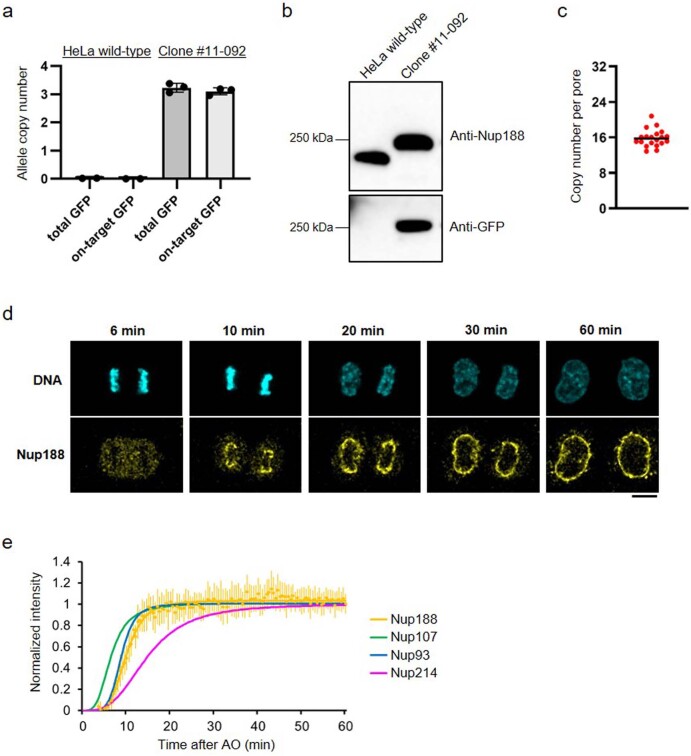
Understanding how the nuclear pore complex (NPC) is assembled is of fundamental importance to grasp the mechanisms behind its essential function and understand its role during the evolution of eukaryotes1-4. There are at least two NPC assembly pathways-one during the exit from mitosis and one during nuclear growth in interphase-but we currently lack a quantitative map of these events. Here we use fluorescence correlation spectroscopy calibrated live imaging of endogenously fluorescently tagged nucleoporins to map the changes in the composition and stoichiometry of seven major modules of the human NPC during its assembly in single dividing cells. This systematic quantitative map reveals that the two assembly pathways have distinct molecular mechanisms, in which the order of addition of two large structural components, the central ring complex and nuclear filaments are inverted. The dynamic stoichiometry data was integrated to create a spatiotemporal model of the NPC assembly pathway and predict the structures of postmitotic NPC assembly intermediates.


Conflict of interest statement

The authors declare no competing interests.

Figures

Fig. 1
Fig. 1. Quantitative imaging of GFP-knock-in Nup cell lines.
a, Confocal microscopy of genome-edited HeLa cells with homozygous expression of mEGFP-tagged Nups. Fluorescence intensity was converted to protein concentration (colour bar) using FCS-calibrated imaging. Images were filtered with a median filter (kernel size: 0.25 × 0.25 μm) for presentation purposes. Scale bar, 10 μm. b,c, Stimulated emission depletion (STED) microscopy of genome-edited cells stained with Nup62 antibody. Cells were imaged (b) and the density of nuclear pores was quantified (c). n = 6 (Nup107), 6 (Seh1), 6 (Nup205), 5 (Nup93), 6 (Nup62), 6 (Nup214), 6 (Tpr) and 4 (Nup358) cells. Scale bar, 1 μm. d, Calculated copy number of Nups per nuclear pore. n = 241 (Nup107), 37 (Seh1), 41 (Nup205), 20 (Nup93), 41 (Nup62), 26 (Nup214), 55 (Tpr) and 28 (Nup358) cells. The horizontal line represents the median. Source data
Fig. 2
Fig. 2. Dynamic concentration maps of Nups after anaphase onset.
HeLa cells whose Nups are endogenously tagged with mEGFP or mCherry were imaged every 30 s by 3D confocal microscopy. Single confocal sections are shown. Images were calibrated by FCS to convert fluorescence intensities into cellular protein concentration (colour bars). Nup153 is heterozygously tagged and Nup358 and Pom121 are subphysiologically expressed (Extended Data Figs. 1 and 2). The bottom colour bar is for Nup153 and Pom121; the top colour bar is for the rest of the Nups. Images were filtered with a median filter (kernel size: 0.25 × 0.25 μm). Scale bar, 10 μm.
Fig. 3
Fig. 3. The molecular assembly order and maturation kinetics are distinct for postmitotic and interphase assembly.
a, The average copy number per nuclear pore computed from mathematical modelling for postmitotic (left) and interphase (right) assembly (details in Methods and Extended Data Figs. 5 and 6). For Nup153 and Pom121 (dashed lines), the absolute amount was estimated using the copy number determined from a previous study (32 for Nup153 and 16 for Pom121). b, The average copy number of individual Nups per nuclear pore are plotted along their median assembly time in postmitotic and interphase assembly pathways. Boxes highlight the Nups that show marked differences in their order of assembly between the two pathways. Source data
Fig. 4
Fig. 4. Observation of single nuclear pores by super-resolution microscopy confirms the recruitment of Tpr precedes Nup62 in the interphase assembly pathway.
a,b, Three-dimensional STED imaging of Nup62–mEGFP genome-edited cells stained with a GFP nanobody and an anti-Tpr antibody at mid/late telophase (a) and interphase (b). Scale bars: left, 10 μm; right, 1 μm. The regions of the nuclear envelope indicated by white lines (left) are flattened and displayed (right). Nuclear pores that contain only Tpr or Nup62 are indicated by red and green arrows, respectively. c, The frequency of nuclear pores that contain both Tpr and Nup62, only Tpr or only Nup62 at each cell cycle stage. Data are from 10 cells for each stage. Data are mean ± s.d. ****P = 0.000017 (mid/late telophase) and ****P = 0.000080 (interphase), unpaired two-tailed t-test. Source data
Fig. 5
Fig. 5. Integrative model of the postmitotic NPC assembly pathway.
a, Protein density (grey) overlaid with the nuclear envelope surface (wireframe model, grey) at each time point used for integrative modelling. C, cytoplasm; N, nucleoplasm. The dome-like density in the nucleoplasmic side at 5 and 6 min is the noise from electron tomography. b, The best-scoring model of the postmitotic assembly pathway (top and side views). The uncertainty of each Nup localization is indicated by the density of the corresponding colour. The Y-complex is shown in green; an isolated fraction of Nup155 that is not forming a complex with Nup93, Nup188 and Nup205 is shown in orange; Nup93–Nup188–Nup155 and Nup205–Nup93–Nup155 complexes are in blue; and the Nup62–Nup58–Nup54 complex is in purple. c, The enlargement of one of the spokes. The model has a much higher score than all the other lower-scoring pathways (Extended Data Fig. 8). The pseudoatomic model of the native NPC structure, we imposed as the endpoint of the assembly pathway does not include the Y-complex-bound fraction of Nup205 or the Nup214-bound fraction of Nup62, and thus contains only 16 of the 40 copies of Nup205, and 32 of the 48 copies of Nup62 in the fully mature NPC. How the remaining 24 copies of Nup205 and 16 copies of Nup62 are assembled remains elusive.
Extended Data Fig. 1
Extended Data Fig. 1. Southern blotting of genome-edited cell clones.
Genomic DNA of each cell clone was digested with restriction enzymes and the fragments were detected by probes for Nup93 (a), Seh1 (b), Nup153 (c), and Pom121 (d), as well as GFP (ac) and mCherry (d). The size of the fragments and the probe-binding regions are illustrated in the bottom panels. The clones indicated in red were used for this study. We regarded the clone #32 of Pom121-mCherry as subhomozygous because the protein abundance was much less than expected although the blot indicated homozygous tagging. The following Nup cell lines were validated to be homozygously-tagged in previous reports (Tpr, Nup214 and Nup358; Nup107; Nup205; Nup62).
Extended Data Fig. 2
Extended Data Fig. 2. Immunoblot analysis of mEGFP-Nup205 (a,b) and mEGFP-Nup358 (c,d) cell lysates.
The membranes were cut at the position of around 200 kDa. The membranes above 200 kDa were blotted with antibodies against Nup205 (a) and Nup358 (c), and the membranes below 200 kDa were blotted with an antibody against Vinculin for loading control. The clone 081 (a) and 097 (c) are the cell lines that are used in this study. (b,d) The relative intensity of the bands for GFP-tagged Nups over endogenous Nups. The plots for Nup205 and Nup358 are from 9 and 8 pairs of bands (GFP-tagged vs endogenous) from 4 and 3 independent experiments, respectively. The mean is depicted as a horizontal line and the whiskers show the standard deviation. Source data
Extended Data Fig. 3
Extended Data Fig. 3. NPC assembly relies on and consumes almost half of the material inherited from the mother cell within one hour after mitosis.
FCS-calibrated 3D confocal microscopy was performed as in Fig. 2, and the Nup copy number was quantified in whole dividing cells (for details see Methods). The number of Nups in cytoplasm (dark blue), nucleoplasm (medium dark blue) and nuclear envelope (light blue) are plotted against time after anaphase onset. The plot is the mean of 15, 20, 13, 14, 22, 22, 19, and 24 cells for Nup107, Seh1, Nup205, Nup93, Nup62, Nup214, Tpr and Nup358, respectively. Source data
Extended Data Fig. 4
Extended Data Fig. 4. GFP-tagged Nups are recruited to the NPCs rather than nonspecifically accumulated on the NE.
a, Three-dimensional stimulated emission depletion (3D-STED) imaging of a Nup62-mEGFP genome-edited cell at early telophase. The region of the nuclear envelope indicated by a white line in the top image is flattened and shown in the bottom. Scale bars, 1 μm. The density of the Nup62 spots was 14.6 ± 2.6 NPCs/μm2 (from 6 cells), which is consistent with our previous EM observation of the NPC density of 12–16 NPCs/μm2 in early telophase cells. b, 2D-STED imaging of a mEGFP-Nup107 genome-edited cell at early telophase that were stained with anti-GFP and anti-Elys antibodies. Enlarged images indicated by white boxes in the top images are shown in the bottom panel. Scale bars, 1 μm. Source data
Extended Data Fig. 5
Extended Data Fig. 5. Postmitotic and interphase assembly are spatially distinguished for the first hour after mitotic exit and thus their kinetics can be decomposed.
a, Time-lapse 3D imaging of Nup93-mEGFP genome-edited cell. Single confocal sections of SiR-DNA and GFP channels are shown. Images were filtered with a median filter (kernel size: 0.25 × 0.25 μm). Scale bar, 10 μm. Time after AO is indicated. b, The fluorescence intensities at non-core (brown) and inner-core (yellow) regions were quantified. Dots represent the average and s.d. of measurements from 14 cells. The intensities were fitted with a sequential model of NPC assembly (bold lines) that allows for different population and rate constants for postmitotic and interphase assembly (described in detail in Methods and Supplementary Table 3). c,d, Decomposed kinetics of postmitotic (c) and interphase (d) assembly from (b). Source data
Extended Data Fig. 6
Extended Data Fig. 6. Kinetic decomposition of the two assembly processes for each nucleoporin.
The fluorescence intensities at non-core (brown) and inner-core (yellow) regions were plotted and fitted with a sequential model of NPC assembly (bold lines) as in Extended Data Fig. 5. Dots represent the average and s.d. of measurements from 15, 20, 13, 14, 22, 22, 19, 24, 14 and 13 cells for Nup107, Seh1, Nup205, Nup93, Nup62, Nup214, Tpr, Nup358, Nup153, and Pom121, respectively. Single confocal slices of cells at 20 min, 40 min, and 60 min after AO are shown. Images were filtered with a median filter (kernel size: 0.25 × 0.25 μm) for presentation purposes. Scale bars, 10 μm. Source data
Extended Data Fig. 7
Extended Data Fig. 7. Computed parameters for the nucleoporin assembly kinetics and the remarkable difference between postmitotic and interphase assembly.
a, An example of computed quantities (Nup358, interphase assembly). b, Illustrations of median assembly time of nucleoporins in postmitotic (left) and interphase (right) assembly superimposed onto a simplified scheme of the NPC. The median assembly time of individual nucleoporins are displayed on a pseudo-colour scale. c, Plots of Nup assembly duration along the median assembly time for postmitotic and interphase assembly pathways. The crosses indicate the 95% confidence intervals. The dots are the mean values. Values are listed in Supplementary Table 3. The long straight line shows the result of a linear regression to the mean values. The gray area is the 95% confidence interval of the linear regression. Theoretically, for a sequential assembly mechanism where late steps depend on early steps, the observed ensemble kinetics of a late binding protein must contain the history of all previous events (see Methods for details). Indeed, postmitotic assembly showed a strong positive linear correlation, indicating a sequential assembly mechanism, which for example implies that Nup62 is incorporated into the NPC before Tpr can bind.
Extended Data Fig. 8
Extended Data Fig. 8. The variations of the integrative models for postmitotic assembly pathway.
Detailed views of the best and lower-scoring pathways. The side views of the 3 spokes are shown. The NE surface is indicated by wireframe model (grey). The uncertainty of each Nup localization is indicated by the density of the corresponding color: The Y-complex (green), isolated fraction of Nup155 (orange), Nup93-Nup188-Nup155 and Nup205-Nup93-Nup155 complexes (blue), and Nup62-Nup58-Nup54 complex (purple). The posterior model likelihood for each pathway is indicated (see Methods for details). The variations in the structural models for the intermediates at 5 and 6 min after anaphase onset would be due to their lower protein density (lower signal-to-noise ratio) in the electron tomography images.
Extended Data Fig. 9
Extended Data Fig. 9. Nup155 assembles at a similar timing to Nup62 in postmitotic assembly pathway.
a,b, Immunofluorescence with an anti-Nup155 antibody and a GFP-Nanobody. Cells at anaphase and telophase were imaged by confocal microscopy. mEGFP-Nup107 (a) and Nup62-mEGFP (b) genome-edited cells were used. The cell nuclei were stained with SiR-DNA. Scale bars, 10 μm.
Extended Data Fig. 10
Extended Data Fig. 10. Postmitotic assembly kinetics of Nup188 is similar to other inner ring components.
a, Digital PCR analysis of Nup188-mEGFP genome-edited cells for assessing the homozygous tagging. Allele copy numbers of GFP integrations and on-target GFP integrations are quantified. The data are from 2 and 3 measurements for wild-type and Nup188-mEGFP genome-edited HeLa cells. Error bars represent the s.d. of the mean. b, Immunoblot analysis of Nup188-mEGFP cells using antibodies against Nup188 and γ-Tubulin. Uncropped immunoblot data are shown in Supplementary Fig. 1. c, Calculated copy number of Nup188 per nuclear pore as in Fig. 1. The plot is from 20 cells. The median is depicted as a line. d, Time-lapse 3D imaging of Nup188-mEGFP genome-edited cell. The cell nuclei were stained with silicon–rhodamine (SiR)-DNA. Single confocal sections of SiR and GFP channels are shown. Images were filtered with a median filter (kernel size: 0.25 × 0.25 μm). Scale bar, 10 μm. Time after AO is indicated. e, Postmitotic assembly kinetics of Nup188 was decomposed as in Extended Data Fig. 5. Dots represent the average and s.d. of measurements from 16 cells. The kinetics of Nup107, Nup93 and Nup214 are also shown for comparison. Source data

References

    1. Hampoelz, B., Andres-Pons, A., Kastritis, P. & Beck, M. Structure and assembly of the nuclear pore complex. Annu. Rev. Biophys.48, 515–536 (2019). - PubMed
    1. Lin, D. H. & Hoelz, A. The structure of the nuclear pore complex (an update). Annu. Rev. Biochem.88, 725–783 (2019). - PMC - PubMed
    1. Baum, D. A. & Baum, B. An inside-out origin for the eukaryotic cell. BMC Biol.12, 76 (2014). - PMC - PubMed
    1. Otsuka, S. & Ellenberg, J. Mechanisms of nuclear pore complex assembly - two different ways of building one molecular machine. FEBS Lett.592, 475–488 (2018). - PMC - PubMed
    1. Franz, C. et al. MEL-28/ELYS is required for the recruitment of nucleoporins to chromatin and postmitotic nuclear pore complex assembly. EMBO Rep.8, 165–172 (2007). - PMC - PubMed

Publication types

Substances