. 2023 Jan;613(7944):534-542.
doi: 10.1038/s41586-022-05562-8. Epub 2023 Jan 4.

Synaptic gradients transform object location to action

Affiliations

Synaptic gradients transform object location to action

Mark Dombrovski et al. Nature. 2023 Jan.

Erratum in

  • Publisher Correction: Synaptic gradients transform object location to action.
    Dombrovski M, Peek MY, Park JY, Vaccari A, Sumathipala M, Morrow C, Breads P, Zhao A, Kurmangaliyev YZ, Sanfilippo P, Rehan A, Polsky J, Alghailani S, Tenshaw E, Namiki S, Zipursky SL, Card GM. Dombrovski M, et al. Nature. 2023 Mar;615(7954):E26. doi: 10.1038/s41586-023-05930-y. Nature. 2023. PMID: 36914868 Free PMC article. No abstract available.

Abstract

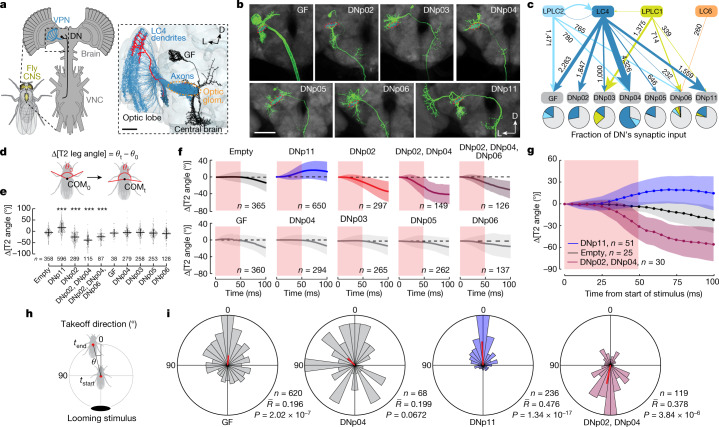
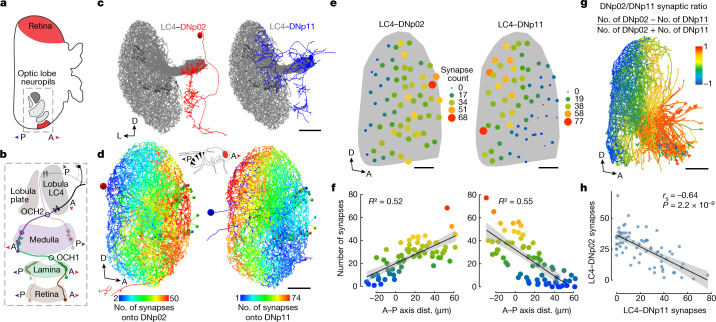
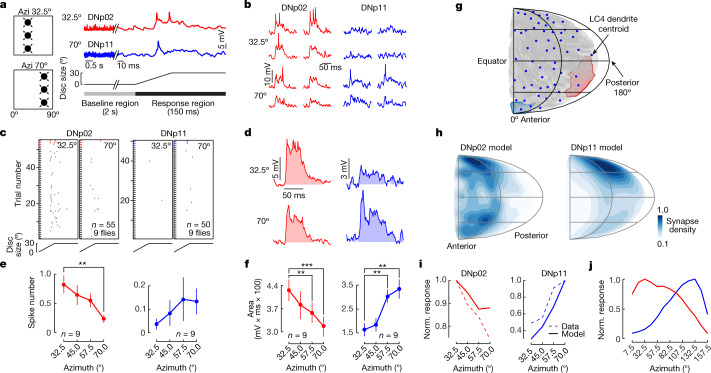
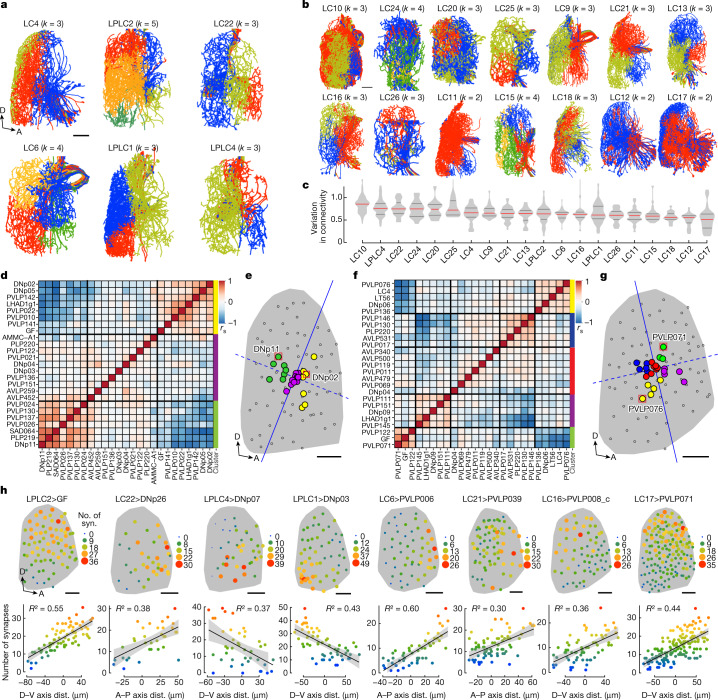
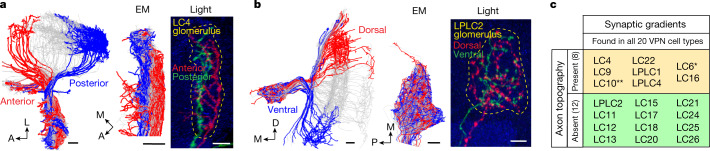
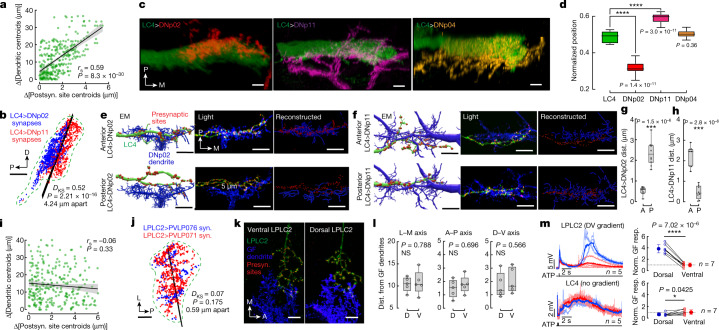
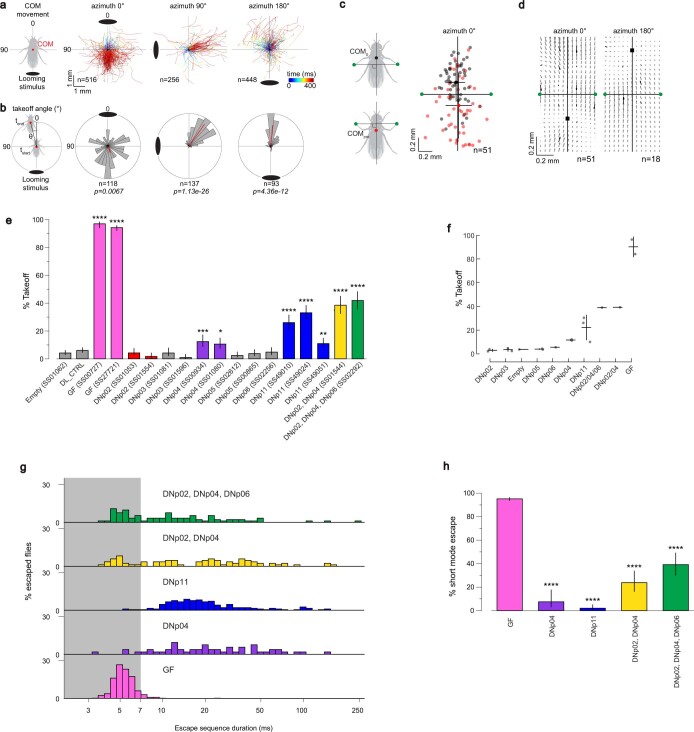
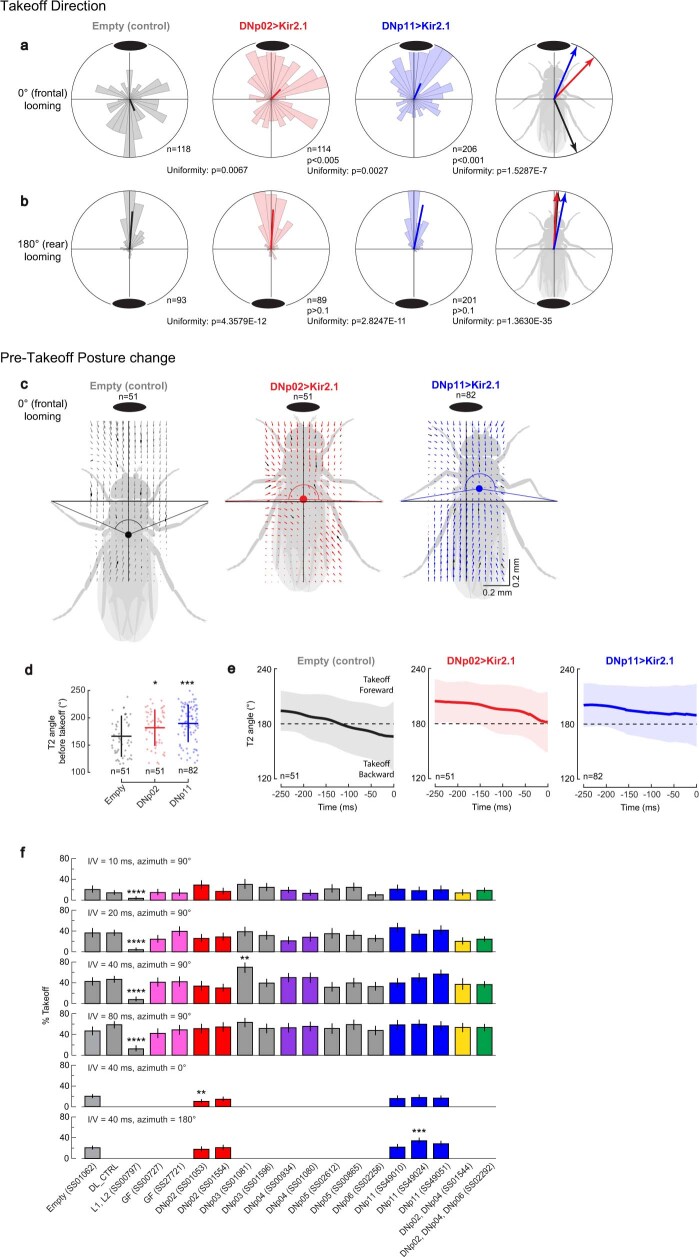
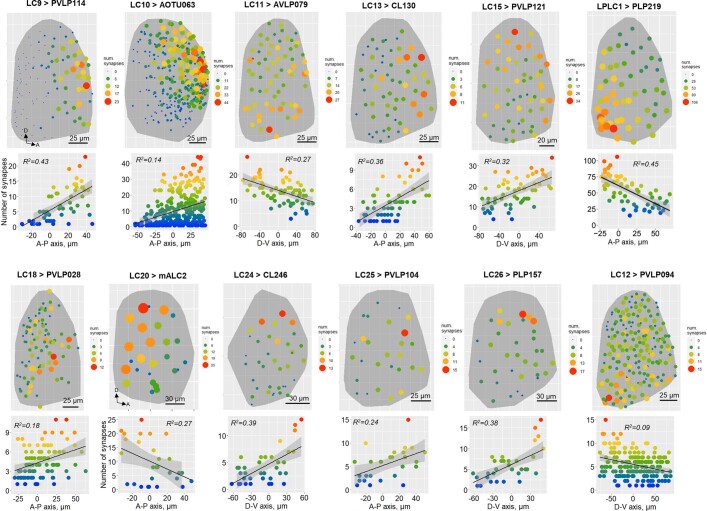
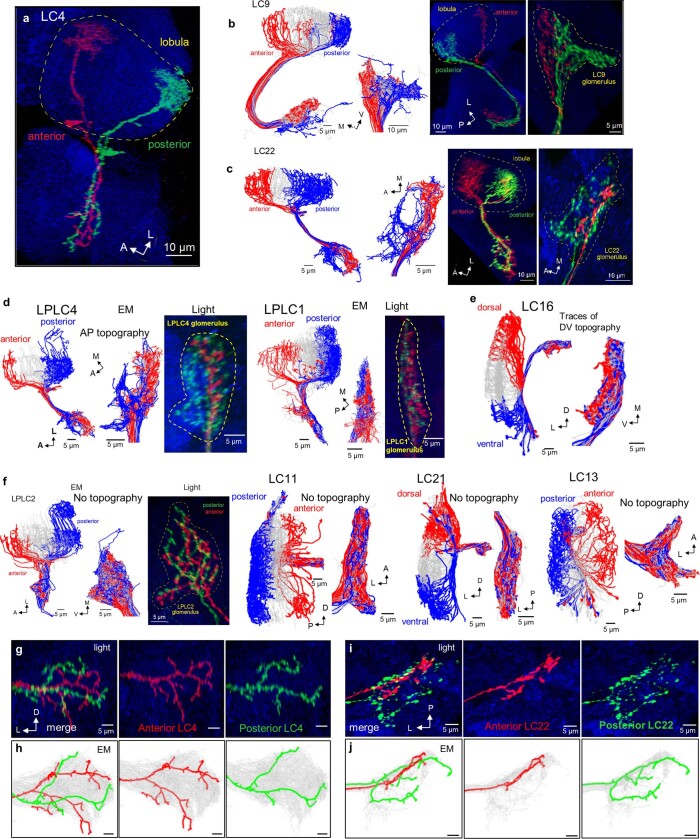
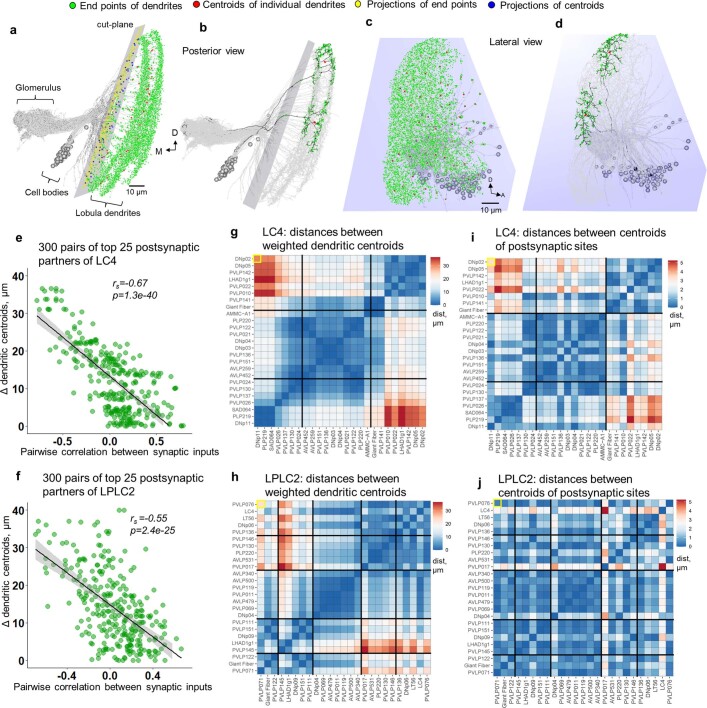
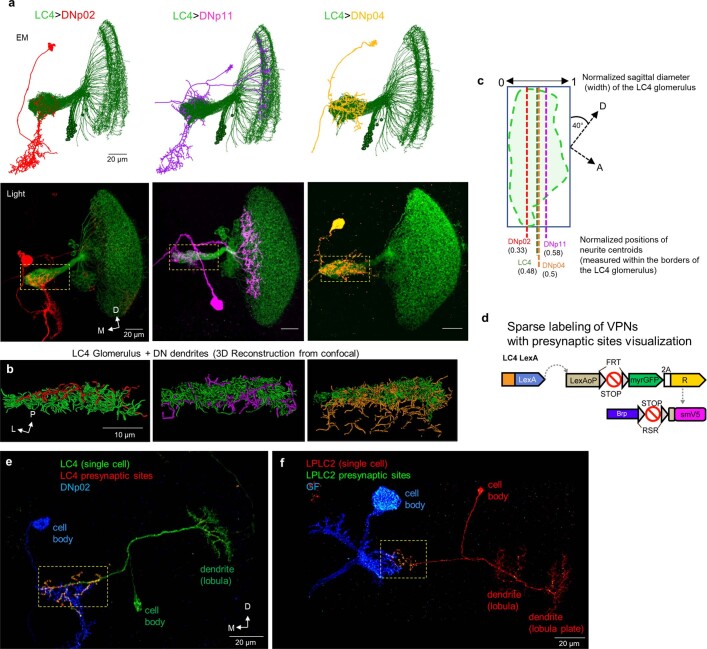
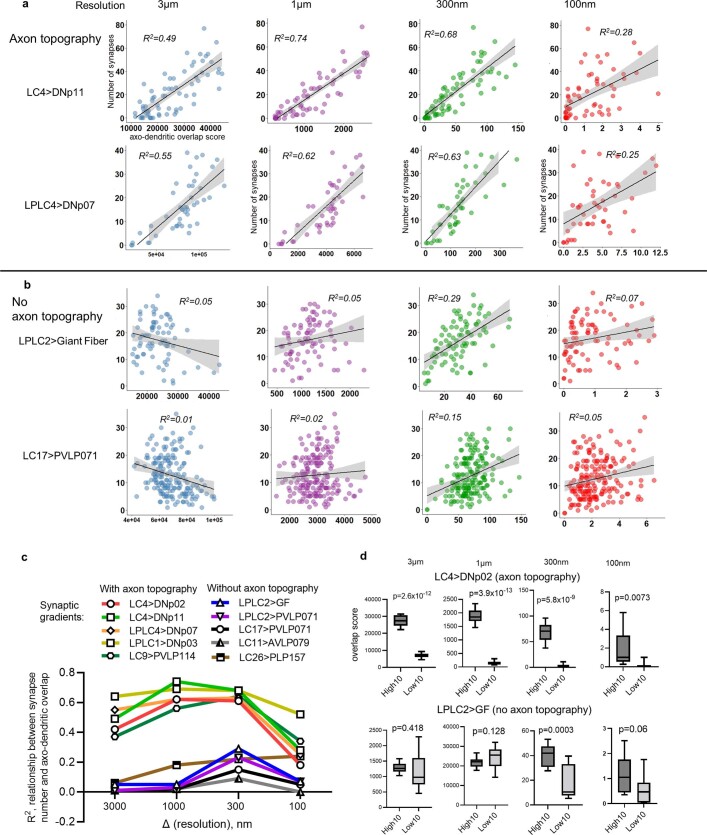
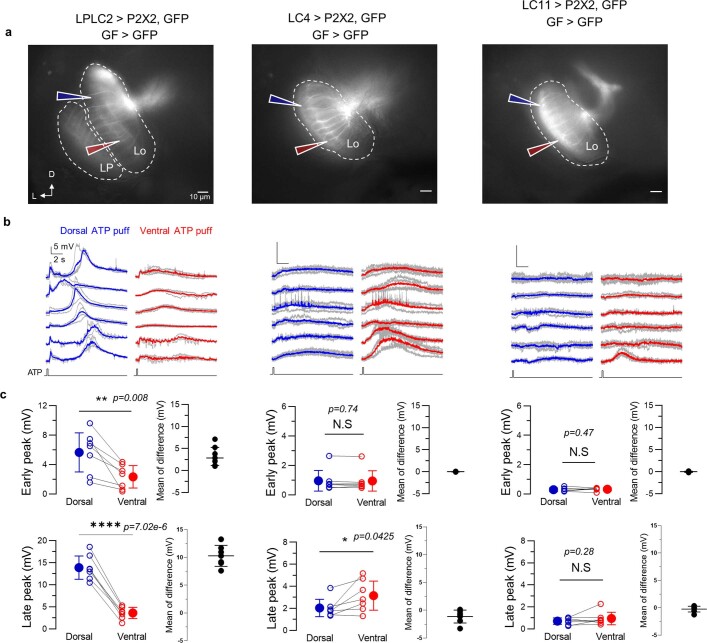
To survive, animals must convert sensory information into appropriate behaviours1,2. Vision is a common sense for locating ethologically relevant stimuli and guiding motor responses3-5. How circuitry converts object location in retinal coordinates to movement direction in body coordinates remains largely unknown. Here we show through behaviour, physiology, anatomy and connectomics in Drosophila that visuomotor transformation occurs by conversion of topographic maps formed by the dendrites of feature-detecting visual projection neurons (VPNs)6,7 into synaptic weight gradients of VPN outputs onto central brain neurons. We demonstrate how this gradient motif transforms the anteroposterior location of a visual looming stimulus into the fly's directional escape. Specifically, we discover that two neurons postsynaptic to a looming-responsive VPN type promote opposite takeoff directions. Opposite synaptic weight gradients onto these neurons from looming VPNs in different visual field regions convert localized looming threats into correctly oriented escapes. For a second looming-responsive VPN type, we demonstrate graded responses along the dorsoventral axis. We show that this synaptic gradient motif generalizes across all 20 primary VPN cell types and most often arises without VPN axon topography. Synaptic gradients may thus be a general mechanism for conveying spatial features of sensory information into directed motor outputs.


Conflict of interest statement

The authors declare no competing interests.

Figures

Fig. 1
Fig. 1. LC4 VPNs pass looming location information to DNs that mediate forward or backward escape takeoffs.
a, VPNs with retinotopically arranged dendrites in the lobula neuropil of the fly optic lobe have axon terminals in cell-type-specific optic glomeruli in the central brain. Dendrites of >50 postsynaptic neurons typically innervate each optic glomerulus. Inset: EM-based reconstructions (hemibrain connectome) of 71 LC4 VPNs (blue), a single LC4 neuron (red) and LC4 postsynaptic partner, GF DN (black). VNC, ventral nerve cord; D, dorsal; L, lateral; glom., glomerulus. Scale bar, 20 μm. b, Confocal projections of GFP (green) expression in seven DNs innervating the LC4 glomerulus (red dashed line). Grey, brain neuropils. Images adapted from ref. , CC BY 4.0 (n = 4 brains for each DN). Scale bar, 50 μm. c, Synaptic connectivity from looming-sensitive VPN cell types onto seven DNs based on the hemibrain connectome. Arrow width is proportional to synapse number. Pie charts indicate proportion of a given DN’s inputs from each looming-sensitive VPN cell type. d, Forward–backward postural shifts in response to DN photostimulation; quantified as Δ[T2 leg angle], the change in angle between the middle jumping legs and COM. e, Δ[T2 leg angle] 75 ms after the onset of 50-ms photostimulation. Points, individual flies; error bars, s.d.; one-way analysis of variance (ANOVA), Dunnett’s test, ***< 0.001, exact P values in Supplementary Table 1. f, Δ[T2 leg angle] time courses from machine-learning-tracked data; red shaded area, photostimulation period. g, Δ[T2 leg angle] for a subset of manually annotated flies. In f,g: lines, mean; shading, s.d. h, Takeoff direction is COM movement direction between onset of middle leg extension and takeoff. i, Polar histograms of optogenetically activated takeoff direction. Red line, circular mean; n, number of flies tested; R¯, mean vector length; P, Hodges–Ajne test for angular uniformity. Source data
Fig. 2
Fig. 2. Synaptic number gradients between LC4 and DNs transform a retinotopic map in the optic lobe to movement direction.
a, Fly visual system (dorsal view). The A–P axis of the visual space is mapped onto the anatomical lateral–medial axis of the lobula neuropil. The outlined area is shown in b. b, Anterior and posterior visual inputs to LC4 neurons through two optic chiasms (OCHs). Images in a,b adapted from ref. , CC BY 4.0. c, DNp02 (red) and DNp11 (blue) dendrites receive input from LC4 neurons (grey) in the glomerulus formed by LC4 axon terminals. Shown are neuron skeletons (red and blue). Scale bar, 50 μm. d, LC4 dendrites in the lobula (lateral view) colour-coded according to the number of synapses their axons make onto DNp02 or DNp11. LC4–DNp02 and LC4–DNp11 synaptic gradients are antiparallel along the A–P axis of the visual space. Scale bar, 20 μm. All neurons in c,d are manually reconstructed from the EM FAFB dataset. e, Antiparallel A–P gradients are also seen in the hemibrain connectome. Dots, two-dimensional (2D) lobula projections of dendritic centroids for individual LC4 neurons in the lobula weighted in size and colour by the number of synapses made by their axons onto DNp02 and DNp11. Scale bars, 25 μm. f, Regression of LC4-DN synaptic weights as a function of LC4 dendrite centroid location; colour as in e. Linear fit line overlaid. Error bands, s.e.m. g, Hemibrain connectome reconstruction of LC4 dendrites coloured on the basis of a normalized (−1 to 1) number of synapses each LC4 neuron forms with DNp02 and DNp11. Some anterior lobula dendrites exceed the EM volume and are not fully reconstructed. h, Correlation between the number of synapses each LC4 neuron (n = 71) makes with DNp02 and DNp11. rs, Spearman’s rank correlation coefficient. A, anterior; P, posterior; D, dorsal; L, lateral. Error band, s.e.m. Source data
Fig. 3
Fig. 3. LC4 synaptic number gradients onto DNp02 and DNp11 are functional.
a, Whole-cell electrophysiological recordings of DNp02 (red) and DNp11 (blue) to looming stimuli at 32.5° (for DNp02) and 70° (for DNp11) in azimuth. Looming stimulus is an array of three discs expanding 0° to 30° diameter at 500° s−1. Shown are representative traces from a single fly and stimulus. b, Representative responses from a single fly for 32.5° (top) and 70° (bottom) azimuth looming stimuli. c, Spike raster plots of DN responses during the 150 ms after looming onset. Coloured trials show the traces in b. d, Averaged response of the traces in b shows subthreshold depolarizing responses to looming stimuli. Shaded area, estimated depolarization from the baseline. e, Mean per-trial spike count across individual flies (from c). n, individual trials; **< 0.01. f, Pooled mean of integrated potentials across individual flies. n, individual trials. Repeated-measures one-way ANOVA, Dunnett’s test. Error bars, s.e.m.; **< 0.01, ***< 0.001, see Supplementary Table 1 for exact P values. g, Mollweide projection of estimated dendritic receptive fields for all 55 LC4 neurons in the FAFB EM dataset. Polygons are estimated visual fields of individual LC4 neurons (example individual fields in red and blue). h, DNp02 and DNp11 LC4-receptive fields estimated on the basis of summed input from individual LC4 fields in g. i, In vivo whole-cell (dashed) and model-estimated (solid) DN responses to three-loom-array stimuli (solid). j, Estimated DNp02 and DNp11 responses to modelled three-loom-array stimuli across the whole visual hemifield, based on receptive fields in h. Source data
Fig. 4
Fig. 4. Synaptic gradients are a general property of VPN output organization.
a,b, Connectivity-based k-means clustering of individual neurons within 20 VPN cell types (see Methods). Lateral views of VPN dendrites in the lobula (hemibrain connectome reconstructions). Individual cells within one VPN cell type are coloured by their cluster identity. Colours do not correspond between VPN types. Most VPNs exhibit distinct spatial separation (examples in a), but in some cases (LC12 and LC17 in b) there is no clear separation. Scale bars, 20 μm. c, Differential connectivity (number of synapses) across individual neurons within one VPN cell type. Measured for 20 VPN cell types and their postsynaptic partners that make at least 50 synapses total. Coefficients of variation in synapse number are averaged across all postsynaptic partners per VPN cell type. d, Matrix of pairwise correlations in synaptic connectivity between LC4 and its top 25 postsynaptic partners; ordered by hierarchical clustering as indicated by coloured side bars; rs, Spearman’s rank correlation coefficient. e, Topographic map of input centroids, weighted by number of synapses, for top 25 postsynaptic partners of LC4. Dark grey shading, lobula 2D projection; small open circles, centroids of 71 individual LC4 dendrites; coloured circles, weighted input centroids; solid blue line, median separation line; dashed blue line, projection line (see Methods). Red squares indicate centroids of DNp02 and DNp11. Scale bar, 25 μm. f,g, Similar analysis as in d,e, but for LPLC2. Red squares, centroids of neurons PVLP071 and PVLP076. Scale bar, 25 μm. h, Representative examples of synaptic gradients reflecting A–P and D–V axes of dendritic maps in multiple VPN cell types. syn., synapses. Scale bars, 25 μm (images 1 and 6–8) and 30 μm (images 2–5). A, anterior; P, posterior; D, dorsal; V, ventral. Error bands, s.e.m. See legend for Fig. 2c,d. Source data
Fig. 5
Fig. 5. Axon topography is present in some, but not most, optic glomeruli.
a, LC4 is a VPN cell type that retains axonal topography in optic glomerulus. Left, hemibrain connectome reconstructions of 15 anterior (red), 15 posterior (blue) and central LC4 cells (grey). Middle, EM reconstruction of axons in the LC4 glomerulus shows separation of anterior and posterior terminals. M, medial. Right, image of the LC4 glomerulus region with axon terminals of one anterior (red) and one posterior (green) cell labelled using MultiColor FlpOut and assessed using light microscopy (n = 9, all A–P pairs of individual clones from different brains exhibited reproducible axon terminal topography). Axonal projections form a topographic map in the glomerulus, corresponding to the location of their dendrites along the A–P axis of the lobula. Scale bars, 5 μm. b, LPLC2 is a VPN cell type without axonal topography. LPLC2 axon terminals do not form a topographic map along the D–V axis of the lobula as visualized from EM reconstruction (left and middle) and light microscopy (right, n = 6 pairs of clones). Scale bars, 5 μm. c, Relationship between synaptic gradients and topography of axon terminals for different VPN types (see Extended Data Fig. 8 for more examples). *LC6 retains coarse axonal retinotopy. **LC10 was previously shown to have A–P axonal retinotopy,. A, anterior; P, posterior; D, dorsal; M, medial; L, lateral.
Fig. 6
Fig. 6. Synaptic gradients in VPNs emerge through spatial and spatially independent mechanisms.
a–h, LC4: spatial mechanism. a, Relationship between dendritic map and spatial arrangement of synapses in the glomerulus for LC4 (for 300 pairs of top 25 postsynaptic (postsyn.) partners); rs, Spearman’s rank correlation coefficient. Error bands, s.e.m. b, Location of DNp02 and DNp11 postsynaptic sites in the retinotopic LC4 glomerulus (green dashed outline); black line, separation plane; DKS, two-tailed Kolmogorov–Smirnov test. Scale bar, 5 μm. c, Confocal projections of LC4 glomeruli and DN dendrites. Scale bars, 5 μm. d, Normalized DN dendritic centroid position within the LC4 glomerulus (n = 12 brains each; one-way ANOVA, Dunnett’s test, versus LC4 glomerulus centroid, ****P < 0.0001). e,f, Single anterior and posterior LC4 neurons with labelled presynaptic sites colocalized with DNp02 and DNp11 dendrites, alongside their EM reconstructions (bodyID 1907587934 and 1249932198). Scale bars, 5 μm. g,h, Distance (dist.) between dendrites of DNp02 (g) and DNp11 (h) and presynaptic sites in anterior versus posterior LC4 (n = 8 and 10 brains, respectively; two-tailed unpaired Welch’s t-test, ***< 0.001). i–m, LPLC2: non-spatial mechanism. i, Relationship of input and output centroids (as in a) for LPLC2. j, Location of PVLP071 and PVLP076 postsynaptic sites in the LPLC2 glomerulus (statistics as in a,b), which lacks retinotopy. Scale bar, 5 μm. k, Single ventral and dorsal LPLC2 neurons with labelled presynaptic (presyn.) sites colocalized with the GF dendrite. Scale bars, 5 μm. l, Distances between presynaptic sites of single dorsal versus ventral LPLC2 neurons and GF dendrites, measured along three cardinal axes (n = 5 brains each; two-tailed unpaired Welch’s t-test, NS, > 0.05). m, GF depolarization responses from localized activation of dorsal versus ventral LPLC2 and LC4 neurons expressing the P2X2 receptor. Left: representative GF responses (n = 5, one fly); individual (lighter-coloured lines) and averaged (darker lines) responses. Right: comparison of normalized average GF responses (resp.) to dorsal versus ventral VPN activation (two-tailed paired t-test; error bars, s.e.m., *P ≤ 0.05, ****< 0.0001). Responses were averaged during the late response peak; see Extended Data Fig. 12c for quantification of the early peak. n, individual flies tested. A, anterior; P, posterior; D, dorsal; V, ventral; L, lateral; M, medial. All box plots show median and interquartile range. Source data
Extended Data Fig. 1
Extended Data Fig. 1. Control of fly takeoff direction.
a, When shown a looming stimulus from the front (azimuth 0°), side (azimuth 90°), or back (azimuth 180°), flies respond by moving their center of mass (COM) away from the stimulus. Black disc represents stimulus location and color indicates time from stimulus onset. Flies used for ad were a control genotype for other experiments, Empty>Kir2.1. One trial per fly. b, Some flies also takeoff in response to looming, and those that do takeoff in a direction away from the stimulus (with some influence of the heading of the fly). Shown are polar takeoff direction histograms with 12° bin width and mean resultant vector overlaid (red line). p, Hodges-Ajne test for angular uniformity. c, Takeoff direction results from the fly shifting its COM relative to the axes formed by a line connecting the ground contact points of its two middle jumping legs and a perpendicular bisector. Black points indicate COM at stimulus onset and red points indicate COM just prior to takeoff. d, The specific direction in which the COM moves in body coordinates depends on its starting location. Vector position is the COM position at stimulus onset. The vector itself indicates the shift of COM position from stimulus onset to just prior to takeoff. Black vectors are tracked data, gray vectors are interpolated. Black square is approximated point of convergence. e, Percent of flies (individual DN driver lines) that performed a takeoff in response to CsChrimson optogenetic activation in the FlyPEZ assay. Error bars, Wilson score interval; *p < 0.05, **p < 0.01, ***p < 0.001, ****p < 0.0001 vs control (Empty, empty brain split-Gal4 control; DL – wild type control); normal approximation to binomial, two-sided Z-test, Bonferroni correction post hoc test. f, Same data as in (e) but with driver lines grouped by cell type. Error bars, SD. g, Histograms displaying the distribution of escape sequence durations between the wing raising and takeoff jump sub-behaviors (for LC4-DN driver lines expressing CsChrimson that can elicit escape upon activation). Escape trials are combined from split-Gal4 lines for each LC4-DN type. Short-mode escape duration (0 to 7 ms, gray shaded region) and long-mode escape duration (>7 ms), as previously established. h, Percentage of short-mode activated escapes. Error bars, Wilson score interval; ****p < 0.0001 versus GF; normal approximation to binomial, two-sided Z-test, Bonferroni correction post hoc test. Detailed description of statistical tests used and p-values for panels “e” and “h” is available in Supplementary Table 1. Source data
Extended Data Fig. 2
Extended Data Fig. 2. Silencing of either DNp02 or DNp11 impairs control of postural shifting and takeoff direction in response to looming stimuli.
For neuronal silencing experiments, driver lines for DNp02, DNp11, and an ‘Empty’ driver line control were crossed into UAS-Kir2.1. ab, Polar takeoff direction histograms in response to looming stimuli presented in front of the fly at 0° azimuth (a) or behind the fly at 180° azimuth (b); 12° bin width; red line, mean resultant vector. DN-silenced flies perform normally in response to a posterior (180°) stimulus compared to control (p > 0.1 for both DNs, Kuiper’s Test). However, DN silencing altered the distribution of backward takeoffs direction in response to frontal looming (0°) for both DNp02 (p < 0.005, Kuiper’s test) and DNp11 (p < 0.001, Kuiper’s test) silencing compared to controls. Strikingly, many DNp02- and DNp11-silenced flies performed forward takeoffs in response to frontal looming stimulation, effectively jumping toward the threatening stimulus. c, To further understand why flies were inappropriately taking off forwards, we looked at how much DN-silenced flies moved their COM backwards in response to 0° looming. We visualized COM movement in body coordinates from different starting postures using the same flow fields in body-centric coordinates as in Extended Data Fig. 1d. Visual inspection indicated that COM movement fields for DN-silenced flies differed from controls in the amount of backwards movement and had more lateral movement. d, To quantify this motion, we measure the T2 angle (angle formed by T2 tarsal contact points and COM), which is >180° when the COM is in front of the T2 jumping legs and <180° when the COM is behind the T2 jumping legs. The mean T2 angle just before takeoff was significantly different for DNp02- and DNp11-silenced flies compared to controls (*p = 0.0468, ***p = 4.79e-04, One-Way ANOVA, Dunnett’s test). Black points, individual flies; error bars, SD. e, Looking at time courses for T2 leg angle in response to 0° azimuth looming stimulus for the different DN-silenced lines (colors, shaded area, SD), with control data overlaid (grey), it is clear that the difference in the DN-silenced flies is that they do not shift backwards as much as controls. Since COM placement prior to takeoff determines whether the fly’s jump will propel it forwards (T2 angle>180) or backwards (T2 angle<180), the impaired pre-takeoff T2 leg angle change in DNp02- and DNp11-silenced flies, which on average does not become <180° as in control flies, likely underlies altered takeoff performance leading to more forward-directed takeoffs. f, DNp02 and DNp11 silencing does not affect takeoff rates. Percentage of flies which performed a takeoff to a looming visual stimulus (azimuth = 90°, elevation = 45°) at four looming rates (l/v = 10, 20, 40 and 80 ms), or a looming visual stimulus (azimuth = 0° or 180°, elevation = 45°) at l/v = 40. L1/L2-silenced flies serve as “motion-blind” negative controls. Error bars, SEM; Wilson score interval; **p < 0.01, ***p < 0.001, ****p < 0.0001 versus Empty control; normal approximation to binomial, two-sided Z-test, Bonferroni correction post hoc test. Detailed description of statistical tests and p-values for panel “f” is available in Supplementary Table 1. Source data
Extended Data Fig. 3
Extended Data Fig. 3. EM-based analysis if synaptic connectivity patterns between LC4 and DNs.
a, Individual LC4 neurons (55 total traced in “FAFB” EM volume) make different numbers of synapses with different DNs. Individual LC4 neurons (x-axis) are ordered according to the synapse number with DNp02 (red bars). LC4 synapse number with DNp11 (blue bars) and DNp04 (purple bars). b, LC4 neurons (grey) and synaptic partners (GF and DNp04) traced in a FAFB EM volume. DN soma, circles. c, LC4 dendrites (lateral views) color-coded according to the total number of synapses onto each DN. D, dorsal; L, lateral; A, anterior. Source data
Extended Data Fig. 4
Extended Data Fig. 4. In vivo whole-cell recordings from DNs upon looming stimulation.
a, Left: Schematic of looming array stimuli at different azimuths (32.5°, 45°, 57.5° and 70°). Each loom consists of three dark disks in the white background. Pseudo-colored for clarity. Middle: looming array disk size over time from the beginning of stimulus. Each disk expands from 0° to 30° at 500°/s. Right: Stimulus arrangement projected onto fly’s eye (0° front of fly). To align looming array stimuli more closely with the synaptic gradients, the whole plane of the stimuli was pitched down 20°. b, Top: whole-cell electrophysiological recordings of the GF and DNp04 to looming stimuli at 32.5° in azimuth. Shown are representative traces from a single fly and stimulus. Middle: change of disk size over time. Bottom: baseline region and response region defined in the traces for analysis of DN activity. c, Representative DN responses showing identified spikes (top rasters). d, Representative responses from a single fly for 32.5° (top) and 70° (bottom) azimuth looming stimuli. Representative traces for GF and DNp04 are from a single fly with 6 trials to each stimulus. e, Spike raster plots of DNp04 in 150 ms time window after the onset of looming stimuli. f, Pooled mean of DNp04 spike numbers across individual flies (from “e”). Error bars, SEM; RM one-way ANOVA, Dunnett’s test. g, Averaged response of the representative traces in d shows subthreshold depolarizing responses to looming stimuli. Shaded area under the line shows estimated depolarization from the baseline. h, Pooled mean of integrated potentials for DNp04 and GF across individual flies. Error bars, SD; RM one-way ANOVA, Dunnett’s test. ij, Mean spike numbers (i) and mean of integrated potentials (j) across trials in individual flies in response to looming stimuli. Colored lines denote the representative traces of each DN in Fig. 3a and Extended Data Fig. 4b. Detailed description of statistical tests and p-values for panels “f, h” is available in Supplementary Table 1. Source data
Extended Data Fig. 5
Extended Data Fig. 5. EM reconstruction of LC4 neurons and estimated receptive fields.
a, Tracing of all 55 LC4 neurons on one side of the brain in FAFB EM volume. Two example neurons are colored in red and blue (same in “b”). LC4 neurons have dendrites in lobula layers 2 and 4. LC4 cell bodies are marked with grey circles. Two Tm5 neurons are chosen to determine the center and central meridian of the eye in “b”. b, Two-dimensional projection of the lobula layer. Traced LC4 dendrites (grey) are projected onto a surface fit through all dendrites (orange). Blue circles denote centers of mass of individual LC4 dendrites. Vertical line is the estimated central meridian that divides the eye between anterior and posterior halves. c, Pseudo-stimuli mimicking looming stimuli used in in vivo whole-cell recordings to simulate LC4DN responses based on LC4 connectivity. d, Confined DN RFs to the region of pseudo-stimuli in the eye coordinate imitating the looming stimuli. LC4 RFs based on connectivity to each DN are scaled by the proportion of overlapping with each stimulus region prior to sum up all the LC4 RFs. e, Estimated anatomical receptive fields (RFs) of the GF and DNp04 in the eye coordinates. f, Left: Estimated connectivity-based DN responses to pseudo-stimuli (solid) and measured responses to the corresponding looming stimuli (dashed) from in vivo whole-cell recordings. Right: Estimated responses in DNp04 and GF extrapolated using the connectivity model to looming pseudo-stimuli that cover the visual hemifield.
Extended Data Fig. 6
Extended Data Fig. 6. Differential synaptic connectivity in VPNs manifests as synaptic gradients reflecting visual space map.
a, Representative elbow plots from k-means clustering of individual cells within each VPN cell type (based on the number of synapses they make with postsynaptic partners). A drop in the within cluster sum of squared distance was used to determine the number of k in Fig. 4a, b (see Methods for details). b, Representative example of differential synaptic connectivity metric (median coefficient of variation) for LC4. Left: coefficient of variation in synapse number between individual neurons within LC4 population and top 25 postsynaptic partners of LC4 (ordered by decreasing variation). Right: summary (median CV, shown in red) metric for all postsynaptic partners of LC4 making >50 synapses total. c, Representative examples of graded synaptic connectivity between four VPN cell types and their top 15 postsynaptic partners based on the total number of synapses. Each individual neuron within a VPN cell type is assigned a color based on just one plot (DNp11 for LC4, Giant Fiber for LPLC2 etc.), with the colors preserved in other graphs. Every plot indicates the number of synapses between individual neurons within one VPN cell type and a given postsynaptic partner (arranged by descending number of synapses). d, Single LC4 neurons (EM-based connectome reconstructions) with dendrites in anterior (bodyID 1907587934) or posterior (bodyID 1249932198) regions of the lobula are highlighted. The remaining LC4 neurons shown in grey. e, Differential synaptic connectivity between two LC4 neurons from (d) and their top 25 postsynaptic partners (measured by total number of synapses). 15 out of 25 postsynaptic neurons receive preferential or exclusive input from either anterior or posterior LC4. fg, Differential synaptic connectivity of individual LPLC2 neurons with dendrites in dorsal (bodyID 1815826155) vs ventral (bodyID 1815809293) lobula. Similar to (d, e). P, posterior; M, medial; D, dorsal; L, lateral.
Extended Data Fig. 7
Extended Data Fig. 7. Synaptic gradients are a common wiring motif across 20 VPN cell types.
Additional examples of synaptic gradients reflecting the visual space map between different VPN cell types and their postsynaptic partners. See legend in Fig. 2c,d. Top: 2D lobula projections of dendritic centroids for individual VPNs in the lobula weighted in size and color by the number of synapses made by their axons onto a designated postsynaptic target. Bottom: regression of synaptic weights as a function of VPN dendrite centroid location along the AP or DV axis in the lobula. Linear fit line overlaid. Error bands, SEM. low R2 value of LC10 gradients may be explained by the fact that LC10 bodyID annotations in the hemibrain EM volume contain multiple LC10 subtypes (LC10a-d) with differential synaptic specificity. D, dorsal; A, anterior.
Extended Data Fig. 8
Extended Data Fig. 8. Topographic mapping in VPN optic glomeruli.
ad, Examples of VPN cell types with retinotopic mapping of axon terminals reflecting the AP axis of the lobula dendritic map. Assessed via EM reconstructions and light microscopy (individual cells are labeled using Multicolor Flp-Out). LC4 neurons (a, same pair as in Fig. 5a) with dendrites innervating anterior and posterior lobula have axon terminals in distinct regions of the glomerulus. LC9 (b), LC22 (c), LPLC4 and LPLC1 (d) show similar axonal topography. Left panels, hemibrain connectome reconstructions of 15 anterior (red), 15 posterior (blue), and the remaining cells (grey). Corresponding reconstruction of axons in the VPN glomeruli shows visual separation of anterior and posterior terminals. Right panels: one anterior (red) and one posterior (green) cell labeled using Multicolor Flp-Out and assessed via light microscopy. (n = 4 pairs of A-P individual clones from different brains with reproducible axon terminal topography for LPLC4 and LPLC1, n = 5 for LC9, n = 6 for LC22). e, Traces of DV axonal retinotopy in LC16 – a single example found across 20 VPN cell types. f, Representative examples of VPNs without topographic mapping of axon terminals in optic glomeruli (EM reconstructions), despite elaborating synaptic gradients reflecting visual space map (see Fig. 4h and Extended Data Fig. 7). gj, Differential axon terminal morphology and glomerular targeting between individual LC4 (g, h) and LC22 neurons (i, j) innervating anterior and posterior regions of the lobula (N = 9 pairs of A-P individual clones from different brains with reproducible axon terminal topography for LC4, n =64 for LC22, correspond to examples from Fig. 5). Characteristic branching patterns are consistent between light microscopy and EM-based connectome reconstruction. A, anterior; P, posterior; D, dorsal; V, ventral; L, lateral; M, medial.
Extended Data Fig. 9
Extended Data Fig. 9. EM-based analysis of synaptic connectivity patterns in LC4 and LPLC2.
ad, Analysis of the spatial distribution of dendritic centroids in the lobula for LC4. Centers of mass (centroids) of dendrites for individual 71 LC4 neurons (red dots) were established based on coordinates of end branching points (green dots) located laterally from the separation cut-plane (grey) to exclude the branching points in the glomerulus. Branching points and centroids were projected onto the plane (yellow and blue dots, respectively). Shown for the entire LC4 population and two representative neurons from posterior (ab) and lateral (cd) views. Similar analysis was also done for LPLC2. D, dorsal; M, medial; A, anterior. ef, Relationship between synaptic input specificity and spatial dendritic map (measured by positions of weighted dendritic centroids) for 300 pairs of top 25 postsynaptic partners of LC4 (e) and LPLC2 (f). rs, Spearman’s rank correlation coefficient. Error bands, SEM. Strong correlation indicates that LC4 and LPLC2 neurons with neighboring dendrites have similar synaptic specificity in the glomerulus. gh, Matrices of pairwise distances between weighted centroids of inputs for 300 pairs of the top 25 postsynaptic partners of LC4 (g) and LPLC2 (h). The order of postsynaptic neurons is preserved from Fig. 4d and f. ij, Matrices of pairwise distances between centroids of postsynaptic sites of the top 25 postsynaptic partners of LC4 (i) and LPLC2 (j). The order of postsynaptic neurons is preserved from Fig. 4d and f. Source data
Extended Data Fig. 10
Extended Data Fig. 10. Assessment of wiring strategy in VPN glomeruli using light-level neuroanatomy.
a, Top: EM-based connectome reconstructions of LC4 neurons (green) and three DNs. Bottom: confocal projections of colocalized LC4 and three DNs, LC4 glomerulus is indicated with a dashed yellow rectangle (n = 12 brains for each LC4-DN, corresponding to Fig. 5c,d). Note that DNp11 has an additional dendritic branch in the lobula. b, Imaris reconstructions of confocal image stacks: LC4 glomerulus (axons) and dendritic segments of three DNs (both reconstructed as filaments) as indicated. c, Assessment of spatial distribution of DN dendrites within the volume of the LC4 glomerulus (outlined with a green dashed line). Topographic separation of the LC4 axon terminals occurs along the sagittal diameter of the glomerulus. Normalized value of the sagittal diameter was used to assess the relative placement of the postsynaptic dendrites (see Methods). Dotted straight lines indicate the positions of DN dendritic centroids along the sagittal diameter of the glomerulus. Position of the LC4 glomerulus centroid slightly deviates from 0.5 value due to the naturally curved shape of the glomerulus. d, Strategy for sparse labeling of LC4 neurons and their presynaptic sites. Labeling of cell membranes (myr::GFP) and presynaptic sites (Brp-smGdP-V5) is dependent upon heat-shock induced expression of FLP (See Methods). e, Confocal projection of a single LC4 neuron with presynaptic sites labeled and colocalized with dendrite of DNp02 (n = 18 individual LC4 neurons from different brains, corresponding to Fig. 6e–h. f, Confocal projection of a single LPLC2 neuron with labeled presynaptic sites colocalized with GF dendrite (n = 10 individual LPLC2 neurons from different brains, corresponding to Fig. 6k,l). Regions corresponding to LC4 and LPLC2 glomeruli are indicated with dashed yellow rectangles.
Extended Data Fig. 11
Extended Data Fig. 11. The role of axo-dendritic overlap in synaptic specificity with and without axon topography.
Relationship between the number of synapses (VPNs and their postsynaptic targets) and axo-dendritic overlap score obtained from “hemibrain” EM volume using “overlap_score” function of the natverse package. ab, representative examples of correlation plots featuring VPNs with (a) and without (b) topographic mapping in optic glomeruli (each dot represents a single neuron within one VPN cell type) and their individual postsynaptic partners. Measurements were performed using four resolution thresholds (3000, 1000, 300 and 100nm) to progressively distinguish the specific role of general axonal topography (retinotopic mapping of axonal projections) from microtopography resulting from local synaptic specificity. An R2 value reflects the impact of spatial positioning of axons and dendrites on the resulting synaptic connectivity. Error bands, SEM. D, dorsal; M, medial; P, posterior; L, lateral. c, plots summarizing the impact of topography on synaptic connectivity (at different spatial resolutions) for four VPN cell types with and without axonal topography and their five different postsynaptic partners (all examples are taken form Fig. 4 and Extended Data Fig. 7). d, Comparison of axo-dendritic overlap score for top10 individual VPN neurons with and without axonal topography (LC4, top and LPLC2, bottom, respectively, n = 10+10 for each VPN cell type) making most and least number of synapses with their postsynaptic targets (DNp02 and GF, respectively). Two-tailed unpaired Welch’s t-test. In all box plots, the solid line depicts the median; the upper and lower bounds of the box depict the third and first quantiles of the data spread, respectively. Whiskers indicate min and max values. Source data
Extended Data Fig. 12
Extended Data Fig. 12. Functional assessment of synaptic gradients in LPLC2 using electrophysiology.
a, Single focal plane snapshots of GFP expression by three tested VPN cell types overlaid with schematic ATP puffing locations. Focal application of 5 mM ATP (0.2 s pulse) was performed at either dorsal or ventral position along the dendrites of each VPN in the lobula. Outlines of the lobula (Lo) and lobula plate (LP), dashed white lines. D, dorsal; L, lateral. b, Depolarization responses of GF upon activation of VPNs from 6 different flies in each genotype (data from one animal shown in Fig. 6m). Blue, dorsal averaged responses. Red, ventral averaged responses. Grey, individual trials. c, Summary of early (top) and late (bottom) GF peak responses obtained in the time window of 0.5s and 8s after the stimulation onset, respectively. Mean differences between absolute values of GF responses to dorsal and ventral stimulations of the corresponding VPN cell types are shown next to each plot. Early peak: 3.32 ± 2.25 mV for LPLC2, 0.007 ± 0.06 mV for LC4, −0.04 ± 0.13 mV for LC11. Late peaks: 10.27 ± 1.88 mV for LPLC2, −1.12 ± 1.16 mV for LC4, −0.23 ± 0.52 mV for LC11 (error bars, SEM; n = 7 animals for each genotype. Individual data points are means of n = 5 trials per animal; two-tailed paired t-test). N.S.: P >0.05; *: P <0.05; **: P <0.01; ****: P <0.0001. Detailed description of statistical tests and p-values for panels is available in Supplementary Table 1. Source data

Comment in

References

    1. Crochet S, Lee SH, Petersen CCH. Neural circuits for goal-directed sensorimotor transformations. Trends Neurosci. 2019;42:66–77. doi: 10.1016/j.tins.2018.08.011. - DOI - PubMed
    1. Calhoun AJ, Murthy M. Quantifying behavior to solve sensorimotor transformations: advances from worms and flies. Curr. Opin. Neurobiol. 2017;46:90–98. doi: 10.1016/j.conb.2017.08.006. - DOI - PMC - PubMed
    1. Cavanaugh J, et al. Optogenetic inactivation modifies monkey visuomotor behavior. Neuron. 2012;76:901–907. doi: 10.1016/j.neuron.2012.10.016. - DOI - PMC - PubMed
    1. Bianco IH, Engert F. Visuomotor transformations underlying hunting behavior in zebrafish. Curr. Biol. 2015;25:831–846. doi: 10.1016/j.cub.2015.01.042. - DOI - PMC - PubMed
    1. Buneo CA, Jarvis MR, Batista AP, Andersen RA. Direct visuomotor transformations for reaching. Nature. 2002;416:632–636. doi: 10.1038/416632a. - DOI - PubMed

Publication types