Comparative Study
. 2023 Jan;613(7944):550-557.
doi: 10.1038/s41586-022-05574-4. Epub 2023 Jan 4.

Metabolic regulation of species-specific developmental rates

Affiliations
Comparative Study

Metabolic regulation of species-specific developmental rates

Margarete Diaz-Cuadros et al. Nature. 2023 Jan.

Erratum in

Abstract

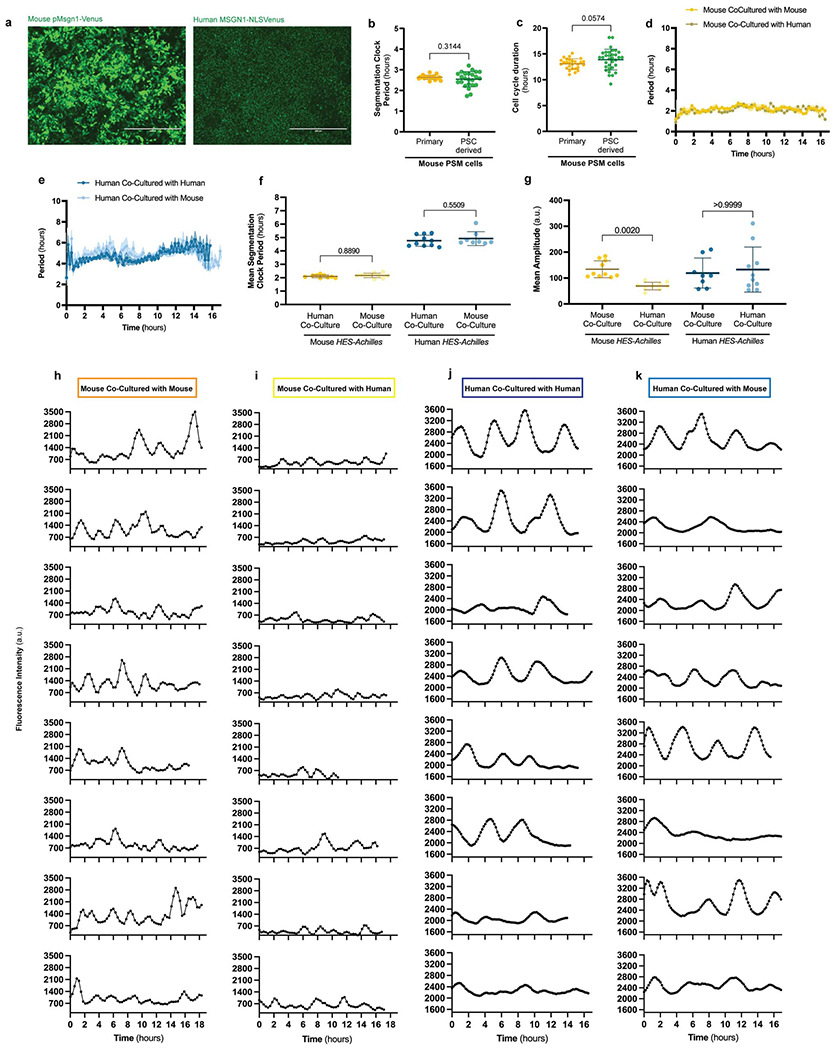
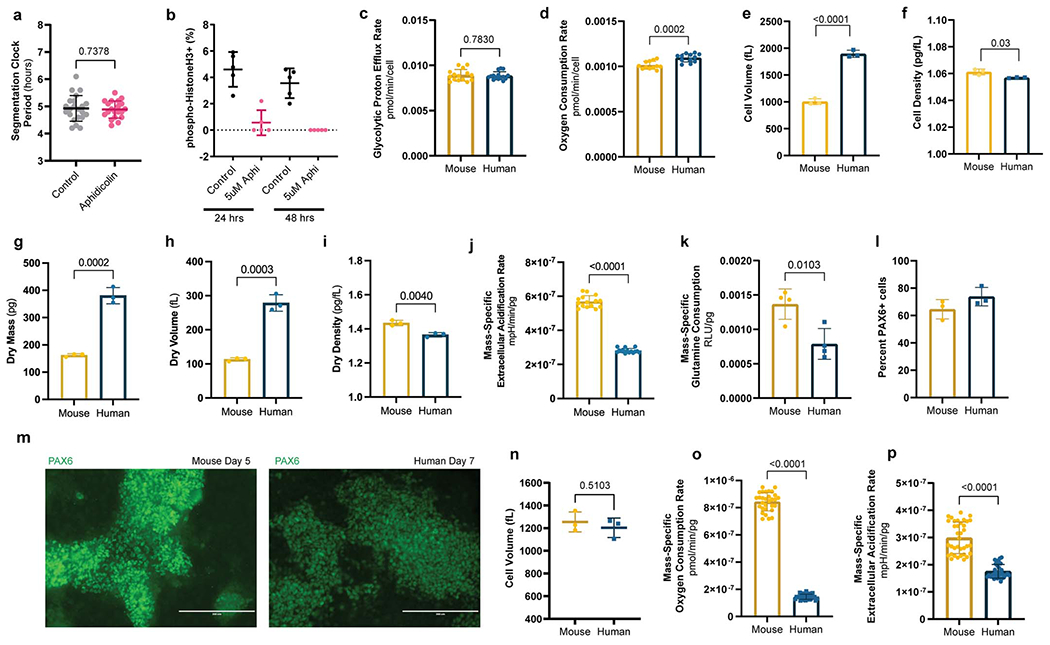
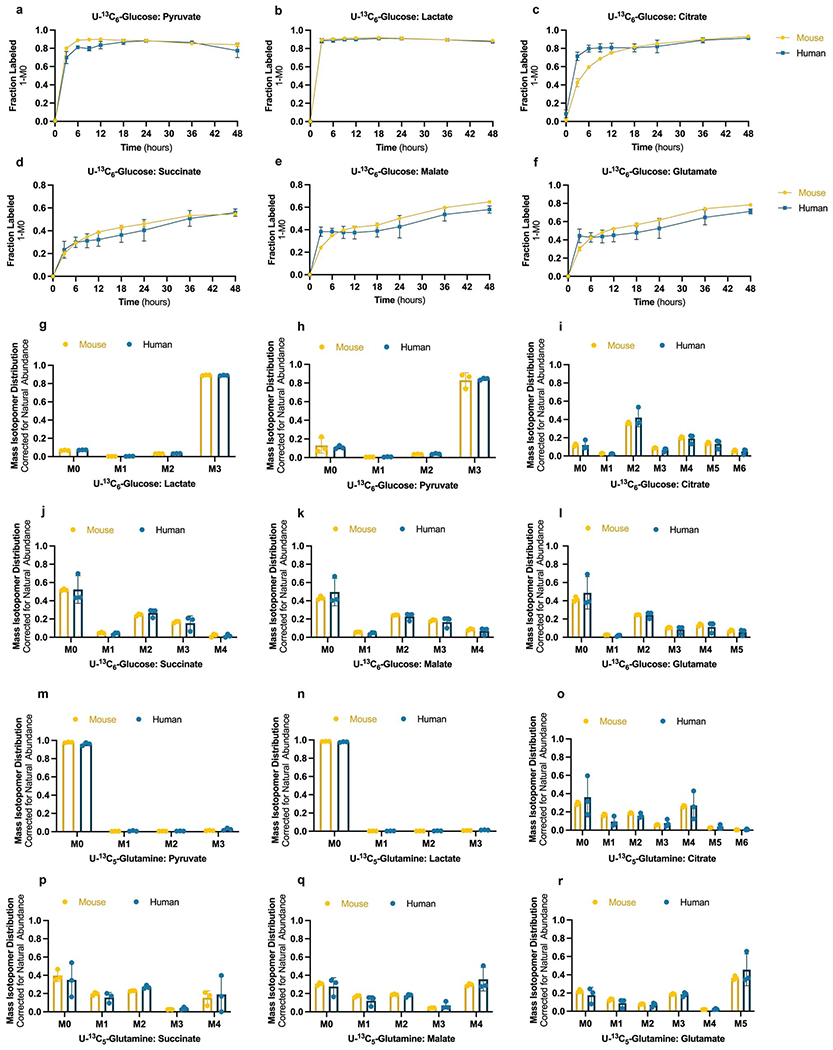
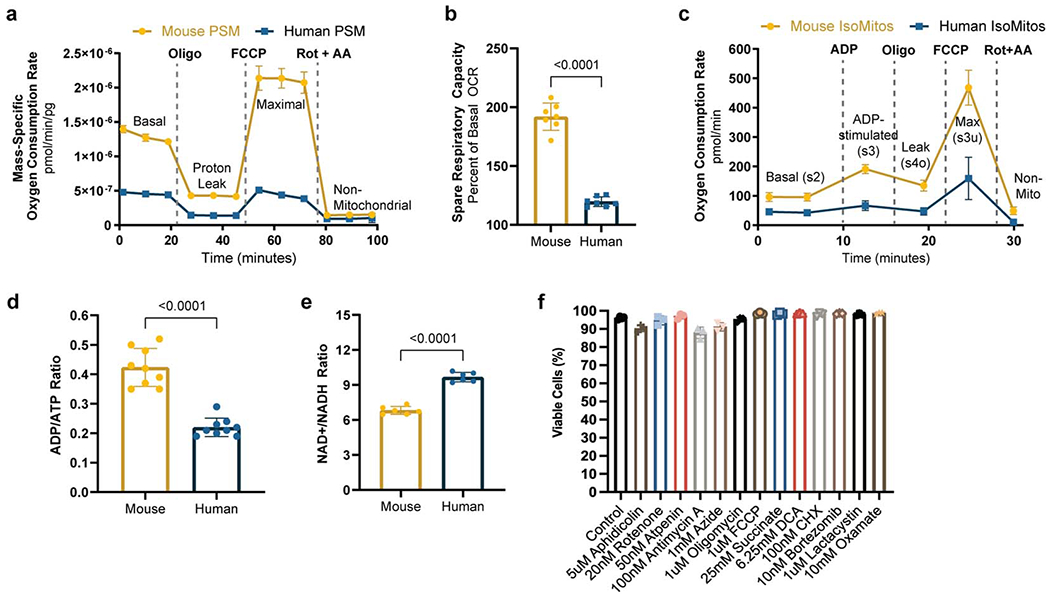
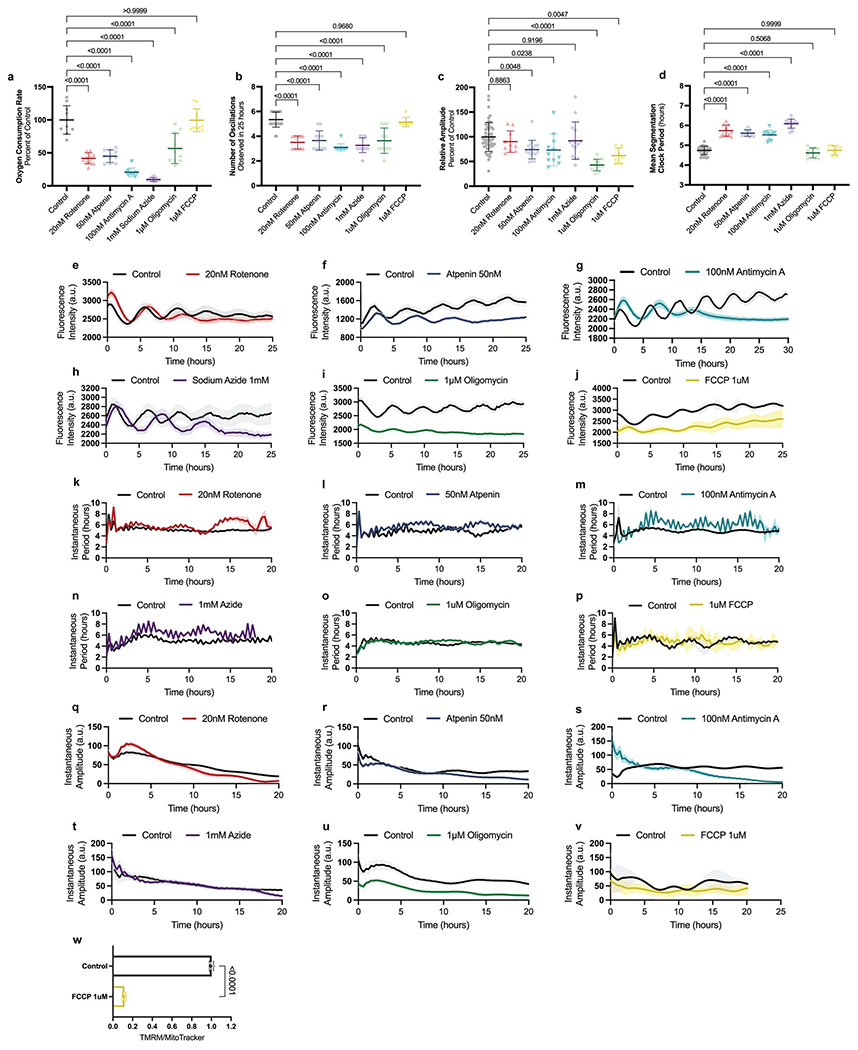
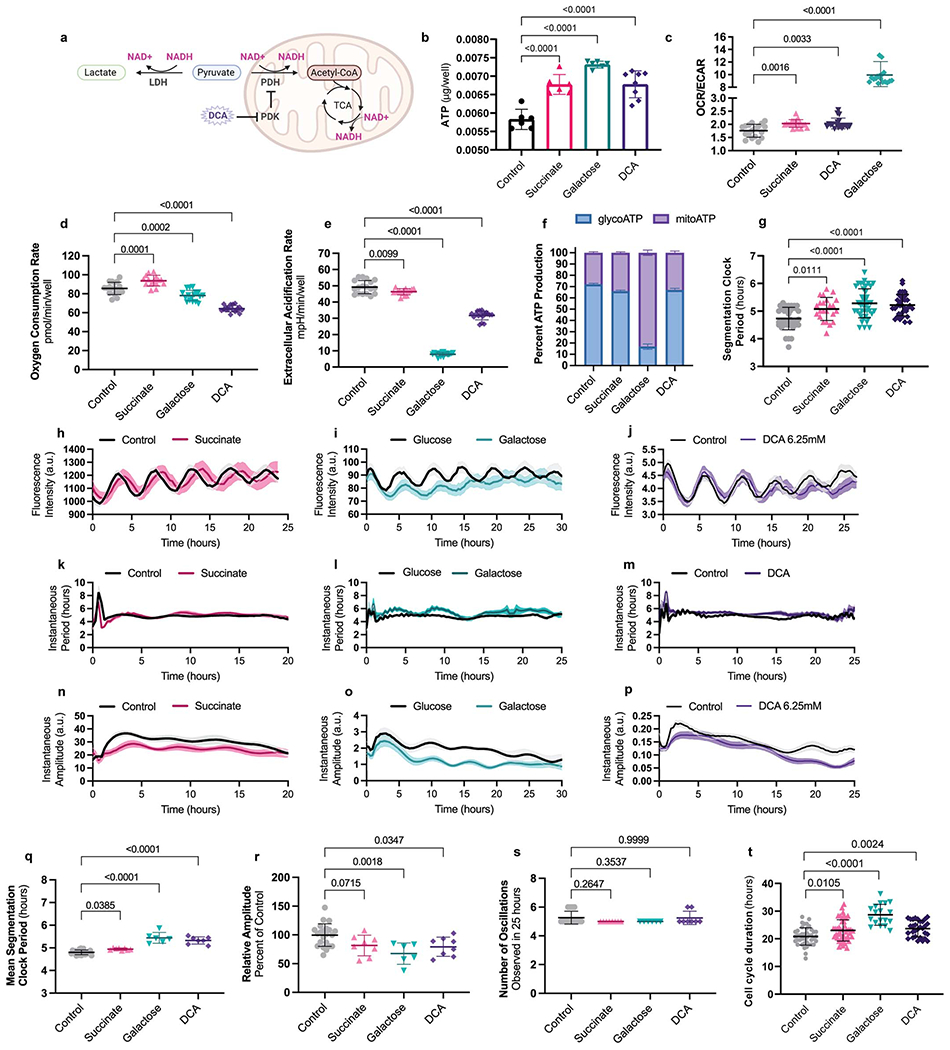
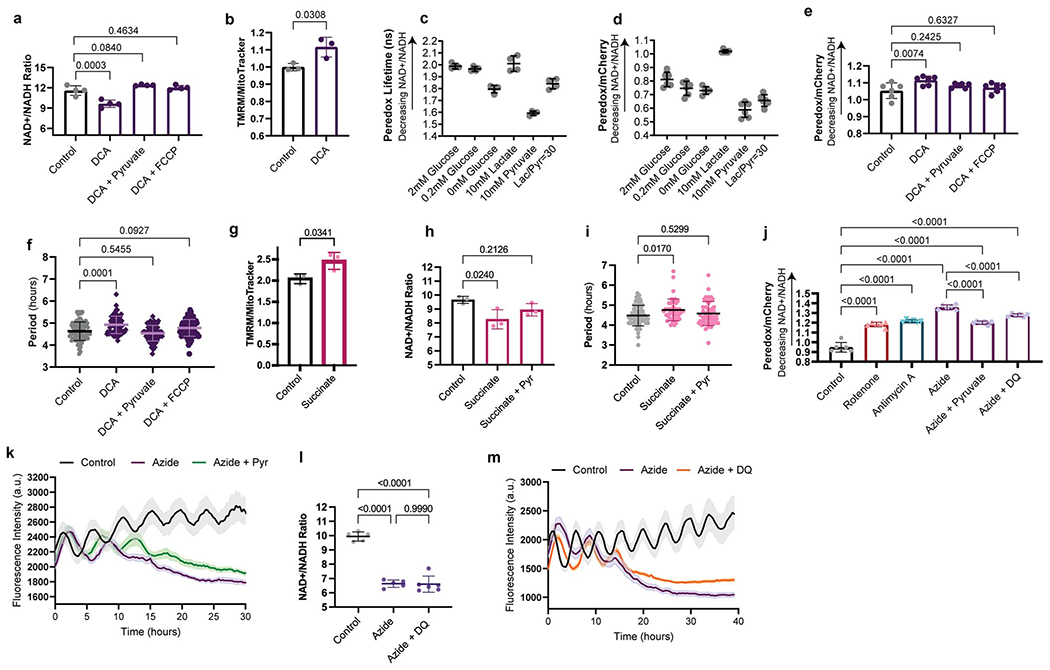
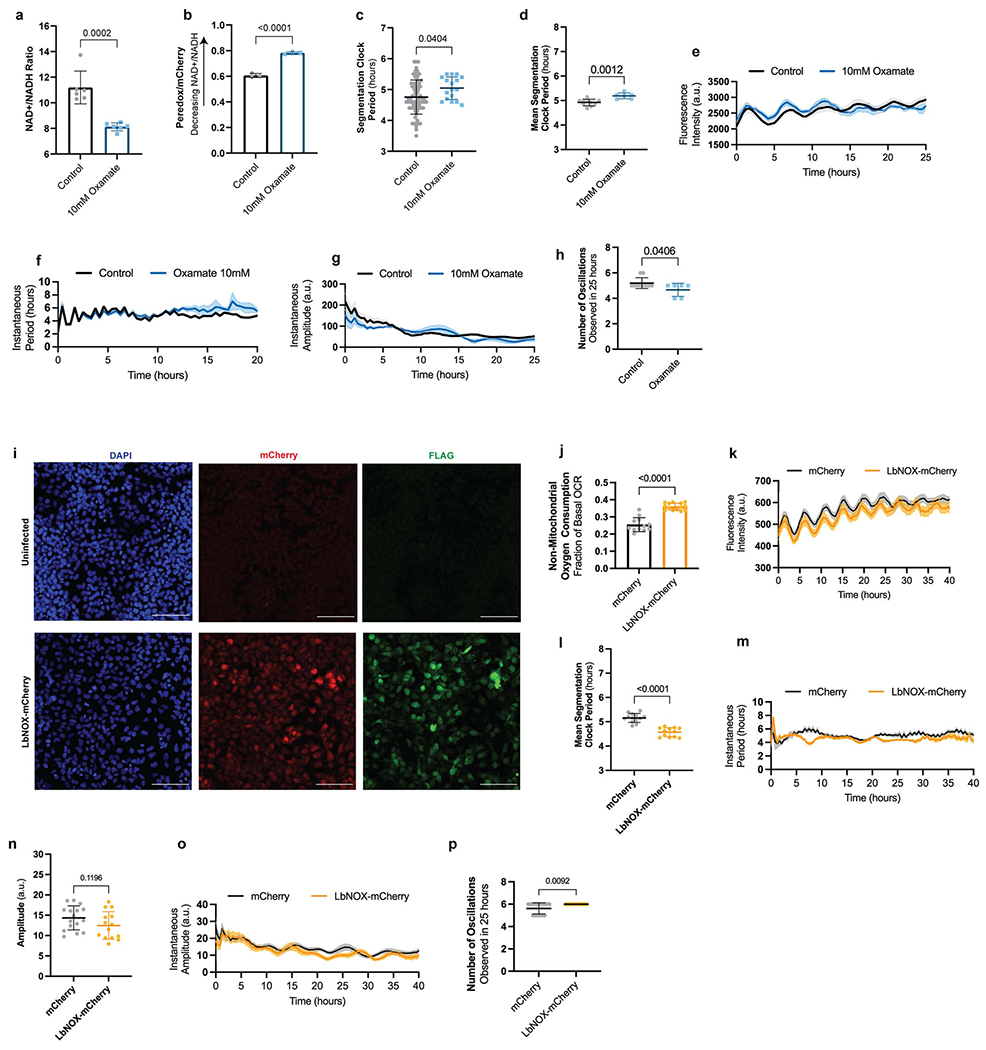
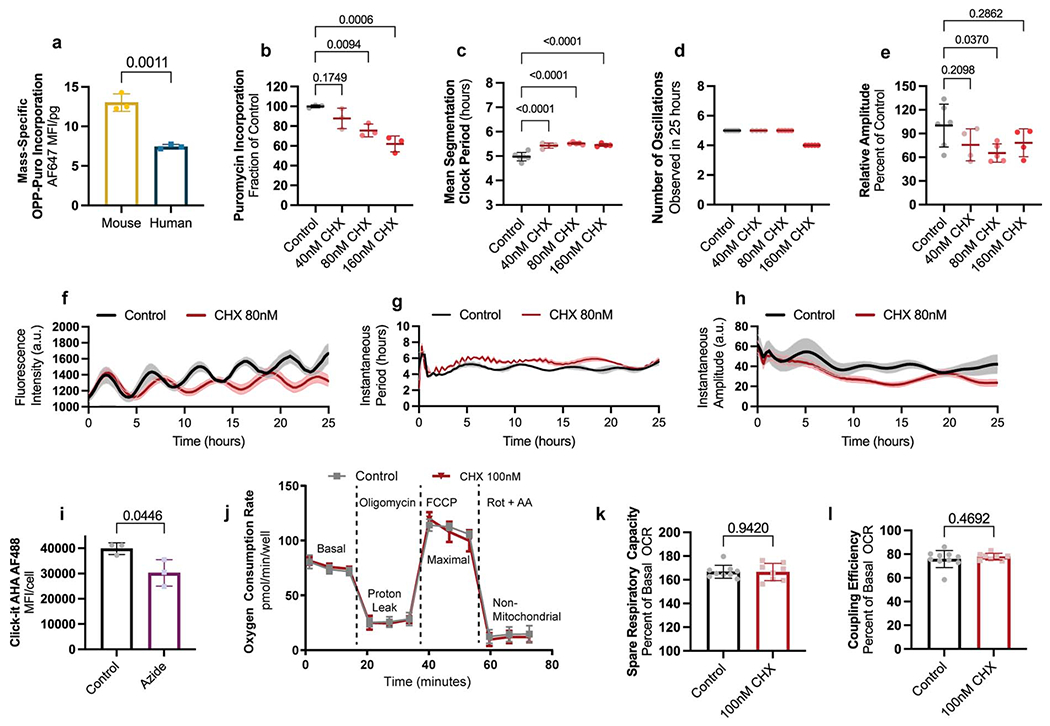
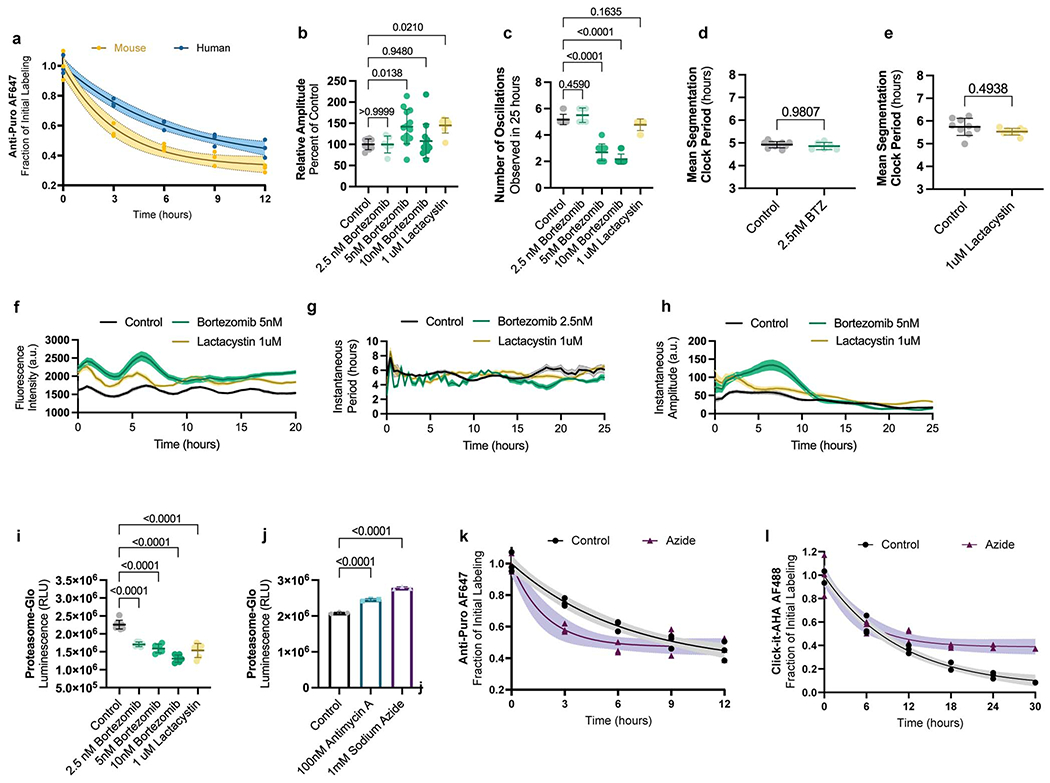
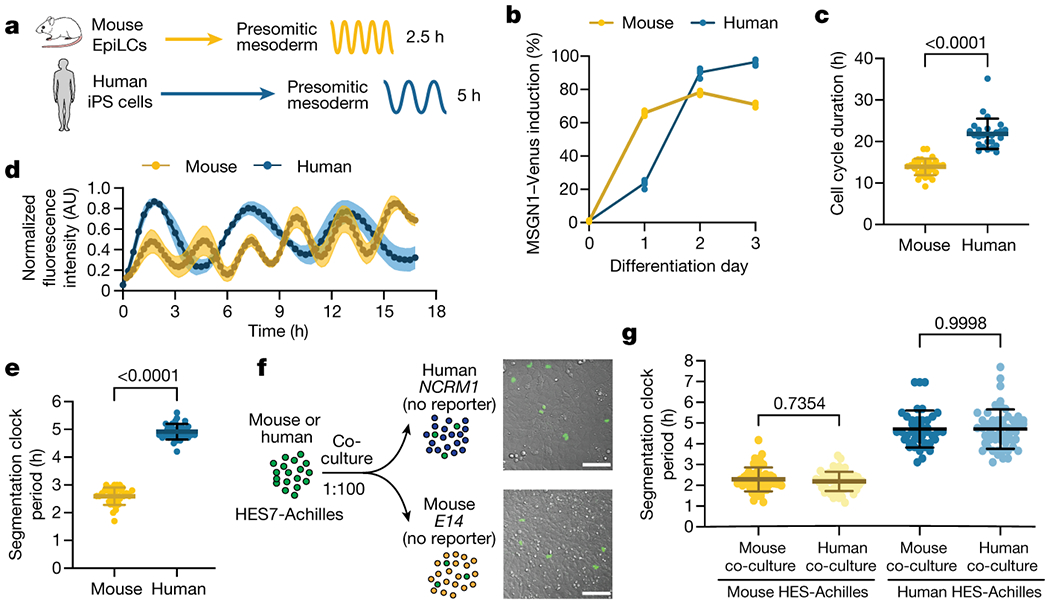
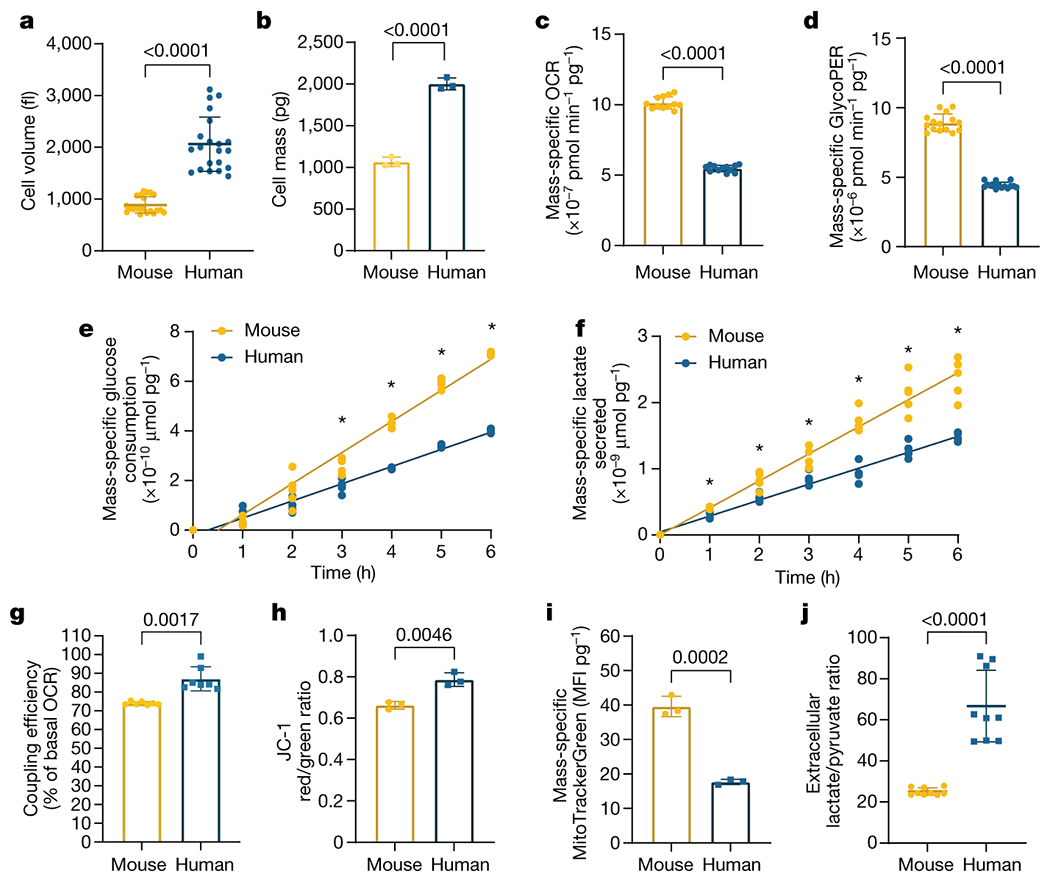
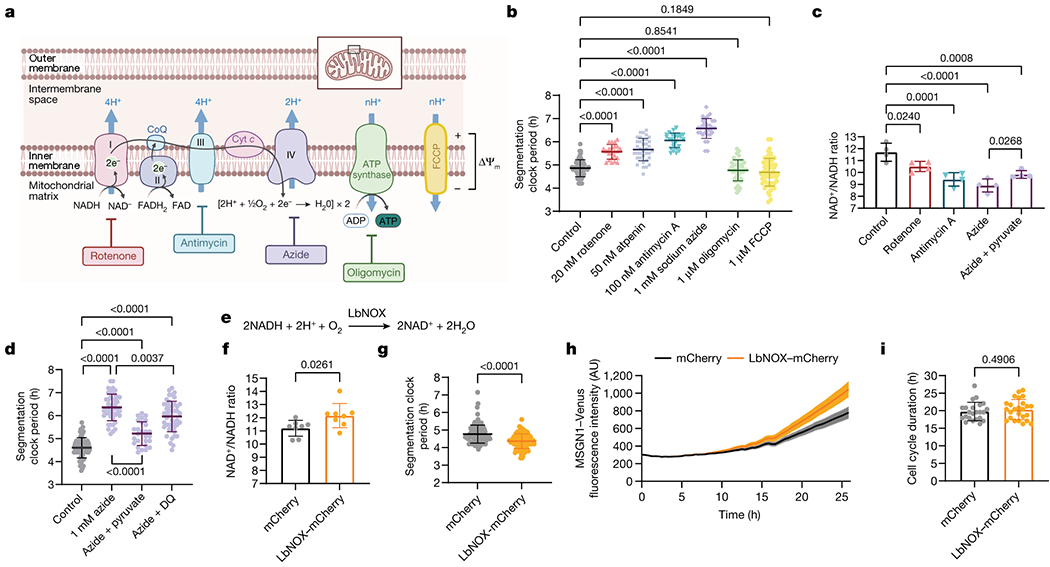
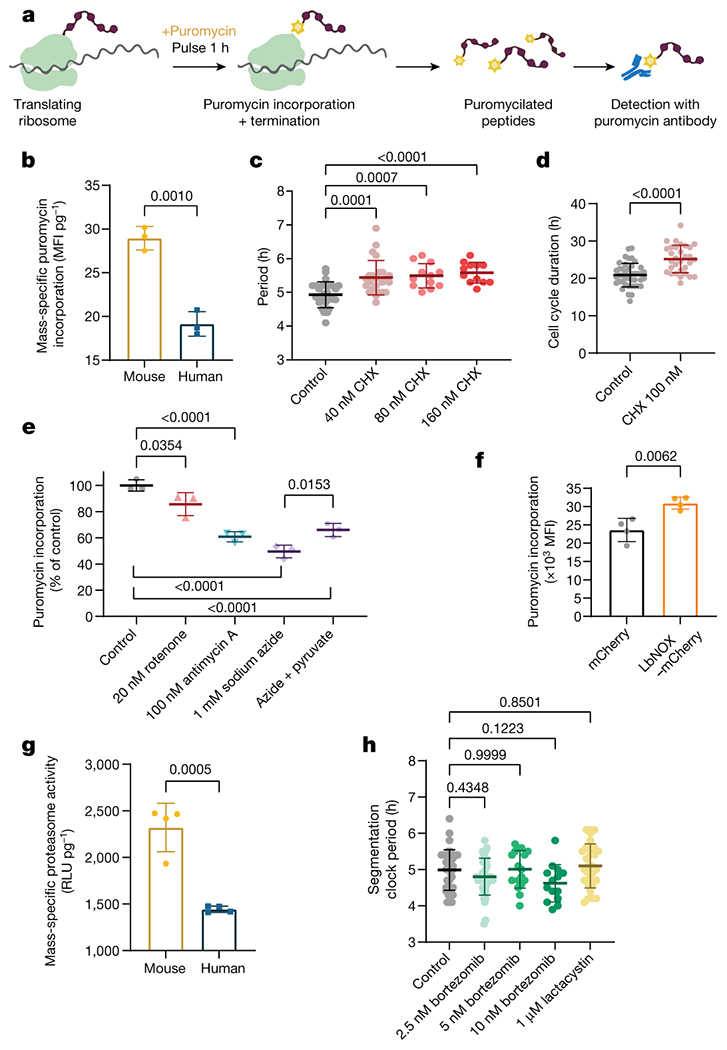
Animals display substantial inter-species variation in the rate of embryonic development despite a broad conservation of the overall sequence of developmental events. Differences in biochemical reaction rates, including the rates of protein production and degradation, are thought to be responsible for species-specific rates of development1-3. However, the cause of differential biochemical reaction rates between species remains unknown. Here, using pluripotent stem cells, we have established an in vitro system that recapitulates the twofold difference in developmental rate between mouse and human embryos. This system provides a quantitative measure of developmental speed as revealed by the period of the segmentation clock, a molecular oscillator associated with the rhythmic production of vertebral precursors. Using this system, we show that mass-specific metabolic rates scale with the developmental rate and are therefore higher in mouse cells than in human cells. Reducing these metabolic rates by inhibiting the electron transport chain slowed down the segmentation clock by impairing the cellular NAD+/NADH redox balance and, further downstream, lowering the global rate of protein synthesis. Conversely, increasing the NAD+/NADH ratio in human cells by overexpression of the Lactobacillus brevis NADH oxidase LbNOX increased the translation rate and accelerated the segmentation clock. These findings represent a starting point for the manipulation of developmental rate, with multiple translational applications including accelerating the differentiation of human pluripotent stem cells for disease modelling and cell-based therapies.


Conflict of interest statement

Competing interests: O.P. is scientific founder of Anagenesis Biotechnologies. S.R.M. is a co-founder of Travera and Affinity Biosensors, which develop technologies relevant to the research presented in this work. All other authors declare no competing interests.

Figures

Extended Data Figure 1.
The segmentation clock-period is cell-autonomous even in chimeric conditions. a. Representative micrographs of MSGN1-Venus fluorescence in mouse (left) and human (right) PSC-derived PSM cells on day 2 of differentiation. Note the reporter is cytoplasmic in mouse cells but nuclear in human cells. Similar results were obtained n=15 times. Scale bar = 400μm. b. Period of segmentation clock oscillations in primary PSM tissue dissected from E9.5 mouse embryos carrying the LuVeLu reporter (n=18) and PSC-derived PSM expressing the Hes7-Achilles reporter (n=24). Mean ±SD. Unpaired two-sided t-test. c. Cell cycle duration in primary PSM tissue dissected from E9.5 mouse embryos (n=27) and PSC-derived PSM (n=33). Mean ±SD. Unpaired two-sided t-test. d. Instantaneous HES7-Achilles oscillatory period over the course of 16 hours as calculated by Hilbert transformation for mouse PSM cells co-cultured with mouse (n=10) or human (n=7) non-reporter PSM cells. Mean ±SEM. e. Instantaneous HES7-Achilles oscillatory period over the course of 16 hours as calculated by Hilbert transformation for human PSM cells co-cultured with human (n=11) or mouse (n=8) non-reporter PSM cells. Mean ±SEM. f. Mean segmentation clock period as calculated by Hilbert transformation for mouse (left) or human (right) PSM cells co-cultured with either mouse or human non-reporter PSM cells. Mean ±SD. n=10 (mouse-mouse), n=9 (mouse-human), n=8 (human-mouse), n=10 (human-human). One-way ANOVA with Šidák correction. g. Mean amplitude of HES7-Achilles oscillations in mouse (left) or human (right) PSM cells co-cultured with either mouse or human non-reporter PSM cells. Mean ±SD. n=10 (mouse-mouse), n=9 (mouse-human), n=8 (human-mouse), n=10 (human-human). Kruskal-Wallis test with Dunn’s correction. h. Representative single-cell tracks of HES7-Achilles fluorescence for mouse PSM cells cultured with non-reporter mouse PSM cells. i. Representative single-cell tracks of HES7-Achilles fluorescence for mouse PSM cells cultured with non-reporter human PSM cells. j. Representative single-cell tracks of HES7-Achilles fluorescence for human PSM cells cultured with non-reporter human PSM cells. k. Representative single-cell tracks of HES7-Achilles fluorescence for human PSM cells cultured with non-reporter mouse PSM cells.
Extended Data Figure 2.
Comparison of metabolic and physical parameters in mouse vs. human PSM and neural progenitor cells a. HES7-Achilles oscillatory period in human PSM cells under control (DMSO; n=22) or 5μM aphidicolin (n=20) conditions. Cultures were pre-treated with DMSO or aphidicolin for 24 hours to induce cell cycle arrest. Mean ±SD. Unpaired two-sided t-test. b. Quantification of immunofluorescence staining for histone H3 phosphorylated at Ser10 in human PSM cells treated with vehicle control (DMSO) or 5 μM aphidicolin for 24 or 48 hours. Mean ±SD. n=5 biological replicates. c. Glycolytic proton efflux rate per cell for MSGN1-Venus+ PSC-derived mouse and human PSM cells. Same data as Fig. 2d but normalized by cell. Mean ±SD. n=15. Unpaired two-sided t-test. e. Oxygen consumption rate per cell for MSGN1-Venus+ PSC-derived mouse and human PSM cells. Same data as Fig. 2d but normalized by cell. Mean ±SD. n=12. Unpaired two-sided t-test. f. Total cell volume as measured in a suspended microchannel resonator for MSGN1-Venus+ PSC-derived mouse and human PSM cells. Each datapoint represents the mean of >200 individual cells. Mean ±SD. n=3 independent experiments. Unpaired two-sided t-test: p=5.9x10⁻⁵ g. Total cell density of MSGN1-Venus+ PSC-derived mouse and human PSM cells as measured on a suspended microchannel resonator. Each datapoint represents the mean of >200 individual cells. Mean ±SD. n=3 independent experiments. Unpaired two-sided t-test h. Dry mass as measured in a suspended microchannel resonator for MSGN1-Venus+ PSC-derived mouse and human PSM cells. Each datapoint represents the mean of >200 individual cells. Mean ±SD. n=3 independent experiments. Unpaired two-sided t-test. i. Dry volume as measured in a suspended microchannel resonator for MSGN1-Venus+ PSC-derived mouse and human PSM cells. Each datapoint represents the mean of >200 individual cells. Mean ±SD. n=3 independent experiments. Unpaired two-sided t-test. j. Dry density as measured in a suspended microchannel resonator for MSGN1-Venus+ PSC-derived mouse and human PSM cells. Each datapoint represents the mean of >200 individual cells. Mean ±SD. n=3 independent experiments. Unpaired two-sided t-test. k. Mass-specific extracellular acidification rate (ECAR) in MSGN1-Venus+ PSC-derived mouse and human PSM cells. Mean ±SD. n=15. Unpaired two-sided t-test: p=8.7x10⁻²³ l. Relative mass-specific glutamine consumption after 12 hours of culture for MSGN1-Venus+ PSC-derived mouse and human PSM cells. Mean ±SD. n=4 biological replicates. Unpaired two-sided t-test. m. Percent PAX6+ cells in mouse (day 5) and human (day 7) neural progenitor cultures as measured by intracellular staining and flow cytometry. Mean ±SD. n=3 independent experiments. n. Representative micrographs of immunofluorescence staining for PAX6 in PSC-derived mouse (left) and human (right) neural progenitor cells on days 5 and 7 of differentiation, respectively. Similar results were obtained n=3 times. Scale bar=200μm. o. Volume of mouse (day 5) and human (day 7) neural progenitor cells as measured by a coulter counter. Mean ±SD. n=3 independent experiments. Unpaired two-sided t-test. p. Mass-specific oxygen consumption rate for PSC-derived mouse and human neural progenitor cells. Mean ±SD. n=30. Unpaired two-sided t-test: p=1.69x10−51 q. Mass-specific extracellular acidification rate for PSC-derived mouse and human neural progenitor cells. Mean ±SD. n=36. Unpaired two-sided t-test: p=3.75x10⁻¹⁸
Extended Data Figure 3.
Stable isotope tracing of glucose and glutamine utilization patterns in mouse and human PSM cells a-f. Stable isotope labeling with 25mM U13C6-Glucose over the course of 48 hours for PSC-derived mouse and human PSM cells. Total fraction labeled by any isotopomer is expressed as 1-M0 for pyruvate (a), lactate (b), citrate (c), succinate (d), malate (e), and glutamate (f). Mean ±SD. n=3 independent experiments. g-l. Mass isotopomer distribution, adjusted for natural abundance, for pyruvate (e), lactate (f), citrate (g), succinate (h), malate (i), and glutamate (j) after 24 hours of labeling with 25mM U13C6-Glucose in mouse and human PSM cells. Labels in the x-axis correspond to distinct mass isotopomers with increasing number of heavy carbons. Mean ±SD. n=3 independent experiments. m-r. Mass isotopomer distribution, adjusted for natural abundance, for pyruvate (k), lactate (l), citrate (m), succinate (n), malate (o), and glutamate (p) after 24 hours of labeling with 4mM U13C5-Glutamine in mouse and human PSM cells. Labels in the x-axis correspond to distinct mass isotopomers with increasing number of heavy carbons. Mean ±SD. n=3 independent experiments.
Extended Data Figure 4.
Mitochondrial properties of mouse and human PSM cells a. Mass-specific oxygen consumption rate measured over the course of the mitochondrial stress test for MSGN1-Venus+ PSC-derived mouse (n=9) and human (n=7) PSM cells. 1μM oligomycin, 1μM FCCP, and 0.5μM Rotenone + 0.5μM Antimycin A were added at the timepoints marked by dotted lines. The first three timepoints denote basal respiration;, respiration after oligomycin addition corresponds to proton leak; FCCP induces maximal respiration; and rotenone/antimycin reveal non-mitochondrial respiration. Spare capacity refers to the difference between maximal and basal respiration rates. Mean ±SD. b. Spare respiratory capacity in MSGN1-Venus+ PSC-derived mouse and human PSM cells. Mean ±SD. n=7 biological replicates. Unpaired two-sided t-test: p=2.7x10⁻⁹ c. Oxygen consumption rate profiles for mitochondria isolated from mouse and human PSC-derived PSM cells. Rates correspond to 10ug mitochondria seeded per assay well. ETC complex I substrates pyruvate and malate were provided to fuel respiration. 2mM ADP, 5μM Oligomycin, 6μM FCCP, and 1μM Rotenone with 1μM Antimycin A were injected at the timepoints marked by dotted lines. First two timepoints correspond to basal respiration (state 2), followed by ADP-stimulated respiration (state 3), then leak respiration (state 4o), followed by maximal FCCP-stimulated respiration (state 3u), and finally non-mitochondrial respiration. Mean ±SD. n=5 biological replicates. d. Whole-cell NAD+/NADH ratio in MSGN1-Venus+ PSC-derived mouse and human PSM cells. Each datapoint represents the average of 3 technical replicates. Mean ±SD. n=6 biological replicates. Unpaired two-sided t-test: p=1.2x10⁻⁷ e. Whole-cell ADP/ATP ratio in MSGN1-Venus+ PSC-derived mouse and human PSM cells. Mean ±SD. n=9. Each datapoint represents the average of 3 technical replicates. Unpaired two-sided t-test: p=2.42x10⁻⁷ f. Percent viable cells as measured by trypan blue staining in human PSM cells treated with the indicated inhibitors for 24 hours. n=3 independent experiments.
Extended Data Figure 5.
Effect of electron transport chain inhibitors on the segmentation clock a. Basal oxygen consumption rate in human PSM cells treated with vehicle control (DMSO), 20nM rotenone, 50nM atpenin A5, 100nM antimycin A, 1mM sodium azide, 1μM oligomycin or 1μM FCCP. Mean ±SD. n=10 biological replicates. One-way ANOVA with Šidák correction: control vs. rotenone p=5.4x10⁻¹², control vs. atpenin p=4.3x10⁻¹¹, control vs. antimycin p=3.8x10⁻¹⁸, control vs. azide p=1.04x10⁻²⁰, control vs. oligomycin p=5.9x10⁻⁸, control vs. FCCP p=0.999 b. Number of HES7-Achilles oscillations observed in 25 hours for human PSM cells treated with vehicle control (DMSO, n=29), 20nM rotenone (n=10), 50nM atpenin A5 (n=17), 100nM antimycin A (n=11), 1mM sodium azide (n=15), 1μM oligomycin (n=11), or 1μM FCCP (n=7). n denotes independent experiments. Mean ±SD. One-way ANOVA with Šidák correction: control vs. rotenone p=1.1x10⁻¹⁰, control vs. atpenin p=2.3x10⁻¹², control vs. antimycin p=6.1x10⁻¹⁵, control vs. azide p=2.0x10⁻¹⁵, control vs. oligomycin p=4.7x10⁻¹⁰ c. Mean amplitude expressed as a percent of control for HES7-Achilles oscillations in human PSM cells treated with vehicle control (DMSO, n=53), 20nM rotenone (n=10), 50nM atpenin A5 (n=18), 100nM antimycin A (n=11), 1mM sodium azide (n=14), 1μM oligomycin (n=11), or 1μM FCCP (n=7). n denotes independent experiments. Mean ±SD. One-way ANOVA with Dunnett correction: control vs. oligomycin p=3.4x10⁻⁸ d. Mean segmentation clock period as calculated by Hilbert transformation for human PSM cells treated with vehicle control (DMSO, n=53), 20nM rotenone (n=10), 50nM atpenin A5 (n=18), 100nM antimycin A (n=11), 1mM sodium azide (n=14), 1μM oligomycin (n=11), or 1μM FCCP (n=7). n denotes independent experiments. Mean ±SD. One-way ANOVA with Šidák correction: control vs. rotenone p=8.9x10⁻²¹, control vs. atpenin p=1.8x10⁻¹⁸, control vs. antimycin p=2x10⁻¹⁵, control vs. azide p=1.4x10⁻³³ e. HES7-Achilles oscillatory profile in human PSM cultures treated with DMSO control (n=10) or 20nM rotenone (n=11). n denotes independent experiments. Mean ±SEM. f. HES7-Achilles oscillatory profile in human PSM cultures treated with DMSO control (n=12) or 50nM atpenin A5 (n=18). n denotes independent experiments. Mean ±SEM. g. HES7-Achilles oscillatory profile in human PSM cultures treated with DMSO control (n=11) or 100nM antimycin A (n=13). n denotes independent experiments. Mean ±SEM. h. HES7-Achilles oscillatory profile in human PSM cultures treated with DMSO control (n=9) or 1mM sodium azide (n=15). n denotes independent experiments. Mean ±SEM. i. HES7-Achilles oscillatory profile in human PSM cultures treated with DMSO control (n=12) or 1μM oligomycin (n=17). n denotes independent experiments. Mean ±SEM. j. HES7-Achilles oscillatory profile in human PSM cultures treated with DMSO control (n=3) or 1μM FCCP (n=7). n denotes independent experiments. Mean ±SEM. k. Instantaneous HES7-Achilles oscillatory period over time as calculated by Hilbert transformation in human PSM cultures treated with DMSO control (n=10) or 20nM rotenone (n=11). n denotes independent experiments. Mean ±SEM. l. Instantaneous HES7-Achilles oscillatory period over time as calculated by Hilbert transformation in human PSM cultures treated with DMSO control (n=12) or 50nM atpenin A5 (n=18). n denotes independent experiments. Mean ±SEM. m. Instantaneous HES7-Achilles oscillatory period over time as calculated by Hilbert transformation in human PSM cultures treated with DMSO control (n=11) or 100nM antimycin A (n=13). n denotes independent experiments. Mean ±SEM. n. Instantaneous HES7-Achilles oscillatory period over time as calculated by Hilbert transformation in human PSM cultures treated with DMSO control (n=9) or 1mM sodium azide (n=15). n denotes independent experiments. Mean ±SEM. o. Instantaneous HES7-Achilles oscillatory period over time as calculated by Hilbert transformation in human PSM cultures treated with DMSO control (n=12) or 1μM oligomycin (n=17). n denotes independent experiments. Mean ±SEM. p. Instantaneous HES7-Achilles oscillatory period over time as calculated by Hilbert transformation in human PSM cultures treated with DMSO control (n=3) or 1μM FCCP (n=7). n denotes independent experiments. Mean ±SEM. q. Instantaneous HES7-Achilles oscillatory amplitude over time as calculated by Hilbert transformation in human PSM cultures treated with DMSO control (n=10) or 20nM rotenone (n=11). n denotes independent experiments. Mean ±SEM. r. Instantaneous HES7-Achilles oscillatory amplitude over time as calculated by Hilbert transformation in human PSM cultures treated with DMSO control (n=12) or 50nM atpenin A5 (n=18). n denotes independent experiments. Mean ±SEM. s. Instantaneous HES7-Achilles oscillatory amplitude over time as calculated by Hilbert transformation in human PSM cultures treated with DMSO control (n=11) or 100nM antimycin A (n=13). n denotes independent experiments. Mean ±SEM. t. Instantaneous HES7-Achilles oscillatory amplitude over time as calculated by Hilbert transformation in human PSM cultures treated with DMSO control (n=9) or 1mM sodium azide (n=15). n denotes independent experiments. Mean ±SEM. u. Instantaneous HES7-Achilles oscillatory amplitude over time as calculated by Hilbert transformation in human PSM cultures treated with DMSO control (n=12) or 1μM oligomycin (n=17). n denotes independent experiments. Mean ±SEM. v. Instantaneous HES7-Achilles oscillatory amplitude over the time as calculated by Hilbert transformation in human PSM cultures treated with DMSO control (n=3) or 1μM FCCP (n=7). n denotes independent experiments. Mean ±SEM. w. Inner mitochondrial membrane potential (ΔΨm) in human PSM cells under control conditions or treated acutely with 1μM FCCP. TMRM fluorescence was normalized by mitochondrial content (MitoTracker Green) following flow cytometry. Mean ±SD. n=3 biological replicates. Unpaired two-sided t-test: p=6.4x10⁻⁷
Extended Data Figure 6.
Increased ATP concentrations do not accelerate the segmentation clock a. Illustration depicting the alternate fates of pyruvate and their regulation by metabolic enzymes. Lactate dehydrogenase (LDH) converts pyruvate to lactate and regenerates NAD+ from NADH. Pyruvate dehydrogenase (PDH) oxidizes pyruvate to acetyl coenzyme-A (acetyl-CoA) in the mitochondria and consumes NAD+. Acetyl -CoA then enters the tricarboxylic acid (TCA) cycle, which also consumes NAD+. Pyruvate dehydrogenase kinase (PDK) inhibits PDH by phosphorylating it. DCA is a PDK inhibitor that promotes the conversion of pyruvate to acetyl-CoA by relieving PDH inhibition. Created withBioRender.com. b. ATP content per well for human PSM cells in control (water; n=6), 25mM succinate supplementation (n=6), 10mM galactose in the absence of glucose (n=6), and 6.25mM DCA (n=8) conditions after 24 hours of culture. In each case, 30,000 cells were seeded per assay well. Each datapoint represents the average of 3 technical replicates. Mean ±SD. One-way ANOVA with Šidák correction: control vs. succinate p=2x10⁻⁵, control vs. galactose p=1.6x10⁻⁸, control vs. DCA p=7.4x10⁻⁶ c. Ratio of Oxygen consumption rate (OCR) to extracellular acidification rate (ECAR) in human PSM cells treated with water control (n-18), 25mM succinate (n=15), 6.25mM DCA (n=18), or cultured with 10mM galactose instead of glucose (n=18) for 24 hours. Mean ±SD. One-way Brown-Forsythe and Welch ANOVA with Dunnett T3 correction: control vs. galactose p=2.5x10⁻¹² d. Oxygen consumption rate (OCR) in human PSM cells treated with water control (n=18), 25mM succinate (n=15), 6.25mM DCA (n=18), or cultured with 10mM galactose instead of glucose (n=18) for 24 hours. Mean ±SD. One-way ANOVA with Dunnett correction: control vs. DCA p=3.8x10⁻¹⁸ e. Extracellular acidification rate (ECAR) in human PSM cells treated with water control (n=18), 25mM succinate (n=15), 6.25mM DCA (n=18), or cultured with 10mM galactose instead of glucose (n=18) for 24 hours. Mean ±SD. One-way ANOVA with Šidák correction: control vs. galactose p=3.05x10−51, control vs. DCA p=1x10⁻²⁸ f. Percent of total ATP production corresponding to glycolysis (glycoATP) or mitochondrial respiration (mitoATP) in human PSM cells treated with water control (n=6), 25mM succinate (n=5), 6.25mM DCA (n=6), or cultured with 10mM galactose instead of glucose (n=6) for 24 hours. Mean ±SD. g. HES7-Achilles oscillatory period in human PSM cells treated with vehicle control (water; n=36), 25mM succinate (n=23), 10mM galactose in the absence of glucose (n=43), and 6.25mM DCA (n=34). Mean ±SD. One-way ANOVA with Šidák correction: control vs. galactose p=5.9x10⁻⁷, control vs. DCA p=3.1x10⁻⁵ h. HES7-Achilles oscillatory profile in human PSM cells cultured under control conditions or supplemented with 25mM succinate. Mean ±SEM. n=8. i. HES7-Achilles oscillatory profile in human PSM cells cultured with either 10mM glucose or 10mM galactose. Mean ±SEM. n=6. j. HES7-Achilles oscillatory profile in human PSM cultures under control conditions (n=9) or 6.25mM DCA (n=8). Mean ±SEM. k. Instantaneous HES7-Achilles oscillatory period over time as calculated by Hilbert transformation in human PSM cells cultured under control conditions or supplemented with 25mM succinate. Mean ±SEM. n=8. l. Instantaneous HES7-Achilles oscillatory period over time as calculated by Hilbert transformation in human PSM cells cultured with either 10mM glucose or 10mM galactose. Mean ±SEM. n=6. m. Instantaneous HES7-Achilles oscillatory period over time as calculated by Hilbert transformation in human PSM cells cultured under control conditions (n=9) or supplemented with 6.25mM DCA (n=7). Mean ±SEM. n. Instantaneous HES7-Achilles oscillatory amplitude over time as calculated by Hilbert transformation in human PSM cells cultured under control conditions or supplemented with 25mM succinate. Mean ±SEM. n=8. o. Instantaneous HES7-Achilles oscillatory amplitude over time as calculated by Hilbert transformation in human PSM cells cultured with either 10mM glucose or 10mM galactose. Mean ±SEM. n=6. p. Instantaneous HES7-Achilles oscillatory amplitude over time as calculated by Hilbert transformation in human PSM cells cultured under control conditions (n=9) or supplemented with 6.25mM DCA (n=8). Mean ±SEM. q. Mean segmentation clock period as calculated by Hilbert transformation for human PSM cells treated with vehicle control (water; n=21), 25mM succinate (n=8), 10mM galactose in the absence of glucose (n=6), and 6.25mM DCA (n=8). n denotes independent experiments. Mean ±SD. One-way ANOVA with Šidák correction: contro vs. galactose p=3.3x10⁻¹², control vs. DCA p=1.4x10⁻¹⁰. r. Mean amplitude expressed as a percent of control for HES7-Achilles oscillations in human PSM cells treated with vehicle control (water; n=22), 25mM succinate (n=8), 10mM galactose in the absence of glucose (n=6), and 6.25mM DCA (n=7). n denotes independent experiments. Mean ±SD. One-way ANOVA with Dunnett correction. s. Number of HES7-Achilles oscillations observed in 25 hours for human PSM cells treated with vehicle control (water; n=23), 25mM succinate (n=8), 10mM galactose in the absence of glucose (n=6), and 6.25mM DCA (n=8). n denotes independent experiments. Mean ±SD. One-way ANOVA with Dunnett correction. t. Duration of the cell cycle in hours for human PSM cells treated with vehicle control (DMSO; n=42), 25mM succinate (n=44), 10mM galactose in the absence of glucose (n=18), and 6.25mM DCA (n=30). Mean ±SD. One-way ANOVA with Dunnett correction: control vs. galactose p=1.2x10⁻¹²
Extended Data Figure 7.
Rescue of the segmentation clock period by restoration of the NAD+/NADH ratio a. Whole-cell NAD+/NADH ratio in vehicle-treated human PSM cells and cells treated with either 6.25mM DCA alone or DCA in combination with 1mM sodium pyruvate or 10nM FCCP for 24 hours. Each datapoint represents the average of 3 technical replicates. Mean ±SD. n=4. One-way ANOVA with Dunnett correction. b. Inner mitochondrial membrane potential (ΔΨm) in human PSM cells under control conditions or treated with 6.25mM DCA for 24 hours. TMRM fluorescence was normalized by mitochondrial content (MitoTracker Green) following flow cytometry. Mean ±SD. n=3 biological replicates. Unpaired two-sided t-test. c. Peredox-mCherryNLS fluorescence lifetime in human PSM cells cultured acutely in a balanced salt solution and supplemented with the indicated concentrations of glucose, lactate or pyruvate. Mean ±SD. n=4 biological replicates. d. Ratiometric Peredox-to-mCherry fluorescence signal in human PSM cells cultured acutely in a balanced salt solution and supplemented with the indicated concentrations of glucose, lactate or pyruvate. Mean ±SD. n=6 biological replicates. e. Ratiometric Peredox/mCherry signal in vehicle-treated human PSM cells and cells treated with either 6.25mM DCA alone or DCA in combination with 1mM sodium pyruvate or 10nM FCCP for 24 hours. Each datapoint represents the average of >200 individual cells analyzed within a biological replicate. Mean ±SD. n=6 biological replicates. One-way ANOVA with Dunnett correction. f. HES7-Achilles oscillatory period in human PSM cells treated with vehicle control (water; n=78), 6.25mM DCA alone (n=68), DCA with 1mM sodium pyruvate (n=73), and DCA with 10nM FCCP (n=85). Mean ±SD. One-way ANOVA with Dunnett correction. g. Inner mitochondrial membrane potential (ΔΨm) in human PSM cells under control conditions or treated with 25mM succinate for 24 hours. TMRM fluorescence was normalized by mitochondrial content (MitoTracker Green) following flow cytometry. Mean ±SD. n=3 biological replicates. Unpaired two-sided t-test. h. Whole-cell NAD+/NADH ratio in vehicle-treated human PSM cells and cells treated with either 25mM succinate alone or succinate in combination with 1mM sodium pyruvate for 24 hours. Each datapoint represents the average of 3 technical replicates. Mean ±SD. n=3 biological replicates. One-way ANOVA with Dunnett correction. i. HES7-Achilles oscillatory period in human PSM cells treated with vehicle control (water; n=62), 25mM succinate alone (n=46), or succinate with 1mM sodium pyruvate (n=46). Mean ±SD. One-way ANOVA with Dunnett correction. j. Ratiometric Peredox/mCherry signal in DMSO-treated human PSM cells and cells treated with 20nM rotenone, 100nM antimycin A, 1mM sodium azide alone, azide with 1mM sodium pyruvate, and azide with 5μM duroquinone (DQ) for 24 hours. Each datapoint represents the average of >200 individual cells analyzed in a biological replicate. Mean ±SD. n=6. One-way ANOVA with Šidák correction: control vs. rotenone p= 2.9x10⁻¹⁵, control vs. antimycin p=7.1x10⁻¹⁷, control vs. azide p=4.4x10⁻²², control vs. azide+pyr p=3.3x10⁻¹⁶, control vs. azide+DQ p=2.2x10⁻¹⁹, azide vs. azide+pyr p=9.7x10⁻¹⁰, azide vs. azide+DQ p=5.3x10⁻⁶ k. HES7-Achilles oscillatory profile in human PSM cells cultures treated with DMSO control (n=10), 1mM sodium azide alone (n=13), and azide with 1mM sodium pyruvate (n=13). Mean ±SEM. l. Whole-cell NAD+/NADH ratio in human PSM cells treated with vehicle-control (n=5), 1mM sodium azide alone (n=5), or azide with 5μM duroquinone (DQ) (n=6) for 24 hours. Each datapoint represents the average of 3 technical replicates. Mean ±SD. One-way ANOVA with Tukey correction: control vs. azide p=3.5x10⁻⁸, control vs. azide+DQ p=1.8x10⁻⁸ m. HES7-Achilles oscillatory profile in human PSM cells cultures treated with DMSO control (n=11), 1mM sodium azide alone (n=19), and azide with 5μM duroquinone (n=21). Mean ±SEM.
Extended Data Figure 8.
Modulation of the segmentation clock period by direct manipulation of the NAD+/NADH ratio a. Whole-cell NAD+/NADH ratio human PSM cells under control conditions or treated acutely with 10mM oxamate. Each datapoint represents the average of 3 technical replicates. Mean ±SD. n=6. Unpaired two-sided t-test. b. Ratiometric Peredox/mCherry signal in human PSM cells cultured under control conditions or treated acutely with 10mM oxamate. Each datapoint represents the average of >200 individual cells analyzed within a biological replicate. Mean ±SD. n=3. Unpaired two-sided t-test, p=8.3x10⁻⁵ c. Period of HES7-Achilles oscillations in human PSM cells cultures treated with water control (n=73) or 10mM sodium oxamate (n=17). Mean ±SEM. Unpaired two-sided t-test. d. Mean segmentation clock period as calculated by Hilbert transformation for human PSM cells cultures treated with water control (n=10) or 10mM sodium oxamate (n=6). n denotes independent experiments. Mean ±SD. Unpaired two-sided t-test. e. HES7-Achilles oscillatory profile in human PSM cells cultures treated with water control (n=10) or 10mM sodium oxamate (n=3). n denotes independent experiments. Mean ±SEM. f. Instantaneous HES7-Achilles oscillatory period over time as calculated by Hilbert transformation in human PSM cells cultures treated with water control (n=10) or 10mM sodium oxamate (n=3). n denotes independent experiments. Mean ±SEM. g. Instantaneous HES7-Achilles oscillatory amplitude over time as calculated by Hilbert transformation in human PSM cells cultures treated with water control (n=10) or 10mM sodium oxamate (n=3). n denotes independent experiments. Mean ±SEM. h. Number of HES7-Achilles oscillations observed in 25 hours in human PSM cells cultures treated with water control (n=10) or 10mM sodium oxamate (n=6). n denotes independent experiments. Mean ±SD. Unpaired two-sided t-test. i. Representative micrographs of DAPI nuclear stain, mCherry endogenous fluorescence, and anti-FLAG immunofluorescence (LbNOX is flag-tagged in the C terminus [28]) in human PSM cells subjected to mock transduction (top) or transduced with LbNOX-mCherry (bottom). Similar results were obtained n=15 times. Scale bar = 100μm. j. Non-mitochondrial oxygen consumption in human PSM cells transduced with a lentivirus expressing either mCherry alone (n=12) or LbNOX in combination with mCherry (n=14). OCR after addition of 0.5μM rotenone and 0.5μM antimycin A is expressed as fraction of basal OCR. Mean ±SD. Unpaired two-sided t-test: p=1.04x10⁻⁸ k. HES7-Achilles oscillatory profile over the course of 40 hours for human PSM cells transduced with a lentivirus expressing either mCherry alone (n=16) or LbNOX in combination with mCherry (n=14). Mean ±SEM. l. Mean segmentation clock period as calculated by Hilbert transformation for human PSM cells transduced with a lentivirus expressing either mCherry alone (n=13) or LbNOX in combination with mCherry (n=12). Mean ±SD. Unpaired two-sided t-test: p=4.87x10⁻⁸ m Instantaneous HES7-Achilles oscillatory period over time as calculated by Hilbert transformation in human PSM cells transduced with a lentivirus expressing either mCherry alone (n=13) or LbNOX in combination with mCherry (n=12). Mean ±SD. n. Mean HES7-Achilles oscillation amplitude in human PSM cells transduced with a lentivirus expressing either mCherry alone (n=16) or LbNOX in combination with mCherry (n=14). Mean ±SD. Unpaired two-sided t-test. o. Instantaneous HES7-Achilles oscillatory amplitude over time as calculated by Hilbert transformation in human PSM cells transduced with a lentivirus expressing either mCherry alone (n=16) or LbNOX in combination with mCherry (n=14). Mean ±SD. p. Number of oscillations (peaks) observed in 25 hours for human PSM cells transduced with a lentivirus expressing either mCherry alone (n=16) or LbNOX in combination with mCherry (n=14). Mean ±SD. Unpaired two-sided t-test.
Extended Data Figure 9.
The segmentation clock is sensitive to the rate of translation a. Mass-specific OPP-Puromycin incorporation as a measure of global translation rate in MSGN1-Venus+ PSC-derived mouse and human PSM cells. OPP-Puromycilated peptides were detected by click chemistry with AlexaFluor647-Picoyl Azide. Mean ±SD. n=3 biological replicates. Unpaired two-sided t-test. b. Translation rate as measured by puromycin incorporation expressed as percent of control for human PSM cells treated with DMSO, 40nM, 80nM or 160nM cycloheximide (CHX) for 24 hours. Mean ±SD. n=3 biological replicates. One-way ANOVA with Dunnett correction. c. Mean segmentation clock period as calculated by Hilbert transformation for human PSM cells treated with DMSO (n=6), 40nM (n=4), 80nM (n=5) or 160nM (n=4) cycloheximide (CHX) for 24 hours. n denotes independent experiments. Mean ±SD. One-way ANOVA with Šidák correction: control vs. 40nM p=7.6x10⁻⁵, control vs. 80nM p=4.5x10⁻⁶, control vs. 160nM p=4.2x10⁻⁵ d. Number of HES7-Achilles oscillations observed in 25 hours in human PSM cells treated with DMSO (n=6), 40nM (n=4), 80nM (n=5) or 160nM (n=5) cycloheximide (CHX) for 24 hours. n denotes independent experiments. Mean ±SD. e. Mean amplitude expressed as a percent of control in human PSM cells treated with DMSO (n=6), 40nM (n=4), 80nM (n=5) or 160nM (n=4) cycloheximide (CHX) for 24 hours. n denotes independent experiments. Mean ±SD. One-way ANOVA with Dunnett correction f. HES7-Achilles oscillatory profile for human PSM cells treated with DMSO-control (n=3) or 80nM cycloheximide (CHX; n=5). n denotes independent experiments. Mean ±SEM. g. Instantaneous HES7-Achilles oscillatory period over time as calculated by Hilbert transformation for human PSM cells treated with DMSO-control (n=3) or 80nM cycloheximide (CHX, n=5). n denotes independent experiments. Mean ±SEM. h. Instantaneous HES7-Achilles oscillatory amplitude over time as calculated by Hilbert transformation for human PSM cells treated with DMSO-control (n=3) or 80nM cycloheximide (CHX, n=5). n denotes independent experiments. Mean ±SEM. k. Translation rate as measured by incorporation of the methionine analog AHA in human PSM cells treated with either DMSO control or 1mM sodium azide for one hour. Mean ±SD. n=3 biological replicates. Unpaired two-sided t-test. j. Oxygen consumption rate measured over the course of the mitochondrial stress test for human PSM cells treated with DMSO control or 100nM cycloheximide for 24 hours. 1μM Oligomycin, 1μM FCCP, and 0.5μM Rotenone + 0.5μM Antimycin A were added at the timepoints marked by dotted lines. Mean ±SD. n=9 biological replicates. k. Spare respiratory capacity in human PSM cells treated with vehicle control (DMSO) or 100nM cycloheximide (CHX) for 24 hours. Mean ±SD. n=8 biological replicates. Unpaired two-sided t-test. l. Coupling efficiency shown as the percent of basal oxygen consumption that is linked to ATP production in human PSM cells treated with vehicle control (DMSO) or 100nM cycloheximide (CHX) for 24 hours. Mean ±SD. n=8 biological replicates. Unpaired two-sided t-test.
Extended Data Figure 10.
Protein stability differences between mouse and human PSM cells a. Pulse-chase experiment tracking the degradation of puromycilated peptides over the course of 12 hours in MSGN1-Venus+ PSC-derived mouse and human PSM cells following a 1-hour pulse with puromycin. Solid line represents best one-phase decay fit with the 95% confidence intervals shown as shaded regions. n=3 independent experiments. b. Mean amplitude expressed as a percent of control in human PSM treated with DMSO control (n=9), 2.5nM (n=6), 5nM (n=13) or 10nM (n=12) bortezomib, or 1μM lactacystin (n=8). n denotes independent experiments. Mean ±SD. One-way ANOVA with Dunnett correction. c. Number of HES7-Achilles oscillations observed in 25 hours in human PSM treated with DMSO control (n=17), 2.5nM (n=6), 5nM (n=13) or 10nM (n=12) bortezomib, or 1μM lactacystin (n=9). n denotes independent experiments. Mean ±SD. One-way ANOVA with Šidák correction: control vs. 5nM bortezomib p=2.4x10⁻¹⁹, control vs. 10nM bortezomib p=1.8x10⁻²² d. Mean segmentation clock period as calculated by Hilbert transformation for human PSM cells treated with DMSO control (n=10) or 2.5nM bortezomib (BTZ, n=6). n denotes independent experiments. Mean ±SD. Unpaired two-sided t-test. e. Mean segmentation clock period as calculated by Hilbert transformation for human PSM cells treated with DMSO control (n=9) or 1μM lactacystin (n=8). n denotes independent experiments. Mean ±SD. Unpaired two-sided t-test. f. HES7-Achilles oscillatory profile for human PSM cells treated with DMSO-control (n=9), 5nM bortezomib (n=13), or 1μM lactacystin (n=8). Mean ±SEM. g. stantaneous HES7-Achilles oscillatory period over time as calculated by Hilbert transformation for human PSM cells treated with DMSO-control (n=9), 2.5nM bortezomib (n=6), or 1μM lactacystin (n=8). Mean ±SEM. h. Instantaneous HES7-Achilles oscillatory amplitude over time as calculated by Hilbert transformation for human PSM cells treated with DMSO-control (n=9), 5nM bortezomib (n=13), or 1μM lactacystin (n=8). Mean ±SEM. i. Proteasome activity cells as measured by cleavage of a luminogenic proteasome substrate in human PSM treated with DMSO control, 2.5nM, 5nM or 10nM bortezomib, or 1μM lactacystin for 24 hours. Mean ±SD. n=6 biological replicates. One-way ANOVA with Šidák correction: control vs. 2.5nM bortezomib p=5.8x10⁻⁸, control vs. 5nM bortezomib p=1.2x10⁻⁹, control vs. 10nM bortezomib p=4.3x10⁻¹³, control vs. 1μM lactacystin p=2.2x10⁻¹⁰. j. Proteasome activity cells as measured by cleavage of a luminogenic proteasome substrate in human PSM treated with DMSO control, 100nM antimycin A, or 1mM sodium azide for 24 hours. Mean ±SD. n=3 biological replicates. One-way ANOVA with Šidák correction: control vs. antimycin p=1.3x10⁻⁵, control vs. azide p=3.1x10⁻⁷ k. Pulse-chase experiment tracking the degradation of puromycilated peptides over the course of 12 hours in human PSM cells treated with DMSO control or 1mM sodium azide following a 1-hour pulse with puromycin. Solid line represents best one-phase decay fit with the 95% confidence intervals shown as shaded regions. n=3 independent experiments. l. Pulse-chase experiment tracking the degradation of AHA-labeled proteins over the course of 30 hours in human PSM cells treated with DMSO control of 1mM sodium azide following a 1-hour pulse with AHA. Solid line represents best one-phase decay fit with the 95% confidence intervals shown as shaded regions. n=3 independent experiments.
Figure 1.
Figure 1.
Cell-autonomous differences in developmental rate between differentiating mouse and human PSM cells a. Schematic illustrating the differentiation of mouse and human PSCs towards PSM fate. The accelerated developmental pace of mouse cells is reflected in the reduced induction time and short oscillatory period relative to human cells. EpiLCs = Epiblast-Like Cells, iPSCs = induced Pluripotent Stem Cells. b. PSM induction efficiency over the course of 3 days of differentiation for mouse and human PSCs. The percentage of cells expressing MSGN1-Venus was assessed by flow cytometry. n=5 independent experiments. c. Duration of the cell cycle in hours for PSC-derived mouse and human PSM cells. Mean ±SD. n=33 (mouse); n=26 (human). Unpaired two-sided t-test: p=2.88x10⁻¹⁵ d. HES7-Achilles oscillation profiles for PSC-derived mouse and human PSM cells over the course of 18 hours. Mean ±SEM. n=5 independent experiments. e. Period of HES7-Achilles oscillations in PSC-derived mouse and human PSM cells. Mean ±SD. n=25. Unpaired two-sided t-test: p=7.33x10−41 f. Left: Experimental strategy for the co-culture of CAG-H2B-mCherry; HES7-Achilles human or CAG-NLS-BFP; Hes7-Achilles mouse PSM cells with non-reporter mouse (E14) or human (NCRM1) PSM cells at a ratio of 1:100. Right: Merged brightfield and human HES7-Achilles fluorescence images of human-human (top) and human-mouse (bottom) co-cultures. Scale bar = 100μm. g. Period of HES7-Achilles oscillations in mouse (left) or human (right) HES7-Achilles PSM cells co-cultured with an excess of either mouse or human non-reporter PSM cells. Mean ±SD. n=56 (mouse-mouse), n=56 (mouse-human), n=41 (human-mouse), n=53 (human-human). One-way ANOVA with Šidák correction.
Figure 2.
Figure 2.
Elevated mass-specific metabolic rates in mouse PSM cells compared to human PSM cells a. Volume of MSGN1-Venus+ PSC-derived mouse and human PSM cells as measured with a coulter counter. Mean ±SD. n=21. Unpaired two-sided t-test: p=3.25x10⁻¹² b. Total cell mass of MSGN1-Venus+ PSC-derived mouse and human PSM cells as measured on a suspended microchannel resonator. Each datapoint represents the mean of >200 individual cells. Mean ±SD. n=3 independent experiments. Unpaired two-sided t-test: p=5.77x10⁻⁵ c. Mass-specific oxygen consumption rate for MSGN1-Venus+ PSC-derived mouse and human PSM cells. Mean ±SD. n=12. Unpaired two-sided t-test: p=3.19x10⁻²⁰ d. Mass-specific glycolytic proton efflux rate for MSGN1-Venus+ PSC-derived mouse and human PSM cells. Mean ±SD. n=15. Unpaired two-sided t-test: p=5.05x10⁻²¹ e. Mass-specific cumulative glucose consumption for MSGN1-Venus+ PSC-derived mouse and human PSM cells. n=5. *denotes p<0.05, multiple unpaired two-sided t-tests with FDR=1%, p values: 1 hour=0.6074, 2 hours=0.0691, 3 hours=0.0013, 4 hours=7.44x10⁻⁸, 5 hours=2.29x10⁻⁹, 6 hours=3.58x10⁻¹². f. Mass-specific cumulative lactate secretion for MSGN1-Venus+ PSC-derived mouse and human PSM cells. n=5. *denotes p<0.05, multiple unpaired two-sided t-tests with FDR=1%, p values: 1 hour=0.00364, 2 hours=0.00246, 3 hours=0.0128, 4 hours=0.000039, 5 hours=0.000259, 6 hours=0.000172 g. Coupling efficiency shown as the percent of basal oxygen consumption linked to ATP production in MSGN1-Venus+ PSC-derived mouse and human PSM cells. Mean ±SD. n=7 biological replicates. Unpaired two-sided t-test. h. Inner mitochondrial membrane potential (ΔΨm) in PSC-derived mouse and human PSM cells as measured by the ratiometric JC-1 dye. Mean ±SD. n=4 biological replicates. Unpaired two-sided t-test. i. Mass-specific mitochondrial content (MitoTracker Green) in PSC-derived mouse and human PSM cells. Mean ±SD. n=6 biological replicates. Unpaired two-sided t-test j. Extracellular lactate to pyruvate ratio in PSC-derived mouse and human PSM cells, which reflects the cytosolic NADH/NAD+ ratio. Mean ±SD. n=9. Unpaired two-sided t-test with Welch’s correction: p=9.02x10⁻⁵
Figure 3.
Figure 3.
Regulation of the segmentation clock by the NAD+/NADH ratio a. Electron transport chain and relevant small molecule inhibitors. Adapted from “Electron Transport Chain” by BioRender.com (2021). Retrieved from https://app.biorender.com/biorender-templates b. HES7-Achilles oscillatory period in human PSM cells treated with DMSO control (n=53), 20nM rotenone (n=23), 50nM atpenin A5 (n=36), 100nM antimycin A (n=26), 1mM sodium azide (n=30), 1μM oligomycin (n=44), and 1μM FCCP (n=55) for 24 hours. Mean ±SD. One-way ANOVA with Šidák correction: rotenone p=1.1x10⁻⁸, atpenin p=6.4x10⁻¹⁴, antimycin p=1.85x10⁻²³, azide p=1.88x10−42. c. Whole-cell NAD+/NADH ratio in human PSM cells treated with DMSO control, 20nM rotenone, 100nM antimycin A, 1mM sodium azide, and 1mM sodium azide with 1mM sodium pyruvate for 24 hours. Mean ±SD. n=4 biological replicates. One-way ANOVA with Dunnett correction: control vs. azide p=1.1x10⁻⁵ d. HES7-Achilles oscillatory period in human PSM cells treated with DMSO control (n=67),1mM sodium azide alone (n=46), azide with 1mM sodium pyruvate (n=27), and azide with 5μM duroquinone (n=46). Mean ±SD. One-way ANOVA with Tukey’s correction: control vs. azide p=7.4x10⁻¹⁴, control vs. azide+pyr p=1.2x10⁻⁵, control vs. azide+DQ p=7.5x10⁻¹⁴, azide vs. azide+pyr p=1.4x10⁻¹³ e. NADH oxidation reaction catalyzed by LbNOX [28]. f. Whole-cell NAD+/NADH ratio in human PSM cells transduced with a lentivirus expressing either mCherry alone or LbNOX with mCherry. Mean ±SD. n=8 biological replicates. Unpaired two-sided t-test. g. HES7-Achilles oscillatory period in human PSM cells transduced with a lentivirus expressing either mCherry alone (n=113) or LbNOX with mCherry (n=116). Mean ±SD. Unpaired two-sided t-test: p=3.7x10⁻¹⁰ h. MSGN1-Venus fluorescence during days 1–2 of human PSM differentiation, transduced with a lentivirus expressing either mCherry alone or LbNOX with mCherry. Mean ±SEM. n=7 biological replicates. i. Cell cycle length in human PSM cells transduced with a lentivirus expressing either mCherry alone (n=23) or LbNOX with mCherry (n=25). Mean ±SD. Unpaired two-sided t-test.
Figure 4.
Figure 4.
The global rate of protein synthesis acts downstream of the electron transport chain to regulate developmental speed a. Experimental approach to measure global protein synthesis by detection of puromycilated peptides following a 1-hour pulse with puromycin (puro). Created withBioRender.com. b. Mass-specific global translation rate as measured by puromycin incorporation in MSGN1-Venus+ PSC-derived mouse and human PSM cells immediately after a 1-hour puromycin pulse and detection by directly conjugated AlexaFluor647 anti-puromycin antibody. Mean ±SD. n=3 biological replicates. Unpaired two-sided t-test. c. Period of HES7-Achilles oscillations in human PSM cells treated with vehicle control (DMSO, n=27) or increasing doses of cycloheximide (40nM, n=24; 80nM, n=12; 160nM, n=12). Mean ±SD. One-way ANOVA with Dunnett correction: control vs. 160nM CHX p=7.1x10⁻⁵ d. Duration of the cell cycle in control (DMSO-treated; n=42) human PSM cells and cells treated with 100nM cycloheximide (CHX; n=31). Mean ±SD. Unpaired two-sided t-test, p=1.1x10⁻⁶ e. Relative translation rate expressed as puromycin incorporation normalized to control (DMSO treatment) in human PSM cells treated with 20nM rotenone, 100nM antimycin A, 1mM sodium azide, and azide with 1mM sodium pyruvate for 24 hours. Mean ±SD. n=3 biological replicates. One-way ANOVA with Šidák correction: control vs. antimycin p=2.8x10⁻⁵, control vs. azide p=2.8x10⁻⁶, control vs. azide+pyr p=9.6x10⁻⁵ f. Global translation rate as measured by puromycin incorporation in human PSM cells transduced with a lentivirus expressing either mCherry alone or LbNOX with mCherry. Mean ±SD. n=4 biological replicates. Unpaired two-sided t-test. g. Mass-specific proteasome activity in MSGN1-Venus+ PSC-derived mouse and human PSM cells as measured by cleavage of a luminogenic proteasome substrate. Mean ±SD. n=4 biological replicates. Unpaired two-sided t-test. h. Period of HES7-Achilles oscillations in human PSM cells treated with DMSO control (n=35), 2.5nM (n=37), 5nM (n=17) or 10nM (n=14) bortezomib, or 1μM lactacystin (n=30). Mean ±SD. One-way ANOVA with Dunnett correction.

Comment in

References

    1. Matsuda M, et al. , Species-specific segmentation clock periods are due to differential biochemical reaction speeds. Science, 2020. 369(6510): p. 1450. - PubMed
    1. Rayon T, et al. , Species-specific pace of development is associated with differences in protein stability. Science, 2020. 369(6510): p. eaba7667. - PMC - PubMed
    1. Hoyle NP and Ish-Horowicz D, Transcript processing and export kinetics are rate-limiting steps in expressing vertebrate segmentation clock genes. Proceedings of the National Academy of Sciences, 2013. 110(46): p. E4316–E4324. - PMC - PubMed
    1. Stearns SC, The Evolution of Life History Traits: A Critique of the Theory and a Review of the Data. Annual Review of Ecology and Systematics, 1977. 8(1): p. 145–171.
    1. Ricklefs RE, Embryo development and ageing in birds and mammals. Proceedings. Biological sciences, 2006. 273(1597): p. 2077–2082. - PMC - PubMed

Materials and Methods References

    1. Chal J, et al. , Differentiation of pluripotent stem cells to muscle fiber to model Duchenne muscular dystrophy. Nat Biotechnol, 2015. 33(9): p. 962–9. - PubMed
    1. Chal J, et al. , Recapitulating early development of mouse musculoskeletal precursors of the paraxial mesoderm in vitro. Development, 2018. 145(6). - PubMed
    1. Chal J, et al. , Generation of human muscle fibers and satellite-like cells from human pluripotent stem cells in vitro. Nat Protoc, 2016. 11(10): p. 1833–50. - PubMed
    1. Tomishima M, Neural induction – Dual SMAD inhibition, in StemBook. 2008, Harvard Stem Cell Institute. Copyright: © 2012 Mark Tomishima.: Cambridge (MA). - PubMed
    1. Oceguera-Yanez F, et al. , Engineering the AAVS1 locus for consistent and scalable transgene expression in human iPSCs and their differentiated derivatives. Methods, 2016. 101: p. 43–55. - PubMed

Publication types