. 2023 Jan 4;13(1):173.
doi: 10.1038/s41598-023-27385-x.

Association between different sensory modalities based on concurrent time series data obtained by a collaborative reservoir computing model

Affiliations

Association between different sensory modalities based on concurrent time series data obtained by a collaborative reservoir computing model

Itsuki Kanemura et al. Sci Rep. .

Abstract

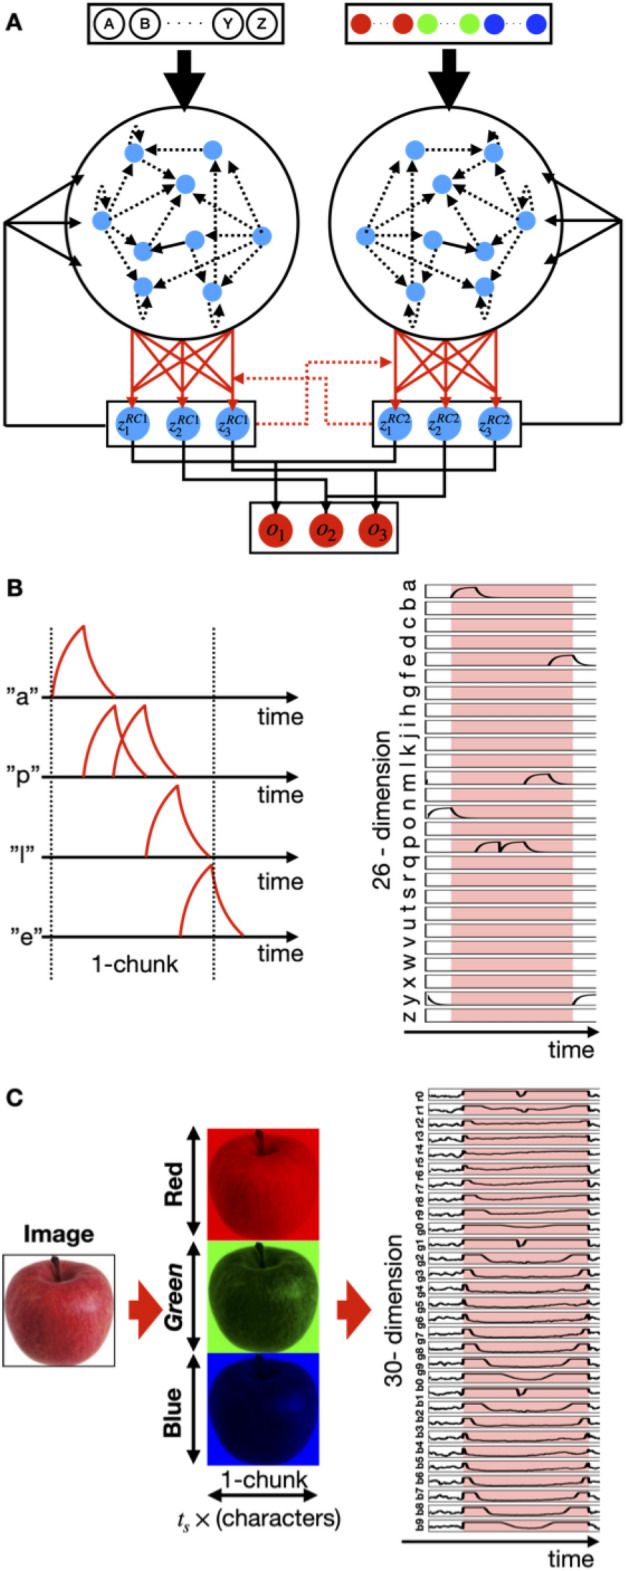
Humans perceive the external world by integrating information from different modalities, obtained through the sensory organs. However, the aforementioned mechanism is still unclear and has been a subject of widespread interest in the fields of psychology and brain science. A model using two reservoir computing systems, i.e., a type of recurrent neural network trained to mimic each other's output, can detect stimulus patterns that repeatedly appear in a time series signal. We applied this model for identifying specific patterns that co-occur between information from different modalities. The model was self-organized by specific fluctuation patterns that co-occurred between different modalities, and could detect each fluctuation pattern. Additionally, similarly to the case where perception is influenced by synchronous/asynchronous presentation of multimodal stimuli, the model failed to work correctly for signals that did not co-occur with corresponding fluctuation patterns. Recent experimental studies have suggested that direct interaction between different sensory systems is important for multisensory integration, in addition to top-down control from higher brain regions such as the association cortex. Because several patterns of interaction between sensory modules can be incorporated into the employed model, we were able to compare the performance between them; the original version of the employed model incorporated such an interaction as the teaching signals for learning. The performance of the original and alternative models was evaluated, and the original model was found to perform the best. Thus, we demonstrated that feedback of the outputs of appropriately learned sensory modules performed the best when compared to the other examined patterns of interaction. The proposed model incorporated information encoded by the dynamic state of the neural population and the interactions between different sensory modules, both of which were based on recent experimental observations; this allowed us to study the influence of the temporal relationship and frequency of occurrence of multisensory signals on sensory integration, as well as the nature of interaction between different sensory signals.


Conflict of interest statement

The authors declare no competing interests.

Figures

Figure 1
Figure 1
Collaborative multimodal reservoir computing model and signals used. (A) In the collaborative multimodal reservoir computing (RC) model, two non-identical reservoirs are activated by different input neurons' activity. The readout weights of each RC system undergo supervised learning with a teaching signal generated by the output of the partner network. Each input neuron of RC receives different modality inputs. In this simulation, we used a text-tone signal and an image signal. (B) Example responses are provided for input neurons to the text-tone modality signal. (C) Example responses are provided for input neurons to the image modality signal. Our demonstration uses three chunks, with each chunk displaying a fruit, namely an apple, grape, and banana.
Figure 2
Figure 2
Learning of multimodal multiple chunks. (A) Left: Three chunks of apple (red), grape (blue), and banana (green) separated by random sequences recur at equal frequencies in the input. Right: These chunks are repeated without random sequence intervals. (B) The activity of the output units upon presenting each chunk while using input signals separated by random sequence intervals. The red, green, and blue shades indicate periods of learned input “apple,” input “banana,” and input “grape,” respectively. (C) The behavior of the output units upon presenting each chunk with input signals not separated by intervals. The red, green, and blue shades indicate periods of learned input “apple,” input “banana,” and input “grape,” respectively.
Figure 3
Figure 3
Evolution of reservoir-readout connections during and after learning. (A1) Time changes of distribution in the weight matrix connecting the reservoir internal unit to the readout unit. On the far right, a distribution of normalized connection magnitudes is shown for comparison with the distribution shapes across the stages of learning. The connections were normalized by the maximum value for each timing (A2). A detailed distribution of reservoir-readout connections is shown before, during, and after learning within the indicated range of Wout. White indicates that only a small portion of connections fall within a given range, whereas black indicates that many connections fall within a given range. (B) Selective decode responses to individual chunks (colored intervals) are self-organized. The input contains random sequences. The responses are gray-scaled according to their selectivity to the chunks. Left: the case where selectivity to a specific chunk by reservoir neuron projecting to readout units was clear. Right: the case where the selectivity was less clear.
Figure 4
Figure 4
The characteristics of the trajectories of reservoir dynamics during stimulus presentation. (A) Results of projecting the activity inside the reservoir computing model for individual chunks (colored intervals) into the space from PC1 to PC3. Responses are self-organized for each chunk. The input contains a random sequence. Responses are color-coded according to their selectivity for chunks. Top: for the RC1 module. Bottom: for the RC2 module. (B) Distances between chunks of low-dimensional trajectories of reservoir dynamics. The distances dXYt were measured with respect to the “apple” trajectory (Y was set to “apple”). The shaded area indicates the deviation σX(t). Because presentation times vary between chunks, the midpoint of the presentation time was set to 0, and the relative time from that point was used to display the data. (C) The degree of separation rXY between trajectories. The left and right sides indicate RC1 and RC2, respectively. The degree was defined in the Methods sections. The smaller the value is, the longer the distance between trajectories. (D1) Change in the cumulative contribution ratio before and during learning. The ratios for RC1 and RC2 are displayed on the left and right sides, respectively. (D2) Changes in the effective dimension trajectories for RC1 and RC2 after an increasing number of learning iterations. See the “Methods” section for the calculation of the effective dimension. PC principal component.
Figure 5
Figure 5
Variations of the model that have direct interactions between sensory modules. (A) Variations of ways of interaction between sensory RC modules. A1: The reservoir neurons in an RC module send connections to those in the other RC module. The connection matrices between the reservoirs Win, inter were determined in the same manner as Win, but the probability of connections p was set to 0.1. A2: The readouts in an RC module feedback to reservoir neurons in the other RC module. The connection matrices of the inter-RC feedback Wback, inter were determined in the same manner as Wback with the same parameters as those for Wback. A3: The readouts in RC1 and RC2 were connected with each other. All-to-all connections determined the connectivity across RC modules. (B) Comparison of the accuracy between the original and alternative models A1 to A3. (C) The accuracy of the readout responses in RC1 (green) and RC2 (orange).
Figure 6
Figure 6
Reactions activated by non-contingent input through replacement and delay. (A) Three chunks of an apple (red), grape (blue), and banana (green) separated by random sequences recur at equal frequencies in the input. In non-co-occurrence signals, these chunks are swapped with a certain probability m. (B) Left: The relationship between non-coincidence m and the accuracy in training signals. Right: The relationship between non-coincidence m and the accuracy in testing signals. (C) Three chunks of an apple (red), grape (blue), and banana (green) separated by random sequences recur at equal frequencies in the input. In non-co-occurrence signals, these chunks are delayed with a certain time d. (D) Left: The relationship between the delay time d and the accuracy in training signals. Right: The relationship between the delay time d and the accuracy in testing signals.

References

    1. McGurk H, MacDonald J. Hearing lips and seeing voices. Nature. 1976;264:746–748. doi: 10.1038/264746a0. - DOI - PubMed
    1. Munhall KG, Gribble P, Sacco L, Ward M. Temporal constraints on the McGurk effect. Percept. Psychophys. 1996;58:351–362. doi: 10.3758/BF03206811. - DOI - PubMed
    1. Stevenson RA, Wallace MT. Multisensory temporal integration: Task and stimulus dependencies. Exp. Brain Res. 2013;227:249–261. doi: 10.1007/s00221-013-3507-3. - DOI - PMC - PubMed
    1. Gu Y, Angelaki DE, DeAngelis GC. Neural correlates of multisensory cue integration in macaque MSTd. Nat. Nerurosci. 2008;11:1201–1210. doi: 10.1038/nn.2191. - DOI - PMC - PubMed
    1. Raposo D, Sheppard JP, Schrater PR, Churchland AK. Multisensory decision-making in rats and humans. J. Neurosci. 2012;32:3726–3735. doi: 10.1523/JNEUROSCI.4998-11.2012. - DOI - PMC - PubMed

Publication types