. 2023 Jan 5;14(1):2.
doi: 10.1186/s13287-022-03232-0.

Neuroblasts migration under control of reactive astrocyte-derived BDNF: a promising therapy in late neurogenesis after traumatic brain injury

Affiliations

Neuroblasts migration under control of reactive astrocyte-derived BDNF: a promising therapy in late neurogenesis after traumatic brain injury

Na Wu et al. Stem Cell Res Ther. .

Abstract

Background: Traumatic brain injury (TBI) is a disease with high mortality and morbidity, which leads to severe neurological dysfunction. Neurogenesis has provided therapeutic options for treating TBI. Brain derived neurotrophic factor (BDNF) plays a key role in neuroblasts migration. We aimed to investigate to the key regulating principle of BDNF in endogenous neuroblasts migration in a mouse TBI model.

Methods: In this study, controlled cortical impact (CCI) mice (C57BL/6J) model was established to mimic TBI. The sham mice served as control. Immunofluorescence staining and enzyme-linked immunosorbent assay were performed on the CCI groups (day 1, 3, 7, 14 and 21 after CCI) and the sham group. All the data were analyzed with Student's t-test or one-way or two-way analysis of variance followed by Tukey's post hoc test.

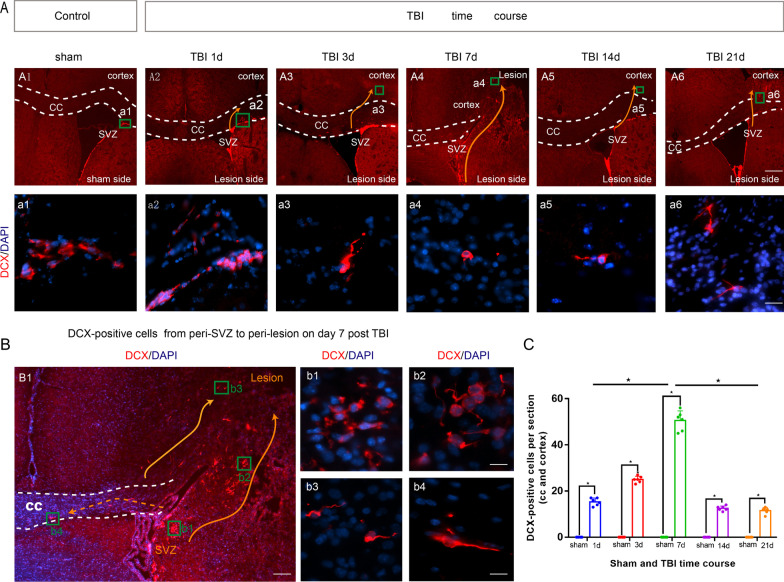
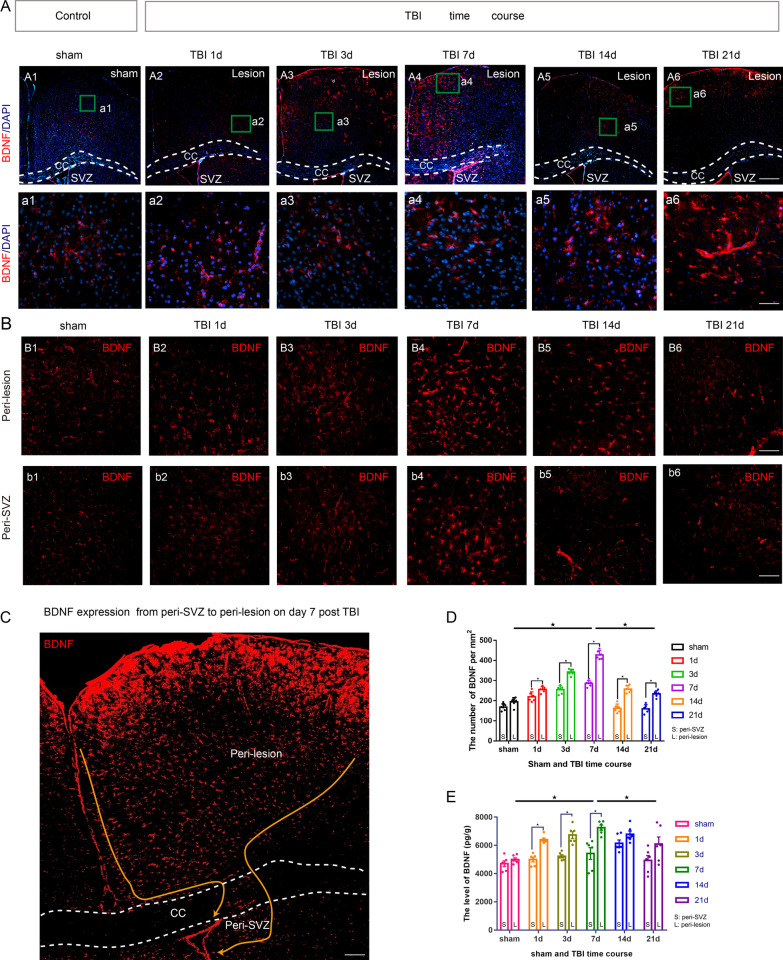
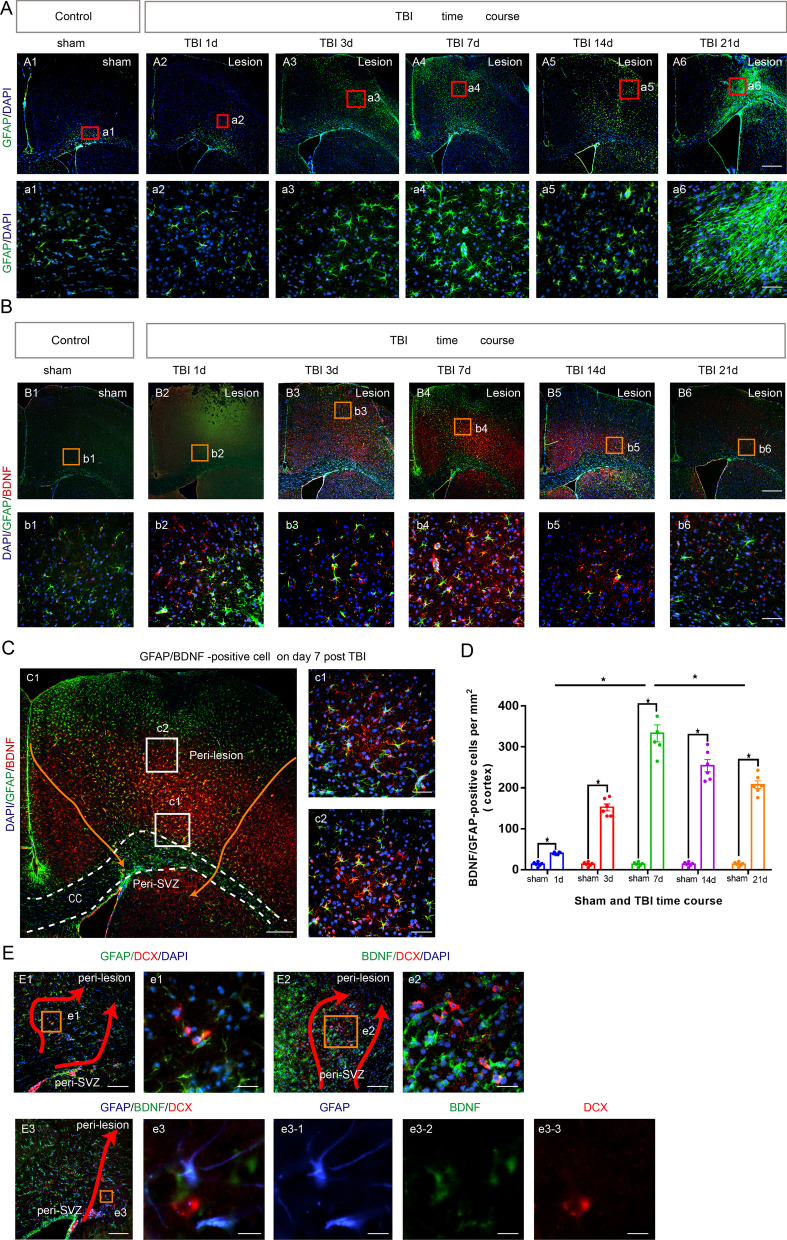
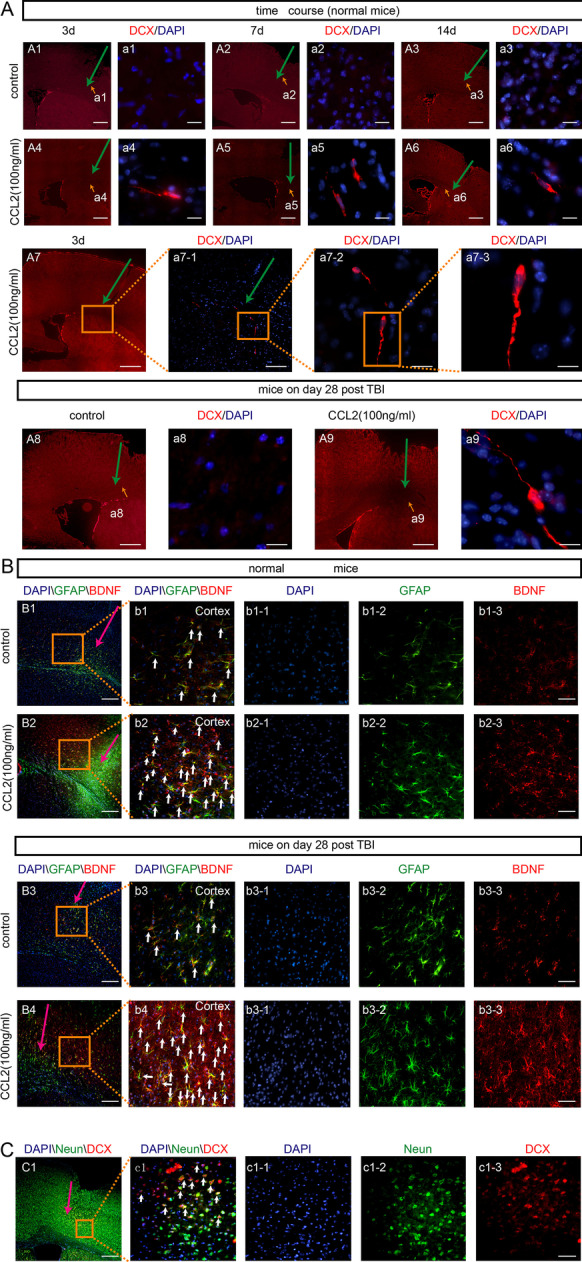
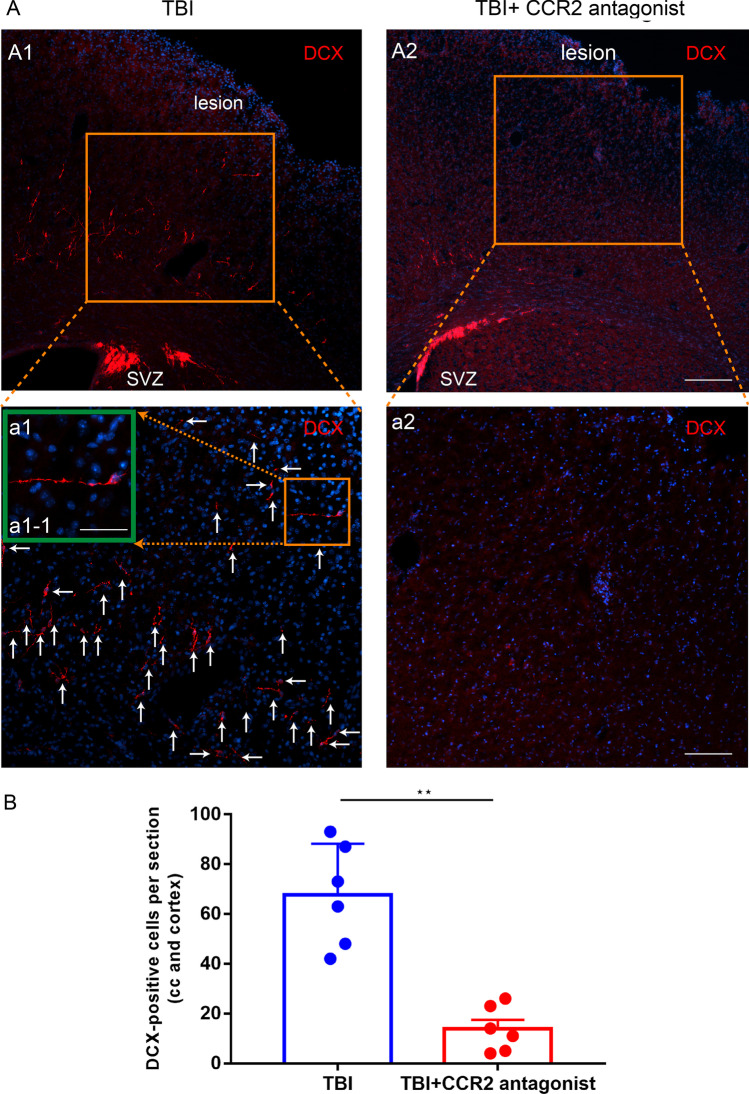
Results: Our results revealed that neuroblasts migration initiated as early as day 1, peaking at day 7, and persisted till day 21. The spatiotemporal profile of BDNF expression was similar to that of neuroblasts migration, and BDNF level following CCI was consistently higher in injured cortex than in subventricular zone (SVZ). Reactive astrocytes account for the major resource of BDNF along the migrating path, localized with neuroblasts in proximity. Moreover, injection of exogenous CC chemokine ligand 2 (CCL2), also known as monocyte chemoattractant protein-1, at random sites promoted neuroblasts migration and astrocytic BDNF expression in both normal and CCI mice (day 28). These provoked neuroblasts can also differentiate into mature neurons. CC chemokine ligand receptor 2 antagonist can restrain the neuroblasts migration after TBI.

Conclusions: Neuroblasts migrated along the activated astrocytic tunnel, directed by BDNF gradient between SVZ and injured cortex after TBI. CCL2 might be a key regulator in the above endogenous neuroblasts migration. Moreover, delayed CCL2 administration may provide a promising therapeutic strategy for late neurogenesis post-trauma.

Keywords: Brain-derived neurotrophic factor; CC chemokine ligand 2; Monocyte chemoattractant protein-1; Neuroblast; Neuronal migration; Traumatic brain injury.


Conflict of interest statement

The authors declare that they have no competing interests.

Figures

Fig. 1
Fig. 1
Spatiotemporal characteristics of neuroblasts migration after TBI. Coronal sections of forebrain were immunostained with anti-DCX antibody (red, neuroblasts) and DAPI (blue, nucleus). The level of neuroblast migration from SVZ into the CC and the perilesional cortex was determined by DCX/DAPI co-staining. A photomicrograph showing the distribution of DCX+ cells in the CCI groups (1, 3, 7, 14 and 21 days after CCI) and the sham group. The DCX-positive cells were found in CC on day 1 post-CCI, and in cortex on day 3, day 14 and day 21 post-CCI. The DCX-positive cells were present in lesion cortex on post-CCI day 7. In the sham group, DCX positive cells were only observed in SVZ. Scale bar = 5 μm (A1A6), Scale bar = 125 μm (a1a6). B Images of DCX+/DAPI+ cells on day 7 post-CCI. DCX positive cells were observed as spherical clusters (b1) or assembled in chains (b2) or individual cells (b3 and b4). Scale bar = 5 μm (B1), Scale bar = 125 μm (b1b4). C The number of migrating cells (DCX+ of DAPI+ cells) in the CC and cortex at different CCI time courses (1, 3, 7, 14 and 21 days after CCI) and sham control. The number of DCX-positive cells increased above the baseline (sham control) level on day 1 and 3 post-CCI and increased significantly above the baseline on day 7 post-CCI (P < 0. 05). The number of DCX-positive cells declined on day 14 and 21 post-CCI, but still above the baseline (sham control) level (P < 0.05). Data are expressed as the mean ± SEM, n = 6 for each time-point. *, P < 0.05; one way ANOVA with Tukey’s multiple comparisons test. CCI: controlled cortical impact; TBI: traumatic brain injury; SVZ: subventricular zone; DAPI: 4,6-Diamidino-2-phenylindole; CC: corpus callosum
Fig. 2
Fig. 2
Spatiotemporal characteristics of BDNF expression after TBI. Coronal sections of forebrain were immunostained with anti-BDNF antibody (red, BDNF-positive cells) and DAPI (blue, nucleus). The levels of BDNF in peri-SVZ and in peri-lesion cortex were determined by BDNF/DAPI co-staining and ELISA analysis. A photomicrograph showing the distribution of BDNF+ cells at different CCI time courses (1, 3, 7, 14 and 21 days after CCI) and sham control. We observed the BDNF-positive cells in the cortex nearby CC increased on day 1 post-CCI, and significantly increased on day 3. There was a peak expression on day 7 post-CCI. The BDNF-positive cells showed a downward trend on day 14 and on day 21 post-CCI. Scale bar = 5 μm (A1A6), Scale bar = 50 μm (a1a6). B photomicrograph showing the distribution of BDNF+ cells in peri-SVZ and peri-lesion at different CCI time courses (1, 3, 7, 14 and 21 days after TBI) and sham control. The number of BDNF-positive cells was significantly larger in peri-lesion area than in peri-SVZ area at different time courses post-CCI. Scale bar = 25 μm. C Images of BDNF+/DAPI+ cells on day 7 post-CCI. D The number of migrating cells (BDNF+/DAPI+ cells) in peri-SVZ and peri-lesion cortex at different CCI time courses (1, 3, 7, 14 and 21 days after CCI) and sham control. The number of BDNF-positive cells increased markedly relative to the baseline (sham control) in peri-lesion area on 7 days post-CCI. The number of BDNF-positive was markedly higher on 7 days than on 21 days post-CCI. E ELISA analysis was applied to measure the concentration of BDNF in peri-SVZ and peri-lesion cortex at different CCI time courses (1, 3, 7, 14 and 21 days after CCI) and sham control. The level of BDNF expression was significantly higher in peri-lesion area than in peri-SVZ area at different time courses post-CCI. Data are expressed as the mean ± SEM, n = 6 for each time-point. *, P < 0.05; two-way ANOVA with Tukey’s multiple comparisons test. CCI: controlled cortical impact; TBI: traumatic brain injury; SVZ: subventricular zone; DAPI: 4,6-Diamidino-2-phenylindole; CC: corpus callosum
Fig. 3
Fig. 3
Spatiotemporal characteristics of reactive astrocytes and reactive astrocyte-derived BDNF after TBI, and close relationship with migrating neuroblasts. Coronal sections of forebrain were immunostained with anti-GFAP antibody (green, reactive astrocytes), anti-BDNF antibody (red or green, BDNF-positive cells) and DAPI (blue, nucleus). A photomicrograph showing the distribution of GFAP + cells at different TBI time courses (1, 3, 7, 14 and 21 days after TBI) and sham control. Scale bar = 5 μm (A1A6), Scale bar = 50 μm (a1a6). B photomicrograph showing the distribution of BDNF+/GFAP + cells at different CCI time courses (1, 3, 7, 14 and 21 days after TBI) and sham control. Scale bar = 5 μm (B1B6), Scale bar = 50 μm (b1b6). C Images of BDNF+/GFAP +/DAPI+ cells on day 7 post-CCI. Scale bar = 5 μm (C1), Scale bar = 50 μm (c1c2). D The number of BDNF+/GFAP+/DAPI+ cells in cortex at different CCI time courses (1, 3, 7, 14 and 21 days after CCI) and sham control. E1, e1 Images of DCX+/GFAP+ cells on day 7 post-CCI showing DCX+ and GFAP immunoreactivity as merged image. Scale bar = 25 μm (E1), Scale bar = 100 μm. (e1). E2, e2 Images of BDNF+/DCX+ cells on day 7 post-CCI showing DCX+ and GFAP immunoreactivity as merged image. Scale bar = 25 μm (E2), Scale bar = 100 μm (e2). E3, e3 Images of BDNF+/DCX+/GFAP+cells on day 7 post-CCI showing BDNF+, DCX+ and GFAP immunoreactivity as merged image. Scale bar = 25 μm (E3), Scale bar = 200 μm (e3, e3-1, e3-2, e3-3). The results revealed that the DCX-positive cells, BDNF-positive cells and GFAP-positive cells were accompanied at different time points post-CCI and showed a peak trend on day 7 post-CCI. Data are expressed as the mean ± SEM, n = 6 for each time-point. *, P < 0.05; one way ANOVA with Tukey’s multiple comparisons test. CCI: controlled cortical impact; TBI: traumatic brain injury; SVZ: subventricular zone; DAPI: 4,6-Diamidino-2-phenylindole; CC: corpus callosum
Fig. 4
Fig. 4
Exogenous CCL2 promoted neuroblasts migration and reactive astrocytes-derived BDNF expression in both normal and TBI mice (day 28). These provoked neuroblasts could differentiate into functional neurons. Coronal sections of forebrain were immunostained with anti-DCX antibody (red, neuroblasts), anti-BDNF antibody (red, BDNF-positive cells), anti-GFAP antibody (green, reactive astrocytes), anti-NeuN antibody (green, neurons) and DAPI (blue, nucleus). Yellow and pink arrows: injection pathway. A1A6, a1a6 Photomicrograph showing the distribution of DCX+ cells at different injection time courses (3, 7 and 14 days after injection) in normal mice with vehicle or CCL2 (100 ng/mL). Scale bar = 5 μm (A1A6), Scale bar = 200 μm (a1a6). A7, a7 Photomicrograph showing the distribution of DCX+ cells at 3 days after injection in normal mice with CCL2 (100 ng/mL). Scale bar = 5 μm (A7), 25 μm (a7-1), 50 μm (a7-2), and 200 μm (a7-3). A9–A10, a9–a10 Photomicrograph showing the distribution of DCX+ cells on day 7 after injection in CCI mice with vehicle or CCL2 (100 ng/mL). Scale bar = 5 μm (A9–A10), 200 μm (a9–a10). B1, b1 Images of BDNF+/GFAP+ cells in cortex of normal mice on day 7 post-injection with vehicle showing GFAP and BDNF immunoreactivity separately or as merged image. Scale bar = 12.5 μm (B1), 50 μm (b1). B2, b2 Images of BDNF+/GFAP+ cells in cortex of normal mice on day 7 post-injection with CCL2 (100 ng/mL) showing GFAP and BDNF immunoreactivity separately or as merged image. Scale bar = 12.5 μm (B2), 50 μm (b2). B3, b3 Images of BDNF+/GFAP+ cells in cortex of CCI 28d mice on day 7 post-injection with vehicle showing GFAP and BDNF immunoreactivity separately or as merged image. Scale bar = 12.5 μm (B3), 50 μm (b3). B4, b4 Images of BDNF+/GFAP+ cells in cortex of CCI 28d mice on day 7 post-injection with CCL2 (100 ng/mL) showing GFAP and BDNF immunoreactivity separately or as merged image. Scale bar = 12.5 μm (B4), 50 μm (b4). C Images of DCX+/NeuN+/DAPI cells in cortex of normal mice on day 14 post-injection with CCL2 (100 ng/mL) showing NeuN and DCX immunoreactivity separately or as merged image. Scale bar = 5 μm (C1), 50 μm (c1). Pink arrow: injection track. CCI: controlled cortical impact; TBI: traumatic brain injury; CC chemokine ligand 2 = CCL2; DAPI: 4,6-Diamidino-2-phenylindole; CC: corpus callosum
Fig. 5
Fig. 5
CCR2 antagonist restrained neuroblasts migration in TBI mice (day 7). Coronal sections of forebrain were immunostained with anti-DCX antibody (red, neuroblasts) and DAPI (blue, nucleus). White arrows: DCX+ cells. A1, a1, a1-1 Photomicrograph showing the distribution of DCX+ cells in the TBI group. The DCX positive cells were found in SVZ, CC and injury cortex in the TBI-CCR2 antagonist group. Scale bar = 12.5 μm (A1), 25 μm (a1), 50 μm (a1-1). A2, a2 Photomicrograph showing the distribution of DCX+ cells in the TBI-CCR2 antagonist group. The DCX positive cells were found only in SVZ and CC in the TBI group. Scale bar = 12.5 μm (A2), 25 μm (a2). B The number of migrating cells (DCX+ cells) in the CC and cortex was significantly smaller in the TBI-CCR2 antagonist group than in the TBI group (P < 0.05). Data are expressed as the mean ± SEM, n = 6 for each time-point. *, P < 0.05; Student’s t-test. CCI: controlled cortical impact; TBI: traumatic brain injury; CC chemokine ligand 2 = CCL2; DAPI: 4,6-Diamidino-2-phenylindole; CC: corpus callosum

References

    1. Xiong Y, Zhang YL, Mahmood A. Investigational agents for treatment of traumatic brain injury. Expert Opin Investig Drugs. 2015;24(6):743–760. doi: 10.1517/13543784. - DOI - PMC - PubMed
    1. Jiang J-Y, et al. Traumatic brain injury in China. Lancet Neurol. 2019;18(3):286–295. doi: 10.1016/s1474-4422(18)30469-1. - DOI - PubMed
    1. Zhou C, et al. Pentraxin 3 contributes to neurogenesis after traumatic brain injury in mice. Neural Regen Res. 2020;15(12):2318–2326. doi: 10.4103/1673-5374.285001. - DOI - PMC - PubMed
    1. Qin Q, et al. Ectoderm-derived frontal bone mesenchymal stem cells promote traumatic brain injury recovery by alleviating neuroinflammation and glutamate excitotoxicity partially via FGF1. Stem Cell Res Ther. 2022;13(1):341. doi: 10.1186/s13287-022-03032-6. - DOI - PMC - PubMed
    1. Chang EH, et al. Traumatic brain injury activation of the adult subventricular zone neurogenic niche. Front Neurosci. 2016;10:332. doi: 10.3389/fnins.2016.00332. - DOI - PMC - PubMed

Publication types