. 2023 Jan 5;42(1):3.
doi: 10.1186/s13046-022-02589-7.

S1PR1/S1PR3-YAP signaling and S1P-ALOX15 signaling contribute to an aggressive behavior in obesity-lymphoma

Affiliations

S1PR1/S1PR3-YAP signaling and S1P-ALOX15 signaling contribute to an aggressive behavior in obesity-lymphoma

Xingtong Wang et al. J Exp Clin Cancer Res. .

Abstract

Background: Excess body weight has been found to associate with an increased risk of lymphomas and some metabolic pathways are currently recognized in lymphomagenesis. Bioactive lipid metabolites such as sphingosine-1-phosphate (S1P) have been proposed to play an important role linking obesity and lymphomas. However, the underlying mechanism(s) of S1P signaling in obesity-lymphomagenesis have not been well addressed.

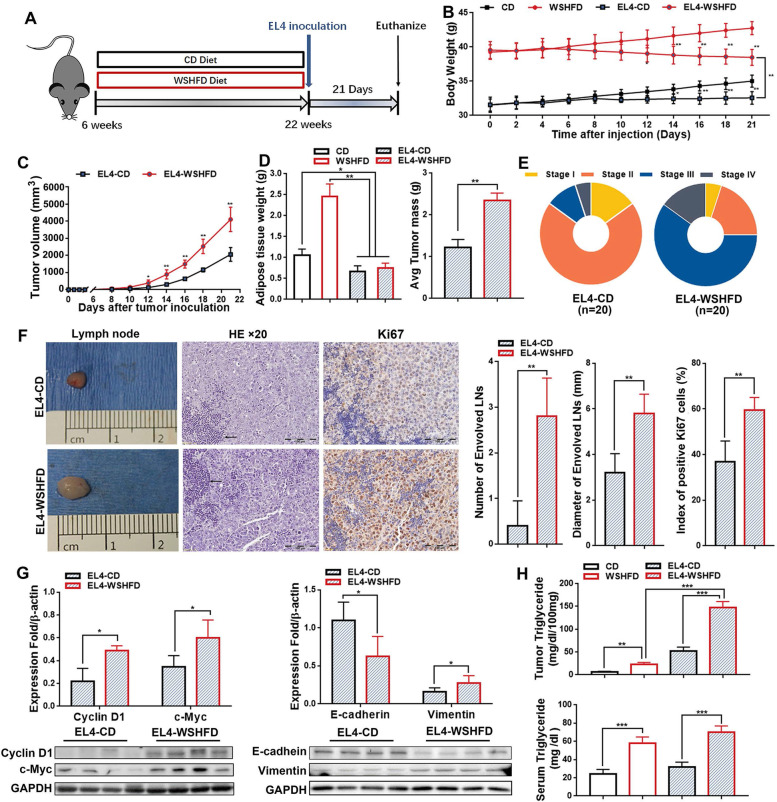
Methods: The gene expression of sphingosine kinase (SPHK), lymphoma prognosis, and S1P production were analyzed using Gene Expression Omnibus (GEO) and human lymphoma tissue array. Obesity-lymphoma mouse models and lymphoma cell lines were used to investigate the S1P/SPHK-YAP axis contributing to obesity-lymphomagenesis. By using the mouse models and a monocyte cell line, S1P-mediated polarization of macrophages in the tumor microenvironment were investigated.

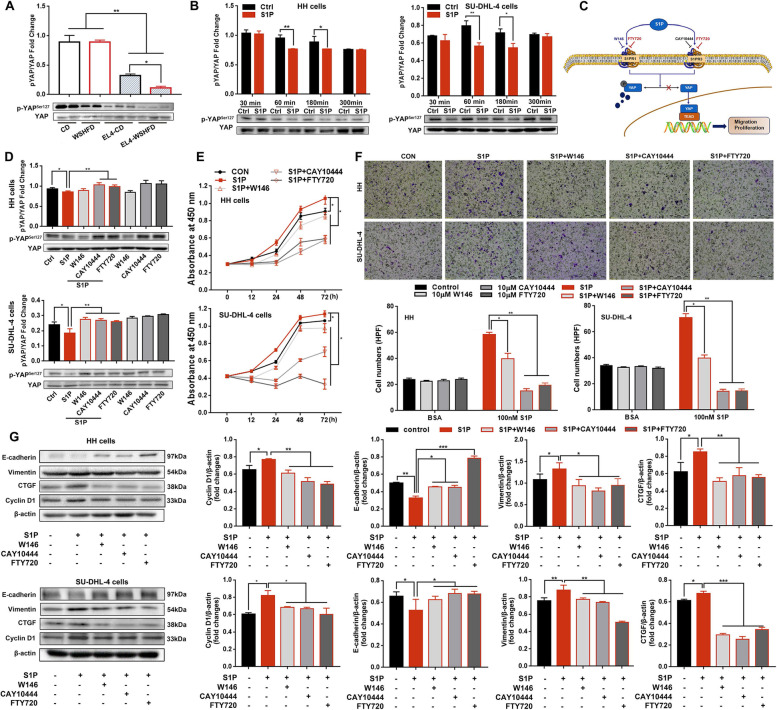
Results: In human study, up-regulated S1P/SPHK1 was found in human lymphomas, while obesity negatively impacted progression-free survival and overall survival in lymphoma patients. In animal study, obesity-lymphoma mice showed an aggressive tumor growth pattern. Both in vivo and in vitro data suggested the existence of S1P-YAP axis in lymphoma cells, while the S1P-ALOX15 signaling mediated macrophage polarization towards TAMs exacerbated the lymphomagenesis. In addition, treatment with resveratrol in obesity-lymphoma mice showed profound effects of anti-lymphomagenesis, via down-regulating S1P-YAP axis and modulating polarization of macrophages.

Conclusion: S1P/S1PR initiated the feedback loops, whereby S1P-S1PR1/S1PR3-YAP signaling mediated lymphomagenesis contributing to tumor aggressive growth, while S1P-ALOX15 signaling mediated TAMs contributing to immunosuppressive microenvironment in obesity-lymphoma. S1P-targeted therapy could be potentially effective and immune-enhancive against obesity-lymphomagenesis.

Keywords: Free fatty acid; Lymphoma; Obesity; S1P/SPHK signaling; Tumor microenvironment.


Conflict of interest statement

The authors declare that they have no competing interests.

Figures

Fig. 1
Fig. 1
S1P/SPHK signaling in human lymphomas and PFS and OS in overweight lymphoma patients. A IHC staining of S1P was performed in the tissue array-samples from various human lymphomas and computer-imaging analysis indicated the S1P expression levels of three subtypes lymphomas, DLBCL, FL and PTCL, in comparison with the normal lymph node samples. B By using Gene Expression Omnibus (GEO) database, SPHK1 expression and SPHK2 expression were analyzed in DLBCL, FL and PTCL patients. C A cohort of 2094 lymphoma patients was recruited and PFS and OS in two groups (BMI ≥ 25 kg/m2 and BMI < 25 kg/m2) were analyzed in DLBCL, FL and PTCL-NOS patients. PFS: progression-free survival; OS; overall survival; DLBCL: Diffuse large B-cell lymphoma; FL: follicular lymphoma; PTCL: peripheral T-cell lymphoma; PTCL-NOS: peripheral T-cell lymphoma-not otherwise specified; CLL/SLL: Chronic lymphocytic leukemia/Small lymphocytic lymphoma; HL: Hodgkin’s Lymphoma; MZL: Marginal zone lymphoma; MCL: Mantle cell lymphoma; CTCL: Cutaneous T-cell lymphoma. *, P < 0.05; **, P < 0.01
Fig. 2
Fig. 2
Tumor growth in obesity-lymphoma mice. A Schematic diagram for establishing obese mouse model by WSHFD and establishing obesity-lymphoma model by EL4 cells subcutaneous xenograft in obese mice. B The body weight change after xenograft in EL4-WSHFD mice and EL4-CD mice, as well as the non-tumor controls. C The changes of tumor volume after lymphoma cell xenograft in EL4-WSHFD mice and EL4-CD mice. D The adipose tissue weight and tumor weight in EL4-WSHFD mice and EL4-CD mice measured at sacrifice. E The lymphoma staging according to Ann Arbor staging classification in EL4-WSHFD mice and EL4-CD mice. F Representative images of gross anatomy of harvested lymph nodes, histology by H&E, and Ki-67 staining by IHC in the tumor tissues from EL4-WSHFD mice and EL4-CD mice. For the histological details in H&E staining, the extensively distributed lymphoma cells were showing at least three to five times the size of the normal lymphocytes (arrow). The lymphoma cells had round nuclear outlines, vesicular chromatin, and single to multiple prominent nucleoli. For the Ki-67 staining, most Ki-67 positive cells are lymphoma cells (brown color). G Western blot analysis for the protein levels of cyclin D1, c-Myc, E-cadherin, and Vimentin in the tumor tissues from EL4-WSHFD mice and EL4-CD mice. H Triglyceride levels in the serum and tumor tissue from EL4-WSHFD mice and EL4-CD mice, as well as the non-tumor controls. *, P < 0.05; **, P < 0.01 ***, P < 0.001
Fig. 3
Fig. 3
Lipid metabolism, S1P synthesis and S1P receptors in obesity-lymphoma mice. A Heat map of the key FFAs metabolic enzymes including FA transport (Slc27a1, Slc27a2 Slc27a3, Slc27a4, and CD36), FA oxidation (Acads, Acadm, Acox1, Cpt1a, and PPAR-α), export (Mttp and Apoa1), esterification (Dgat1 and Acat1) and FA synthesis (FASN, ACC1, ACC2, PPAR-γ and Srebp1) by q-PCR analysis in the tumor tissues from EL4-WSHFD mice and EL4-CD mice, as well as the non-tumor controls. B Heat map of the enzymes for S1P synthesis by q-PCR analysis in the tumor tissues from EL4-WSHFD mice and EL4-CD mice, as well as the non-tumor controls. C Schematic diagram of S1P biosynthetic cascade enzymes for the fold changes of WSHFD-EL4 mice versus CD-EL4 mice. ND, no detection; NC, no change; Red, > 2-fold up-regulated; Blue, < 2-fold down-regulated. D Western blot analysis for the protein levels of SPHK1 and phosphorylated SPHK1 in the tumor tissues from EL4-WSHFD mice and EL4-CD mice. E The levels of S1P production in the tumor tissues from EL4-WSHFD mice and EL4-CD mice. F Western blot analysis for the protein levels of the S1P receptors, S1PR1 and S1PR3. G Representative images of IHC staining for S1PR1 and the computer-imaging analysis of S1P expression levels in the tumor tissues from EL4-WSHFD mice and EL4-CD mice. X20, 200-fold magnification. *, P < 0.05; **, P < 0.01
Fig. 4
Fig. 4
The S1P-S1PR1/S1PR3-YAP signaling. A, B Western blot analysis for the protein levels of phosphorylated YAP in the tumor tissues from mice and in the lymphoma cells treated with S1P. C Schematic diagram of S1P/S1PR1 mediated YAP signals. D Western blot analysis for the protein levels of phosphorylated YAP in the lymphoma cells treated with S1P and inhibitors of S1P receptors. E, F A XTT cell viability assay and a trans-well assay as well as Wester blotting for cell proliferation and migration of the lymphoma cells treated with S1P and inhibitors of S1P receptors. G Western blot analysis for the protein levels of E-cadherin and Vimentin for EMT, CTGF for YAP targeting gene, and cyclin D1 for cell cycle progression in the lymphoma cells treated with S1P and inhibitors of S1P receptors. *, P < 0.05; **, P < 0.01; ***, P < 0.001
Fig. 5
Fig. 5
TAMs and macrophage polarization in obesity-lymphoma mice. A In the tissues of the tumor invaded lymph node from xenograft model of EL4-WSHFD mice and EL4-CD mice, immunofluorescent staining was performed using the antibodies of anti-CD11b and anti-Ly6C as well as the antibodies of anti-CD206 and anti-F4/80 to detect the M-MDSC derived macrophages. Green: positive staining for CD11b or CD206; red: positive staining for Ly6C or F4/80; blue: positive DAPI (4′,6-diamidino-2-phenylindole) staining to detect the nuclei as a counterstain. B Flow Cytometry analysis to detect CD11b+Ly6C+ cells and F4/80+CD206+ cells in the collected PBMC and PMM from peritoneal injection model of EL4-WSHFD mice and EL4-CD mice. C q-PCR analysis of M2 phenotype in the collected PMM from peritoneal injection model of EL4-WSHFD mice and EL4-CD mice. D Schematic diagram of PMA induced M0 phenotype, LPS induced M1 phenotype, and S1P induced M2 phenotype in THP-1 monocytes. E Western blot analysis for the protein levels of arginase-1, TGFβ, and ALOX15 in the PMA induced M0 THP-1 monocytes treated with LPS and/or S1P. HPF: high-power field; PMA: phorbol 12-myristate 13-acetate; PMM: peritoneal monocytes/macrophages. Scale bar = 100 μm. *, p < 0.05; **, p < 0.01
Fig. 6
Fig. 6
S1P-ALOX15 signaling mediated TAMs. A Computer-imaging analysis for the 12/15-LOX positive cells and F4/80 positive cells detected by IHC staining in the tumor tissues from xenograft model of EL4-WSHFD mice and EL4-CD mice. B Representative images of IHC in serial sections from the same paraffin tissue block to detect 12/15-LOX positive cells and F4/80 positive cells from the xenograft model of EL4-WSHFD mice and EL4-CD mice. C Dual immunofluorescent staining using the antibodies of anti-F4/80 and anti-12/15-LOX to confirm the co-localization of 12/15-LOX positive cells and F4/80 positive cells in isolated macrophages from EL4-WSHFD mice in comparison with EL4 cells. D The protein levels of phosphorylated SPHK1 and SPHK1 by Western blot in lymphoma cells (HH and SU-DHL-4) co-cultured with THP-1 cells and the S1P levels by the enzyme-linked immunosorbent assay (ELISA) in the supernatant of co-culture medium. E The mRNA levels of S1P receptor (1–5) by q-PCR in the THP-1 monocytes, M0 phenotype induced by PMA, M1 phenotype induced by LPS, and M1 phenotype induced by S1P. F The mRNA levels of ALOX15 in the THP-1 monocytes treated with LPS, S1P, co-culture medium, and inhibitors of S1P receptors. G The mRNA levels of arginase-1, TGFβ, and PD-L1 in the THP-1 monocytes treated with LPS, S1P, inhibitors of S1P receptors, and inhibitors of ALOX15. H The tumor volume changes after xenograft and tumor mass weight measured at sacrifice in 12/15-LOX−/−-EL4-WSHFD mice and WT-EL4-CD mice. I: Flow Cytometry analysis to detect the subpopulations of F4/80+CD11b+ cells and F4/80+CD206+ cells for potential TAMs in the collected the PMM from the peritoneal injection model of 12/15-LOX−/−-EL4-WSHFD mice and WT-EL4-CD mice. CM: co-culture medium; PMM: peritoneal monocytes/macrophages; HPF: high-power field. Scale bar = 100 μm in IHC staining. Scale bar = 50 μm in dual immunofluorescent staining. *, p < 0.05; **, p < 0.01; ***, p < 0.001
Fig. 7
Fig. 7
Therapy using resveratrol and anti-PD-L1 in obesity-lymphoma mice. A Protein levels of phosphorylated-SPHK1, SPHK1, phosphorylated-YAP, YAP, and CTGF in tumor invaded LN tissues from the xenograft model of resveratrol treated EL4-lymphoma mice and untreated EL4-lymphoma mice, in comparison with the lymph node from the non-lymphoma mice. B Flow Cytometry analysis to detect F4/80+MHCII+ cells and F4/80+CD206+ cells in the collected PMM from peritoneal injection model of resveratrol and IFN-γ treated EL4-lymphoma mice, in comparison with untreated EL4-lymphoma mice and the PBS injection non-tumor controls. C Schematic diagram of resveratrol and anti-PD-L1 treatment in xenograft model of EL4-lymphoma. D Gross anatomy of tumor mass, and tumor volume in 4 groups of the EL4-WSHFD mice. *, P < 0.05; **, P < 0.01. ***, P < 0.001

References

    1. Organization WH. 2022 https://www.who.int/news-room/fact-sheets/detail/obesity-and-overweight#....
    1. Mili N, Paschou SA, Goulis DG, Dimopoulos MA, Lambrinoudaki I, Psaltopoulou T. Obesity, metabolic syndrome, and cancer: pathophysiological and therapeutic associations. Endocrine. 2021;74(3):478–497. doi: 10.1007/s12020-021-02884-x. - DOI - PubMed
    1. Scully T, Ettela A, LeRoith D, Gallagher EJ. Obesity, type 2 diabetes, and Cancer risk. Front Oncol. 2020;10:615375. doi: 10.3389/fonc.2020.615375. - DOI - PMC - PubMed
    1. Lega IC, Lipscombe LL. Review: diabetes, obesity, and Cancer-pathophysiology and clinical implications. Endocr Rev. 2020;41(1). 10.1210/endrev/bnz014. - PubMed
    1. Pearson-Stuttard J, Zhou B, Kontis V, Bentham J, Gunter MJ, Ezzati M. Worldwide burden of cancer attributable to diabetes and high body-mass index: a comparative risk assessment. Lancet Diabetes Endocrinol. 2018;6(6):e6–e15. doi: 10.1016/S2213-8587(18)30150-5. - DOI - PMC - PubMed

Substances