. 2022 Dec;10(12):e005491.
doi: 10.1136/jitc-2022-005491.

TGFβ-derived immune modulatory vaccine: targeting the immunosuppressive and fibrotic tumor microenvironment in a murine model of pancreatic cancer

Affiliations

TGFβ-derived immune modulatory vaccine: targeting the immunosuppressive and fibrotic tumor microenvironment in a murine model of pancreatic cancer

Maria Perez-Penco et al. J Immunother Cancer. 2022 Dec.

Abstract

Background: Pancreatic ductal adenocarcinoma (PDAC) is associated with very poor survival, making it the third and fourth leading cause of all cancer-related deaths in the USA and European Union, respectively. The tumor microenvironment (TME) in PDAC is highly immunosuppressive and desmoplastic, which could explain the limited therapeutic effect of immunotherapy in PDAC. One of the key molecules that contributes to immunosuppression and fibrosis is transforming growth factor-β (TGFβ). The aim of this study was to target the immunosuppressive and fibrotic TME in PDAC using a novel immune modulatory vaccine with TGFβ-derived peptides in a murine model of pancreatic cancer.

Methods: C57BL/6 mice were subcutaneously inoculated with Pan02 PDAC cells. Mice were treated with TGFβ1-derived peptides (major histocompatibility complex (MHC)-I and MHC-II-restricted) adjuvanted with Montanide ISA 51VG. The presence of treatment-induced TGFβ-specific T cells was assessed by ELISpot (enzyme-linked immunospot). Changes in the immune infiltration and gene expression profile in tumor samples were characterized by flow cytometry, reverse transcription-quantitative PCR (RT-qPCR), and bulk RNA sequencing.

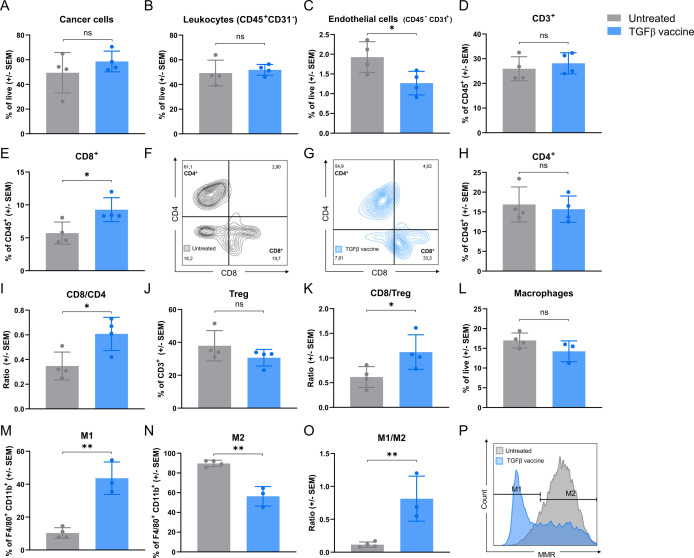
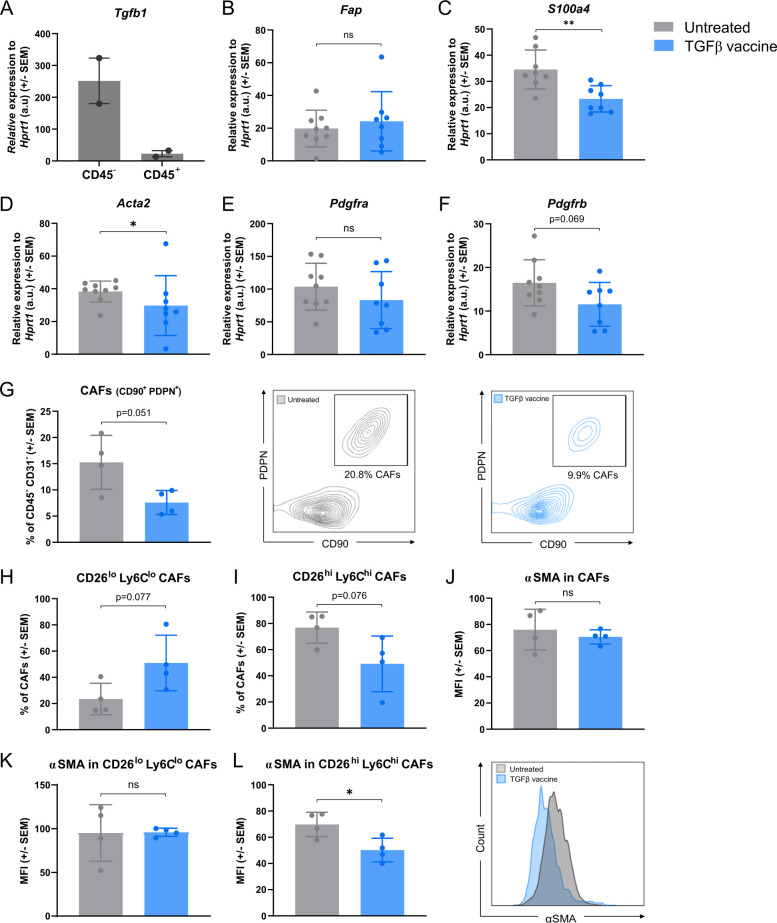
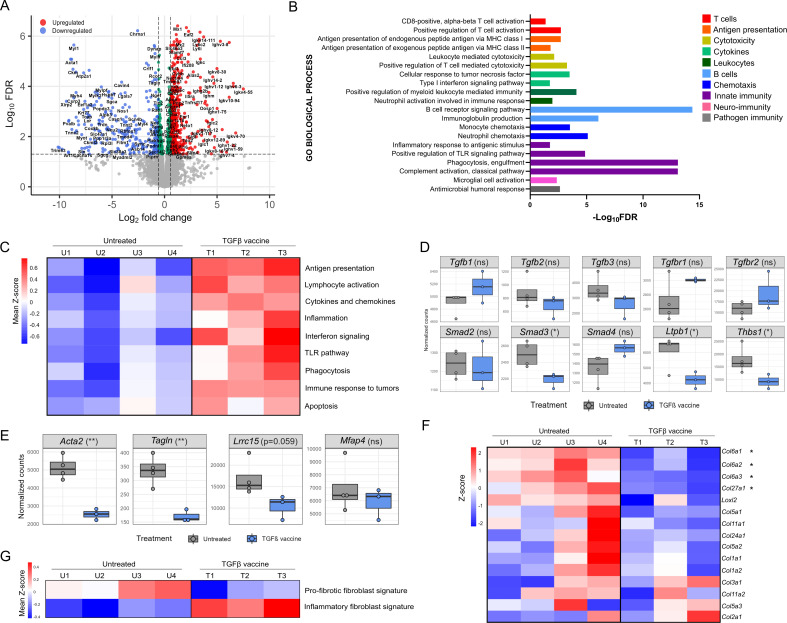
Results: Treatment with immunogenic TGFβ-derived peptides was safe and controlled tumor growth in Pan02 tumor-bearing mice. Enlargement of tumor-draining lymph nodes in vaccinated mice positively correlated to the control of tumor growth. Analysis of immune infiltration and gene expression in Pan02 tumors revealed that TGFβ-derived peptide vaccine increased the infiltration of CD8+ T cells and the intratumoral M1/M2 macrophage ratio, it increased the expression of genes involved in immune activation and immune response to tumors, and it reduced the expression of myofibroblast-like cancer-associated fibroblast (CAF)-related genes and genes encoding fibroblast-derived collagens. Finally, we confirmed that TGFβ-derived peptide vaccine actively modulated the TME, as the ability of T cells to proliferate was restored when exposed to tumor-conditioned media from vaccinated mice compared with media from untreated mice.

Conclusion: This study demonstrates the antitumor activity of TGFβ-derived multipeptide vaccination in a murine tumor model of PDAC. The data suggest that the vaccine targets immunosuppression and fibrosis in the TME by polarizing the cellular composition towards a more pro-inflammatory phenotype. Our findings support the feasibility and potential of TGFβ-derived peptide vaccination as a novel immunotherapeutic approach to target immunosuppression in the TME.

Keywords: Immunogenicity, Vaccine; Immunotherapy; Tumor Microenvironment; Vaccination.


Conflict of interest statement

Competing interests: MHA has made an invention based on the use of transforming growth factor-β-derived peptides for vaccinations. A patent application directed to the invention is owned by the company IO Biotech ApS and lists MHA as the sole inventor. MHA is advisor and shareholder at IO Biotech. IL and EM are employees at IO Biotech. The additional authors declare no competing financial interests.

Figures

Figure 1
Figure 1
Vaccination with TGFβ-derived peptides activates and expands CD8+ and CD4+ TGFβ-specific T cells in vivo. (A) mTGFβ−18–32-specific IFNγ-secreting cells in the spleens of mTGFβ−18–32-vaccinated mice (n=4 mice; left) and representative examples of IFNγ ELISpot responses (right). (B) mTGFβ−4–11, 215–223, 282–289, and 334–342-specific IFNγ-secreting cells in the spleens of mTGFβ−4–11, 215–223, 282–289, and 334–342-vaccinated mice, respectively (n=4 mice per peptide; left) and representative examples of IFNγ ELISpot responses (right). For (A) and (B), mice were vaccinated once, and vaccine-induced responses were assessed 1 week after vaccination. Data are presented as mean±SEM. Dots indicate individual mice. (C) Peptide-specific IFNγ-secreting cells in CD4+ or CD8+ sorted T cells (>93% purity, online supplemental figure 1) from the spleens of mTGFβ−18–32, 4–11, 215–223, 282–289, or 334–342-vaccinated mice, assessed by IFNγ ELISpot. Four mice were vaccinated with all five TGFβ-derived peptides on days 0 and 7. On day 14, mice were sacrificed, spleens harvested and pulled, and CD4+ and CD8+ T cells sorted and set up in an IFNγ ELISpot in co-culture with bone marrow-derived dendritic cells (BMDC) as antigen presenting cells (APC) in a 1:2 ratio (T cell:APC). Bars represent mean±SEM. Dots represent technical replicates. ELISpot, enzyme-linked immunospot; IFN, interferon; MHC, major histocompatibility complex; TGFβ, transforming growth factor-β.
Figure 2
Figure 2
Vaccination with TGFβ-derived peptides delays tumor growth in the Pan02 model of pancreatic cancer. (A) Average Pan02 tumor growth for untreated mice and mice vaccinated with a TGFβ-derived MHC-II-restricted peptide (mTGFβ−18–32, referred to as "CD4 epitoe"), a pool of four 8-9mers predicted to bind MHC-I (mTGFβ−4–11, 215–223, 282–289, and 334–342, referred to as "CD8 epitopes"), or a combination of all five peptides (referred to as ‘TGFβ vaccine’) in a 4-dose regimen. Mice (n=5–8 mice per group) were vaccinated on days 10, 17, 24, and 35, as indicated by the arrows. Data are presented as mean±SEM. (B) Tumor volume at endpoint (day 38) for the tumor study shown in (A). n=5–8 mice per group. Dots represent individual mice. Data are presented as mean±SEM. (C) TGFβ-derived peptide-specific responses in the spleen on day 38 for each treatment group for the tumor study shown in (A) assayed by IFNγ ELISpot. n=5–8 mice per group. Data are presented as mean±SEM. (D) Average Pan02 tumor growth for mice that were either untreated or vaccinated with a TGFβ vaccine consisting of a pool of one TGFβ-derived MHC-II predicted peptide (mTGFβ−18–32) and four MHC-I-restricted peptides (mTGFβ−4–11, 215–223, 282–289, and 334–342) in a 2-dose regimen. Mice (n=7–8 per group) were vaccinated on days 10 and 17, as indicated by the arrows. Data are presented as mean±SEM. Antitumor effect was confirmed in six independent experiments. A representative example is shown. (E) Individual tumor growth for Pan02 tumor-bearing mice shown in (D). n=7–8 mice per group. Curves represent individual mice. Arrows indicate vaccination days. (F) Tumor volume and (G) tumor weight at endpoint (day 35) for the tumor study shown in (D). n=7–8 mice per group. Dots represent individual mice. Data are presented as mean±SEM. (H) Correlation between tumor weight and tumor-draining lymph node (LN) weight at the endpoint in untreated or TGFβ-vaccinated Pan02 tumor-bearing mice. n=10 mice per group. Dots represent individual mice. (I) Correlation between tumor-draining LN weight and the expression of Cd3e relative to the housekeeping gene Hprt1 shown in arbitrary units (a.u.) in the tumor-draining LN at the endpoint in TGFβ-vaccinated Pan02 tumor-bearing mice. n=10 mice per group. Dots represent individual mice. (J) TGFβ vaccine-specific responses in the tumor-draining LN at the endpoint in Pan02 tumor-bearing mice assayed by IFNγ ELISpot. n=6–8 mice per group. Dots represent individual mice. Data are presented as mean±SEM. *p<0.05 and **p<0.01 according to TumGrowth software for (A) and (D); unpaired two-tailed t test for (F),(G) and (J); and linear regression for (H) and (I). ELISpot, enzyme-linked immunospot; IFN, interferon; MHC, major histocompatibility complex; TGFβ, transforming growth factor-β.
Figure 3
Figure 3
Vaccination with TGFβ-derived peptides increases the tumoral-infiltration of CD8+ T cells and polarizes tumor-associated macrophages from an M2-like to an M1-like phenotype. Pan02 tumor-bearing mice (n=8 per group) were either left untreated or vaccinated with the TGFβ vaccine on days 10 and 17. Tumors were harvested on day 33, pooled in pairs among treatment groups, and analyzed by flow cytometry. Bar plots show (A) cancer cells gated as CD45 CD31FAP, (B) leukocytes gated as CD45+CD31, (C) endothelial cells gated as CD45 CD31+, (D) CD3+ T cells gated as CD45+CD3+, (E) CD8+ T cells gated as CD45+CD3+CD8+CD4, (H) CD4+ T cells gated as CD45+CD3+ CD8 CD4+, (I) CD8/CD4 ratio calculated by dividing the percentage of CD8+ T cells among CD3+ cells by the percentage of CD4+ T cells among CD3+ cells, (J) Tregs gated as CD45+CD3+ CD8 CD4+ CD25+ FoxP3+, (K) CD8/Treg ratio calculated by dividing the percentage of CD8+ T cells among CD3+ cells by the percentage of Tregs among CD3+ cells, (L) macrophages gated as CD11b+ F4/80+, (M) M1 macrophages gated as CD11b+ F4/80+ mannose receptor (MR), (N) M2 macrophages gated as CD11b+ F4/80+ MR+ and (O) M1/M2 ratio calculated by dividing the percentage of M1 macrophages by the percentage of M2 macrophages in the tumor of untreated or mice treated with the TGFβ vaccine. All populations were gated on single live cells. Gating strategy can be found in online supplemental figures 8–10. Data are presented as mean±SEM. Dots represent pooled tumors (n=3–4 per group). (F) and (G) Representative dot plots of CD4+ and CD8+ cells in the CD3+ population of (F) untreated or (G) TGFβ vaccine-treated mice. (P) Representative histograms of MR on macrophages in untreated mice or mice treated with the TGFβ vaccine shown in (M) and (N). ns, not significant; *p<0.05 and **p<0.01 according to unpaired two-tailed t test. TGFβ, transforming growth factor-β; Tregs, regulatory T cells.
Figure 4
Figure 4
TGFβ vaccine reduces the percentage of cancer-associated fibroblasts (CAF) and the expression of Acta2 (αSMA), a classic myofibroblast marker, in Pan02 tumors. (A) Tgfb1 expression relative to the housekeeping gene Hprt1 in the CD45+ and CD45- fractions of tumors from untreated Pan02-tumor bearing mice assessed by RT-qPCR at endpoint. Data are presented as mean±SEM. Dots represent individual mice (n=2 per group). (B)–(F) Expression of CAF-related genes: (B) Fap, (C) S1004a, (D) Acta2, (E) Pdgfra and (F) Pdgfrb in tumors from untreated or TGFβ vaccine-treated Pan02 tumor-bearing mice. Mice were either left untreated or vaccinated with the TGFβ vaccine on days 10 and 17 post-inoculation. Tumors were harvested at endpoint (day 29) and gene expression was assessed by RT-qPCR. Gene expression relative to the housekeeping gene Hprt1 is shown. Data are presented as mean±SEM. Dots represent individual mice (n=8–9 per group). (G)–(L) Flow cytometric analysis of the CAF population in tumors from untreated or TGFβ-vaccinated Pan02 tumor-bearing mice. Pan02-inoculated mice (n=8 per group) were either left untreated or vaccinated with the TGFβ vaccine on days 10 and 17. Tumors were harvested at endpoint (day 29), pooled in pairs among treatment groups, and analyzed by flow cytometry. (G, left) Percentage of CAFs, gated as CD90+ PDPN+, cells across treatment groups. (G, middle) and (G, right) Representative contour plots of CD90+ PDPN+ cells in the CD45 CD31 population shown in (G) of (G, middle) untreated or (G, right) TGFβ vaccine-treated mice. (H) and (I) Percentage of (H) CD26lo Ly6Clo and (I) CD26hi Ly6Chi CAF subsets—as previously described—across treatment groups. (J)–(L) Mean fluorescence intensity (MFI) of αSMA (x103) in (J) CAFs, (K) CD26lo Ly6Clo CAFs and (L, left) CD26hi Ly6Chi CAFs. (L, right) Representative histograms of αSMA on CD26hi Ly6Chi CAFs in untreated mice or mice treated with the TGFβ vaccine shown in (L, left). All populations were gated on live cells. Gating strategy can be found in online supplemental figure 11. Data are presented as mean±SEM. Dots represent pooled tumors (n=4 per group). a.u., arbitrary units; ns, not significant; *p<0.05, **p<0.01 according to unpaired two-tailed t test. RT-qPCR, reverse transcription-quantitative PCR; TGFβ, transforming growth factor-β.
Figure 5
Figure 5
TGFβ vaccine promotes changes in intratumoral gene expression associated with the generation of a pro-inflammatory environment, the development of an antitumor immune response and a shift in the phenotype of CAF from fibrotic to inflammatory. Pan02 tumor-bearing mice were either left untreated or vaccinated with the TGFβ vaccine on days 10 and 17. Tumors were harvested (n=4 for untreated, n=3 for TGFβ vaccine) on day 30, RNA extracted, and bulk RNAseq performed. (A) Volcano plot showing differentially expressed genes (false discovery rate (FDR)<0.05 and absolute log2 fold-change>0.585) in Pan02 tumors from TGFβ-vaccinated mice compared with untreated tumors. n=545 upregulated and n=258 downregulated genes. (B) Gene ontology (GO) analysis for immune-related biological processes associated with significantly upregulated genes in Pan02 tumors from TGFβ-vaccinated mice compared with untreated tumors. Representative processes for each category are shown. Remaining processes can be found in online supplemental table 2. (C) Heatmaps illustrating the average gene expression level of a panel of genes related to antigen presentation, lymphocyte activation, cytokines and chemokines, inflammation, interferon signaling, TLR pathway, phagocytosis, immune response to tumors and apoptosis in Pan02 tumors from untreated (U1–U4) or TGFβ-vaccinated mice (T1–T3). Gene lists can be found in online supplemental table 3. All gene lists were obtained from nanoString panels, except for the cytokine and chemokine gene list, which was self-generated. Columns represent individual mice. RNAseq counts were VST-normalized and row mean centered (z-score). Rows represent the mean expression (mean z-score) across all genes in each gene list. (D–E) Box plots showing the expression level assessed by RNAseq and presented as VST-normalized counts of (D) genes encoding ligands, receptors, and molecules involved in TGFβ signaling, assembly, or activation, and (E) myCAF-related genes in Pan02 tumors from untreated or TGFβ-vaccinated mice. Dots represent individual mice. *p<0.05, **p<0.01 according to unpaired two-tailed t test. (F) Heatmap illustrating the gene expression level of a panel of 15 fibroblast-derived collagen genes in Pan02 tumors from untreated (U1–U4) or TGFβ-vaccinated mice (T1–T3). Gene lists were obtained as per a study by Nissen et al and can be found in online supplemental table 3. Rows represent individual genes and columns represent individual mice. RNAseq counts were VST-normalized, log2 transformed, and row mean centered (z-score). *differentially expressed genes identified by DESseq2 (FDR<0.05 and absolute log2 fold-change >0.585). (G) Heatmaps illustrating the average gene expression level of a panel of genes representative of a pro-fibrotic fibroblast phenotype and an inflammatory fibroblast phenotype in Pan02 tumors from untreated (U1–U4) or TGFβ-vaccinated mice (T1–T3). Gene lists were obtained as per a study by Ledoult et al and can be found in online supplemental table 3. Columns represent individual mice. RNAseq counts were VST-normalized and row mean centered (z-score). Rows represent the mean expression (mean z-score) across all genes in each gene list. CAF, cancer-associated fibroblast; MHC, major histocompatibility complex; myCAF, myofibroblastic CAF; RNAseq, RNA sequencing; TGFβ, transforming growth factor-β; TLR, Toll-like receptor.
Figure 6
Figure 6
TGFβ vaccination results in reduced intratumoral secretion of TGFβ and reduces immunosuppression of T cells and macrophages in the tumor microenvironment. Pan02 tumor-bearing mice were either left untreated or vaccinated with the TGFβ vaccine on days 10 and 17. Tumors were harvested (n=4 per group) on day 24 and pooled in pairs among treatment groups. Tumor-conditioned media (TCM) secreted by 0.1×10⁶ cells from the tumor digest during a 48 hours culture was harvested. (A) Quantification of TGFβ1 protein levels in TCM from untreated and TGFβ-vaccinated mice. (B) Effect of TCM from untreated or TGFβ-vaccinated mice on the proliferation of anti-CD3/CD28-stimualted naïve splenocytes from an untreated tumor-free mouse. Naïve splenocytes were CFSE-labeled and activated with Dynabeads Mouse T-Activator CD3/CD28 (1:1 ratio) for 48 hours in the presence or absence of TCM generated from tumors from untreated or TGFβ-vaccinated mice. Proliferation of live CD3+ cells was measured by flow cytometry. Gating strategy can be found in online supplemental figure 12. (B, left) Proliferation index in CD3+ cells across culture conditions. (B, right) Representative histograms of CFSE staining in live CD3+ cells (B). (C–E) Effect of TCM from untreated or TGFβ-vaccinated mice on the phenotype of bone-marrow derived macrophages (BMDM) from an untreated tumor-free mouse that were polarized with IL-4 to an M2-like phenotype. BMDM were cultured for 24 hours in the presence of TCM generated from tumors from untreated or TGFβ-vaccinated mice. The phenotype of BMDM was assessed by flow cytometry. (C, top) M1/M2 ratio in BMDM cultured with TCM generated from tumors from untreated or TGFβ-vaccinated mice. Macrophages were gated as CD11b+ F4/80+, M1 and M2 macrophages were gated as CD11b+ F4/80+ mannose receptor (MR) and CD11b+ F4/80+ MR+, respectively. Gating strategy can be found in online supplemental figure 13. (C, bottom) Representative histograms of MR on macrophages across culture conditions shown in (C, top). (D, top) Mean fluorescence intensity (MFI) of Arg1 macrophages cultured with TCM generated from tumors from untreated or TGFβ-vaccinated mice. (D, bottom) Representative histograms of Arg1 on macrophages across culture conditions shown in (D, top). (E, top) MFI of PD-L1 macrophages cultured with TCM generated from tumors from untreated or TGFβ-vaccinated mice. (E, bottom) Representative histograms of PD-L1 on macrophages across culture conditions shown in (E, top). Bar plots are presented as mean±SD. Dots represent data derived from TCM generated from pooled tumors (n=2 per group). Arg1, arginase-1; IL, interleukin; PD-L1, programmed death-ligand 1; TGFβ, transforming growth factor-β.

References

    1. Hu J-X, Zhao C-F, Chen W-B, et al. . Pancreatic cancer: a review of epidemiology, trend, and risk factors. World J Gastroenterol 2021;27:4298. 10.3748/wjg.v27.i27.4298 - DOI - PMC - PubMed
    1. Dalmartello M, La Vecchia C, Bertuccio P, et al. . European cancer mortality predictions for the year 2022 with focus on ovarian cancer. Ann Oncol 2022;33:330–9. 10.1016/j.annonc.2021.12.007 - DOI - PubMed
    1. Bengtsson A, Andersson R, Ansari D. The actual 5-year survivors of pancreatic ductal adenocarcinoma based on real-world data. Sci Rep 2020;10:1–9. 10.1038/s41598-020-73525-y - DOI - PMC - PubMed
    1. Zeeshan MS, Ramzan Z. Current controversies and advances in the management of pancreatic adenocarcinoma. World J Gastrointest Oncol 2021;13:472–94. 10.4251/wjgo.v13.i6.472 - DOI - PMC - PubMed
    1. Chen IM, Johansen JS, Theile S. Randomized phase II study of nivolumab with or without ipilimumab combined with stereotactic body radiotherapy for refractory metastatic pancreatic cancer (CheckPAC). J Clin Oncol 2022;1. - PubMed

Publication types