. 2022 Dec;10(12):e005088.
doi: 10.1136/jitc-2022-005088.

SP140 inhibits STAT1 signaling, induces IFN-γ in tumor-associated macrophages, and is a predictive biomarker of immunotherapy response

Affiliations

SP140 inhibits STAT1 signaling, induces IFN-γ in tumor-associated macrophages, and is a predictive biomarker of immunotherapy response

Kranthi Kiran Kishore Tanagala et al. J Immunother Cancer. 2022 Dec.

Abstract

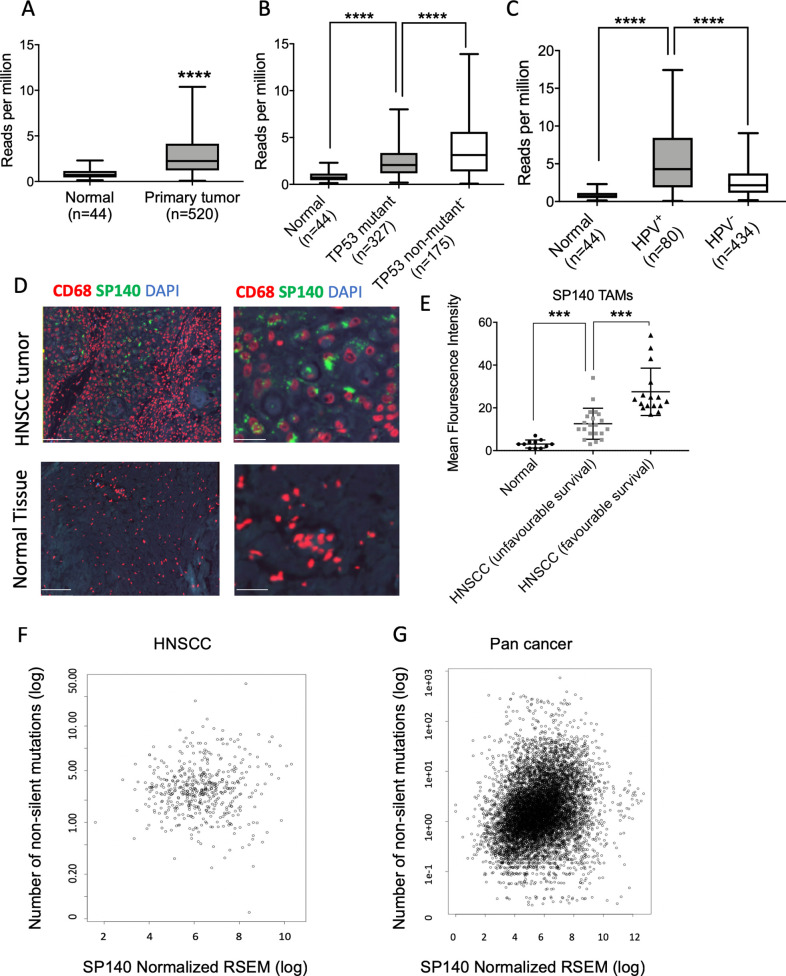
Background: Understanding the role and potential therapeutic targeting of tumor-associated macrophages (TAMs) is crucial to developing new biomarkers and therapeutic strategies for cancer immunotherapies. The epigenetic reader SP140 has emerged as a master regulator of macrophage transcriptional programs; however, its role in the signaling of TAMs and response to immunotherapy has not been investigated.

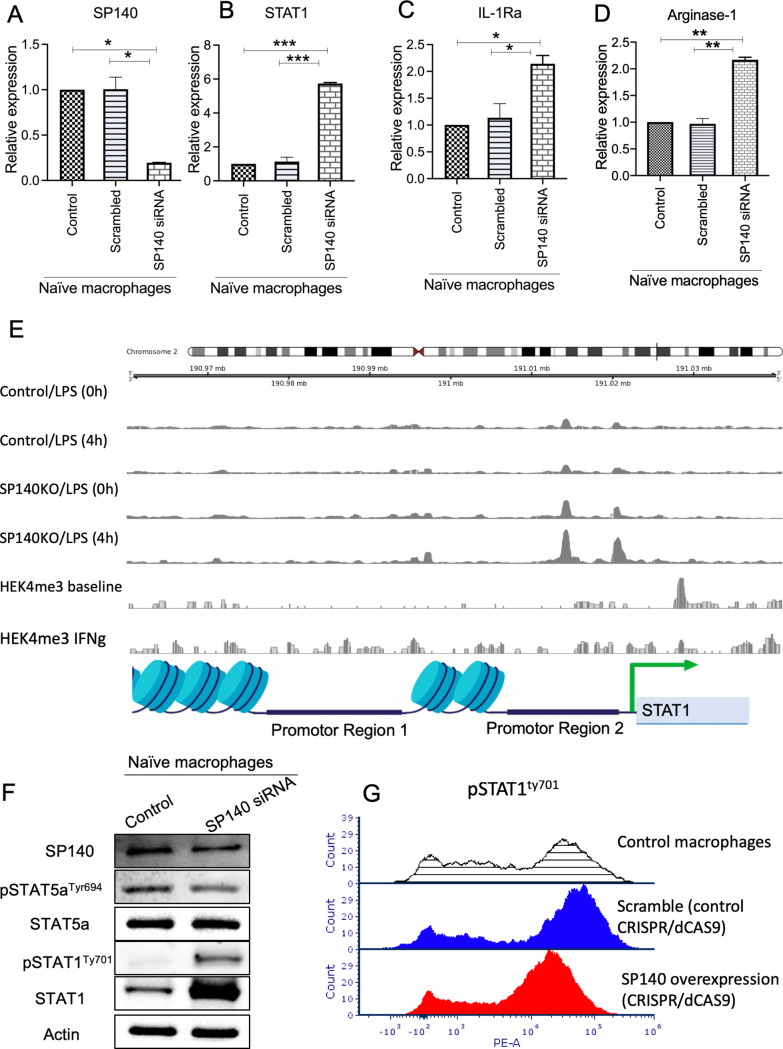
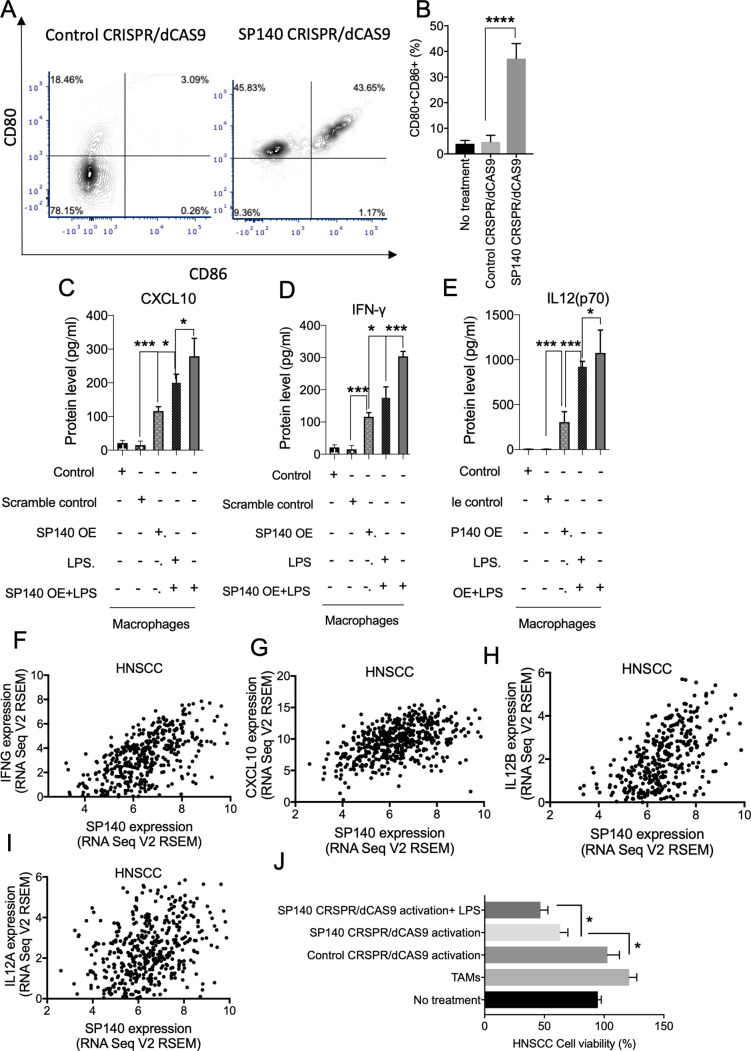
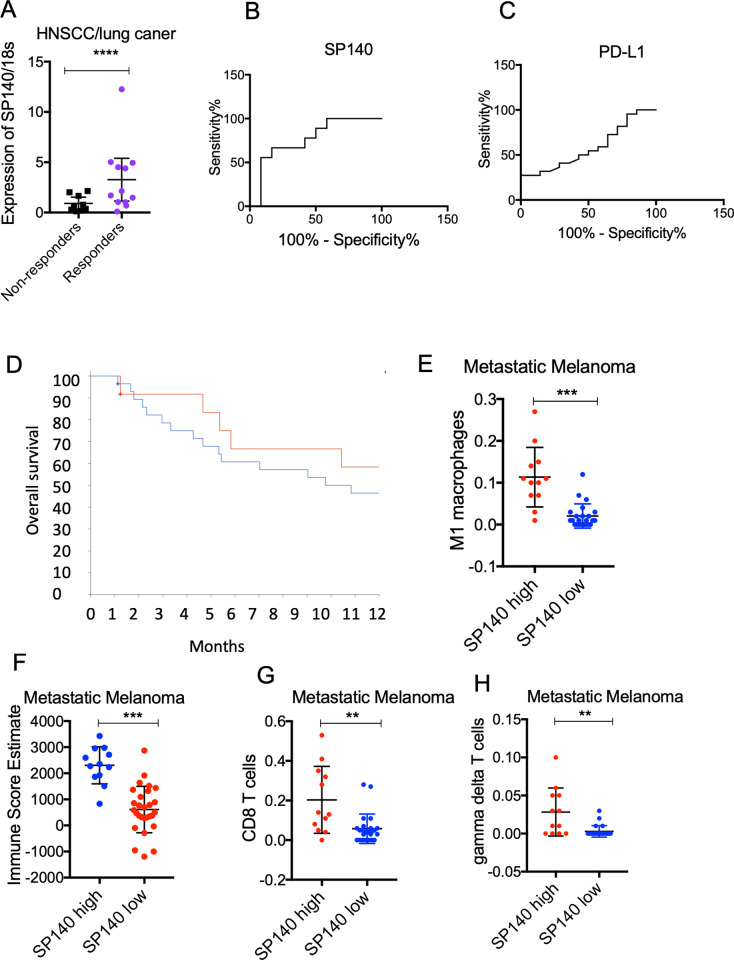
Methods: We evaluated the correlation between SP140 expression in head and neck squamous cell carcinoma (HNSCC) TAMs and clinical outcomes. We also used complementary bioinformatics and experimental approaches to study the association of SP140 expression with tumor mutation burden, patient survival, immunogenic signature of tumors, and signaling of TAMs. SP140 overexpression or knockdown was implemented to identify the role of SP140 in downstream signaling and production of inflammatory cytokine and chemokines. Chromatin immunoprecipitation and analysis of assay of transposase accessible chromatin sequencing data were used to demonstrate the direct binding of SP140 on the promoters of STAT1. Finally, correlation of SP140 with immune cell infiltrates and response to immune-checkpoint blockade in independent cohorts of HNSCC, metastatic melanoma, and melanoma was assessed.

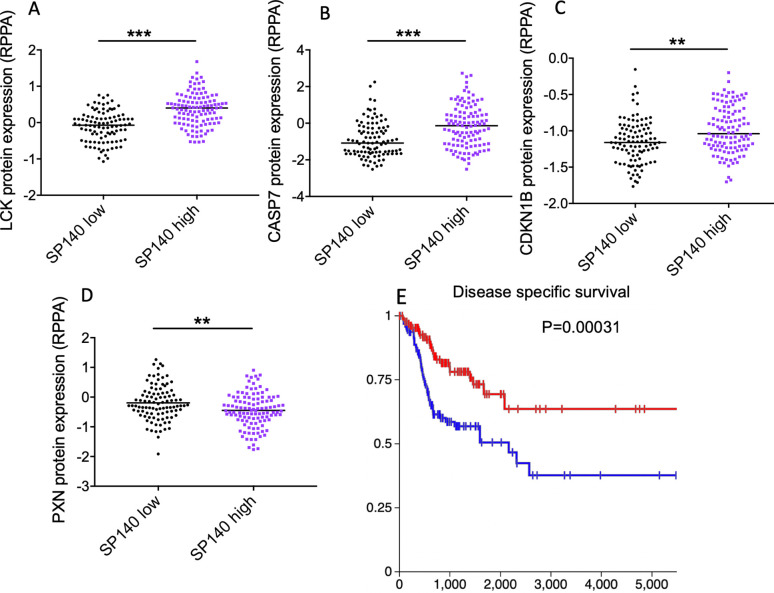
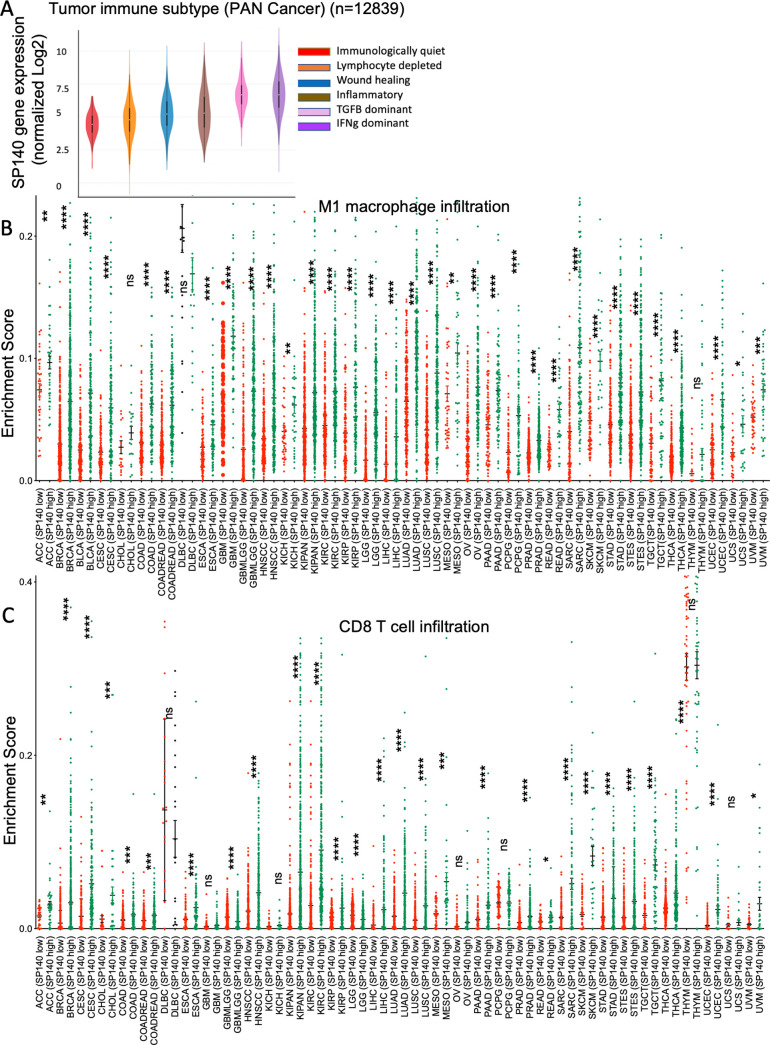
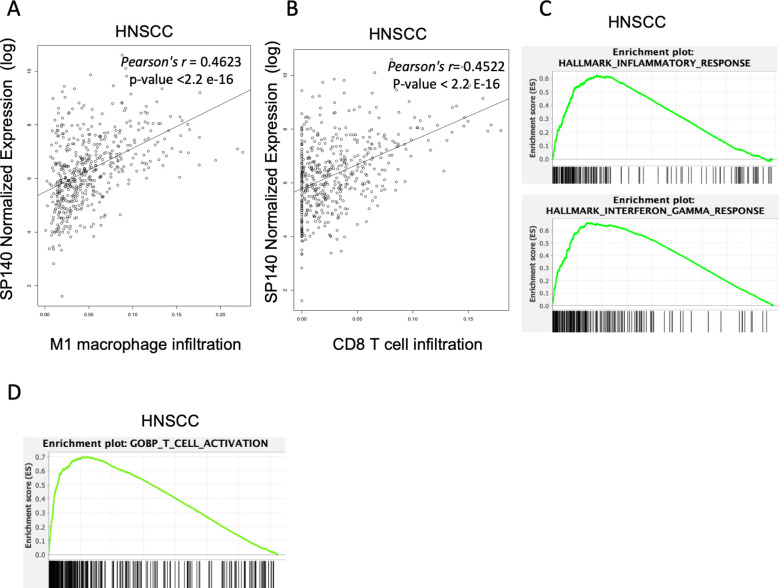
Results: We found that SP140 is highly expressed in TAMs across many cancer types, including HNSCCs. Interestingly, higher expression of SP140 in the tumors was associated with higher tumor mutation burden, improved survival, and a favorable response to immunotherapy. Tumors with high SP140 expression showed enrichment of inflammatory response and interferon-gamma (IFN-γ) pathways in both pan-cancer analysis and HNSCC-specific analysis. Mechanistically, SP140 negatively regulates transcription and phosphorylation of STAT1 and induces IFN-γ signaling. Activating SP140 in macrophages and TAMs induced the proinflammatory macrophage phenotype, increased the antitumor activity of macrophages, and increased the production of IFN-γ and antitumor cytokines and chemokines including interleukin-12 and CXCL10. SP140 expression provided higher sensitivity and specificity to predict antiprogrammed cell death protein 1 immunotherapy response compared with programmed death-ligand 1 in HNSCCs and lung cancer. In metastatic melanoma, higher levels of SP140 were associated with a durable response to immunotherapy, higher immune score estimates, high infiltrations of CD8+ T cells, and inflammatory TAMs.

Conclusions: Our findings suggest that SP140 could serve as both a therapeutic target and a biomarker to identify immunotherapy responders.

Keywords: biomarkers, tumor; head and neck neoplasms; immunotherapy; macrophages.


Conflict of interest statement

Competing interests: None declared.

Figures

Figure 1
Figure 1
SP140 expressed heterogeneously in HNSCCs and its high expression in TAMs is associated with a favorable survival and high tumor mutation burden. (A) SP140 expression in primary HNSCC tumors and normal adjacent tissue in TCGA data (n=520 HNSCC, n=44 normal). (B) SP140 expression versus TP53 mutation status in patient with HNSCC tumors in the TCGA dataset (n=327, TP53 mutant, and n=175, TP53 non-mutant). (C) SP140 expression in primary HPV+ HNSCC tumors, HPV− HNSCC tumors, and normal adjacent tissue in the TCGA data (n=44, normal; n=80, HPV+ HNSC, and n=434, HPV− HNSCC). (D) Representative images of SP140 expression in HNSCC TAMs (CD68+) of normal tissues and HNSCC tumor tissues. (E) Mean fluorescent intensity was calculated in TAMs (CD68+) by quantification of SP140 expression using QuPath software and compared between controls, patients with HNSCC with unfavorable 5-year survival, and patients with HNSCC with favorable 5-year survival. (F) Correlation of SP140 expression and number of non-silent mutations in 497 HNSCCs in the TCGA dataset. (G) Correlation of SP140 expression and number of non-silent mutations in over 9766 cancers in the TCGA dataset. (A–C) Box and whisker plots, with whiskers representing minimum and maximum for the panel. (E) Scatter plot (median and 95% CI). P values (A–C) were calculated by Student’s t-test and corrected for multiple comparison by Bonferroni correction. The correlation between SP140 and mutation burden was quantified with Pearson’s correlation coefficient and corrected for multiple comparison. ***P< 0.001, ****P< 0.0001 after correction for multiple comparisons. The scale bars indicate 100 μm in the left images and 30 μm in the right images. HNSCC, head and neck squamous cell carcinoma; HPV, human papillomavirus; RSEM, RNA-Seq by Expectation-Maximization; SP140, speckled protein 140; TAM, tumor-associated macrophage; TCGA, The Cancer Genome Atlas.
Figure 2
Figure 2
High levels of SP140 in HNSCC tumors are associated with higher expression of proapoptotic markers and favorable survival in HNSCC. (A–D) HNSCC TCGA tumors with available protein expression data (n=212) were divided to two groups of SP140 high and SP140 low based on the median of SP140 expression. The protein levels of LCK, CASP7, CDKN1B, and PXN were compared between the two groups by Student’s t-test, and the p value was calculated after Benjamini-Hochberg correction. (E) Disease-specific survival of patients with high levels of SP140 (n=261) and low levels of SP140 (n=261) in TCGA HNSCC. The p value was calculated based on the log-rank test. **P<0.01, ***P<0.001 after correction for multiple comparisons. HNSCC, head and neck squamous cell carcinoma; RPPA, reverse phase protein array; SP140, speckled protein 140; TCGA, The Cancer Genome Atlas.
Figure 3
Figure 3
High levels of SP140 in the pan-cancer TCGA tumors are associated with IFN-γ-dominant tumors and high infiltration of proinflammatory TAMs (M1) and CD8 T cells. (A) Association of SP140 gene expression with immune infiltrate subtypes in the TCGA pan-cancer cohort (n=12 839). (B, C) TCGA pan-cancer gene expression data were used to dichotomize SP140 expression based on the median. M1 macrophage and T-cell infiltrations were estimated for each cancer type in SP140 high and SP140 low tumors. Data are presented as scatter plots. The statistical significance is annotated by the number of stars. *P<0.05, **P<0.01, ***P<0.001, ****P<0.0001. IFN-γ, interferon gamma; M1, proinflammatory phenotype; SP140, speckled protein 140; TAM, tumor-associated macrophage; TCGA, The Cancer Genome Atlas.
Figure 4
Figure 4
(A, B) Correlation of SP140 expression with M1 macrophage and CD8 T-cell infiltration levels HNSCC (n=497). (C, D) Genes whose expression significantly correlated with SP140 expression were analyzed by GSEA in HNSCC samples (n = 522). The plot shows the top positively enriched pathways, hallmark inflammatory response, IFN-γ response, and T-cell activation. The Y-axis is the GSEA enrichment score. The X-axis is a list of genes ranked by differential expression correlation with SP140, with black bars representing genes in each gene set. GSEA, gene set enrichment analysis; HNSCC, head and neck squamous cell carcinoma; IFN-γ, interferon gamma; M1, proinflammatory phenotype; SP140, speckled protein 140.
Figure 5
Figure 5
SP140 negatively regulates STAT1 transcription and phosphorylation in macrophages. (A–D) SP140 was downregulated using siRNA in naïve (undifferentiated) macrophages, and cells were collected for RNA expression analysis by qPCR for SP140, STAT1, IL-1Ra and arginase-1, after 24 hours. 18S was used as an endogenous normalizer. The delta–delta Ct method was used to identify the relative gene expression. Data are presented as mean and SD of fold change compared with the control. (E) ATAC-seq read coverage (average count over an arbitrary sliding window) of SP140 KO and non-KO macrophages treated with LPS for 4 hours (along with their respective 0-hour controls) and average H3K27me3 ChIP-seq coverage for IFN-γ stimulated and unstimulated macrophages in the neighborhood of the STAT1 gene. (F) SP140 was downregulated using siRNA in naïve (undifferentiated) macrophages, and cells were collected for protein isolation and western blot 48 hours post transfection. (I) Effect of SP140 overexpressed on Levels of pSTAT1Tyr701 was quantified by flow cytometry in controls (shaded line indicates control macrophages; blue line indicates scramble control (CRISPR/dCAS9 control), and red line indicates test sample (SP140 overexpression, CRISPR/dCAS9)) after 48 hours. *P<0.05, **P<0.01, ***P<0.001. ATAC-seq, assay of transposase accessible chromatin sequencing; CHiP, chromatin immunoprecipitation; IFN-γ, interferon gamma; IL, interleukin; qPCR, quantitative PCR; siRNA, small interfering RNA; SP140, speckled protein 140.
Figure 6
Figure 6
Overexpression of SP140 induces the production of inflammatory cytokines and chemokines and reprogram macrophages to induce TAM-mediated tumor cytotoxicity. (A, B) Control CRISPR/dCAS9 (control) or SP140 CRISPR/dCAS9 (SP140 overexpression) was transfected in naïve macrophages, and the expression of CD80 and CD86 was quantified by flow cytometry. (C–E) SP140 CRISPR/dCAS9 (SP140 OE) or scramble control (control CRISPR/dCAS9) were introduced to the naïve macrophages, and a multiplex fluorescence BioLegend assay was used to identify the levels of CXCL10, IFN-γ, and IL-12 (P70) in the supernatant after 48 hours. LPS (100 nM) was administered after 24 hours. (F–I) Correlation of SP140 expression and IFNG, CXCL10, IL-12B, and IL-12A levels in over 500 HNSCCs in the TCGA dataset. (J) Control CRISPR/dCAS9 or SP140 CRISPR/dCAS9 was introduced in TAMs isolated from syngeneic HNSCC tumor and cocultured with murine SCC7 cells. Cell viability after 48 hours of coculture was quantified with a quantitative viability assay kit. Data are presented based on the fold change of non-treated control. *P<0.05, ***P<0.001, ****P<0.0001. HNSCC, head and neck squamous cell carcinoma; IFN-γ, interferon gamma; IL, interleukin; SP140, speckled protein 140; TAM, tumor-associated macrophage; TCGA, The Cancer Genome Atlas.
Figure 7
Figure 7
High expression of SP140 in tumors is associated with a favorable response to immunotherapy. (A) RNA was isolated from pretreatment specimens of HNSCC and lung cancer responders and non-responders to anti-PD-1 immunotherapy. RNA was isolated and levels of SP140 were quantified by RT-qPCR (n=21). 18S was used for normalization. Student’s t-test was used for statistical analysis. (B, C) Receiver operating curves of SP140 and PD-L1 for discriminating responders or non-responder cases. Y-axis represents sensitivity (%) and X-axis represents 100% specificity (%). (D) Patients with metastatic melanoma were dichotomized to high expression and low expression groups based on expression of SP140 (the highest quartile vs the rest). Overall survival of patients with high levels of SP140 (n=12) and low levels of SP140 (n=28) was graphed and analyzed using the Kaplan-Meier estimate. (E, F) Tumors with high expression of SP140 (n=12) versus tumors with low levels of SP140 (n=28) showed higher infiltration of M1 macrophages, CD8 T cells, gamma delta T cells, and overall immune score. The Wilcoxon test was used for statistical analysis, and the p value was corrected for multiple comparisons. **P<0.01, ***P<0.001, ****P<0.0001. HNSCC, head and neck squamous cell carcinoma; M1, proinflammatory phenotype; PD-1, programmed cell death protein 1; PD-L1, programmed death-ligand 1; RT-qPCR, reverse transcription–quantitative PCR; SP140, speckled protein 140.

References

    1. Peltanova B, Raudenska M, Masarik M. Effect of tumor microenvironment on pathogenesis of the head and neck squamous cell carcinoma: a systematic review. Mol Cancer 2019;18:63. 10.1186/s12943-019-0983-5 - DOI - PMC - PubMed
    1. Economopoulou P, Perisanidis C, Giotakis EI, et al. . The emerging role of immunotherapy in head and neck squamous cell carcinoma (HNSCC): anti-tumor immunity and clinical applications. Ann Transl Med 2016;4:173. 10.21037/atm.2016.03.34 - DOI - PMC - PubMed
    1. Jiang X, Wang J, Deng X, et al. . Role of the tumor microenvironment in PD-L1/PD-1-mediated tumor immune escape. Mol Cancer 2019;18:1–17. 10.1186/s12943-018-0928-4 - DOI - PMC - PubMed
    1. Vinogradov S, Warren G, Wei X. Macrophages associated with tumors as potential targets and therapeutic intermediates. Nanomedicine 2014;9:695–707. 10.2217/nnm.14.13 - DOI - PMC - PubMed
    1. Evrard D, Szturz P, Tijeras-Raballand A, et al. . Macrophages in the microenvironment of head and neck cancer: potential targets for cancer therapy. Oral Oncol 2019;88:29–38. 10.1016/j.oraloncology.2018.10.040 - DOI - PubMed

Publication types

MeSH terms