Fracture in clinical studies of tofacitinib in rheumatoid arthritis
- PMID: 36601090
- PMCID: PMC9806361
- DOI: 10.1177/1759720X221142346
Fracture in clinical studies of tofacitinib in rheumatoid arthritis
Abstract
Background: Preclinical data suggest that tofacitinib would protect bone health in patients with rheumatoid arthritis (RA).
Objective: To assess fracture risk in tofacitinib RA clinical trials.
Design: Post hoc analysis.
Methods: We analyzed pooled data of phase I/II/III and long-term extension studies ('P123LTE cohort'), pooled data of placebo-controlled portions of phase III studies (phase III placebo-controlled cohort), and data from ORAL Surveillance [phase IIIb/IV randomized, open-label trial evaluating tofacitinib 5/10 mg twice daily (BID) vs tumor necrosis factor inhibitor (TNFi) in patients ⩾ 50 years with ⩾ 1 additional cardiovascular risk factor].
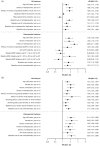
Results: In the phase III placebo-controlled cohort, incidence rates (IRs) [95% confidence interval (CI)] of fracture were 2.11 (1.09-3.68), 2.56 (1.23-4.71), and 4.43 (1.78-9.12) per 100 patient-years (PYs) for tofacitinib 5 mg BID, tofacitinib 10 mg BID, and placebo, respectively [tofacitinib 5 mg BID vs placebo: hazard ratio (HR) (95% CI) = 0.55(0.18-1.65); tofacitinib 10 mg BID vs placebo: HR (95% CI) = 0.72 (0.26-2.01)]. In P123LTE, IRs (95% CI) were 2.62 (2.29-2.99) and 2.26 (2.02-2.52) per 100 PY for average tofacitinib 5 and 10 mg BID, respectively. In ORAL Surveillance, IRs (95% CI) were 2.79 (2.34-3.30), 2.87 (2.40-3.40), and 2.27 (1.87-2.74) per 100 PY for tofacitinib 5 mg BID, tofacitinib 10 mg BID, and TNFi, respectively. In ORAL Surveillance, the risk of fracture was numerically higher than TNFi for tofacitinib 5 mg BID [HR (95% CI) = 1.23 (0.96-1.58)] and tofacitinib 10 mg BID [HR (95% CI) = 1.26 (0.97-1.62)]. In ORAL Surveillance, independent predictors of all and osteoporotic fractures with tofacitinib or TNFi included age ⩾ 65, female sex, history of fracture/osteoporosis, and baseline oral corticosteroid use.
Conclusion: This post hoc analysis showed numerically lower fracture risk with tofacitinib versus placebo and numerically greater risk versus TNFi. We did not identify any tofacitinib-specific predictors of fractures, and predictors of fracture were generally aligned with prior literature in the general population and patients with RA. Patients with fracture risk factors should be adequately monitored and treated.
Clinical trial registration: NCT00960440, NCT00847613, NCT00814307, NCT00856544, NCT00853385, NCT01039688, NCT02187055, NCT02831855, NCT00413699, NCT00147498, NCT00413660, NCT00550446, NCT00603512, NCT00687193, NCT00661661, NCT01164579, NCT00976599, NCT01059864, NCT01359150, NCT01262118, NCT01484561, NCT02281552, NCT02147587, NCT02092467.
Keywords: JAK inhibitor; fracture; osteoporosis; rheumatoid arthritistofacitinib.
© The Author(s), 2022.
Conflict of interest statement
The authors declared the following potential conflicts of interest with respect to the research, authorship, and/or publication of this article: KE Hansen has no conflicts to declare. GA has received fees from Theramex and Galapagos. MR has received fees from Amgen, AbbVie, BMS, Eli Lilly, Galapagos, Novartis, Pfizer, Sandoz, Theramex, and UCB. MM, EN, CW, and ZR are employees and stockholders of Pfizer Inc. CAC was an employee and stockholder of Pfizer Inc. at the time of this analysis. HJL is an employee and shareholder of CorEvitas.
Figures


References
-
- Lee SG, Park YE, Park SH, et al.. Increased frequency of osteoporosis and BMD below the expected range for age among South Korean women with rheumatoid arthritis. Int J Rheum Dis 2012; 15: 289–296. - PubMed
-
- Haugeberg G, Uhlig T, Falch JA, et al.. Bone mineral density and frequency of osteoporosis in female patients with rheumatoid arthritis: results from 394 patients in the Oslo County Rheumatoid Arthritis register. Arthritis Rheum 2000; 43: 522–530. - PubMed
Associated data
LinkOut - more resources
Full Text Sources
Medical

