. 2022 Dec 19:13:1078741.
doi: 10.3389/fimmu.2022.1078741. eCollection 2022.

Macrophages and γδ T cells interplay during SARS-CoV-2 variants infection

Affiliations

Macrophages and γδ T cells interplay during SARS-CoV-2 variants infection

Perla Abou Atmeh et al. Front Immunol. .

Abstract

Introduction: The emergence of several SARS-CoV-2 variants during the COVID pandemic has revealed the impact of variant diversity on viral infectivity and host immune responses. While antibodies and CD8 T cells are essential to clear viral infection, the protective role of innate immunity including macrophages has been recognized. The aims of our study were to compare the infectivity of different SARS-CoV-2 variants in monocyte-derived macrophages (MDM) and to assess their activation profiles and the role of ACE2 (Angiotensin-converting enzyme 2), the main SARS-CoV-2 receptor. We also studied the ability of macrophages infected to affect other immune cells such as γδ2 T cells, another partner of innate immune response to viral infections.

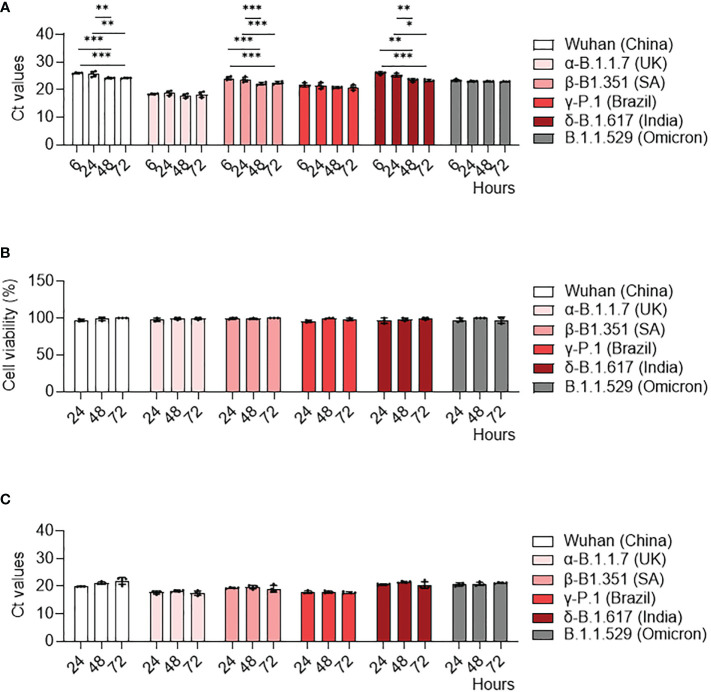
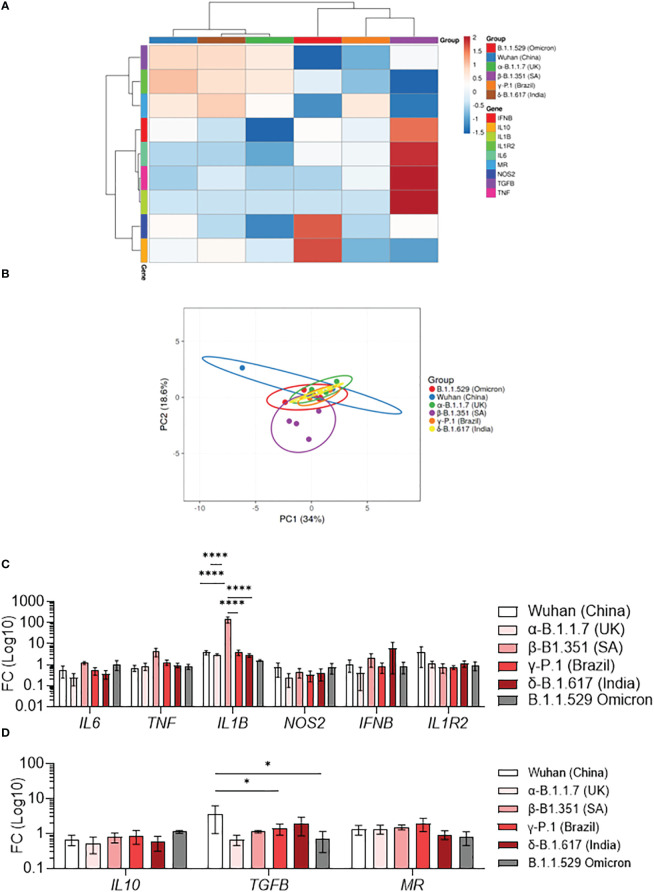
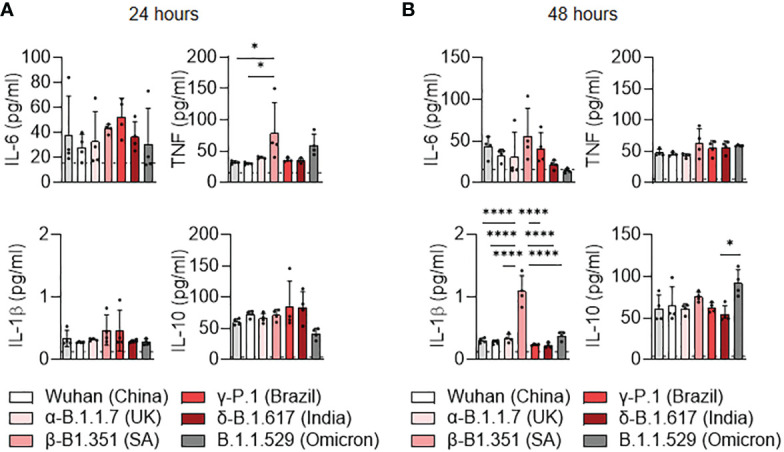
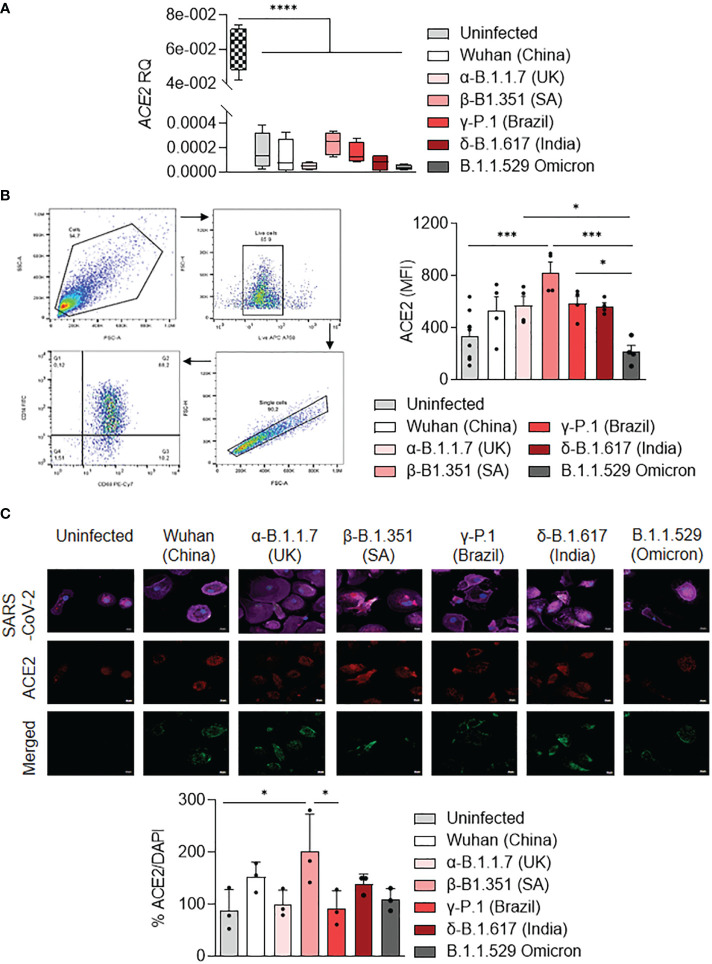
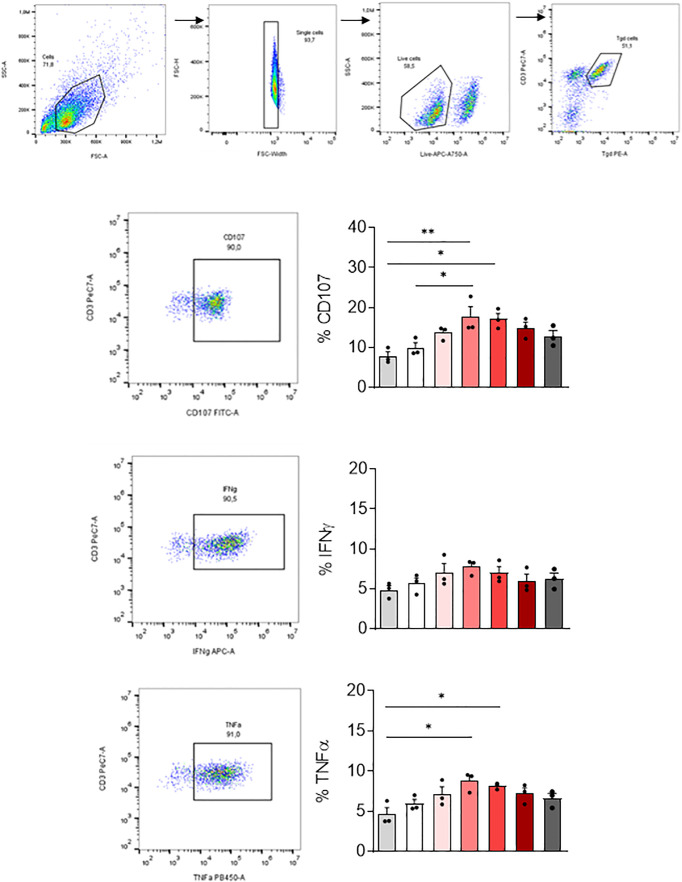
Results: We showed that the SARS-CoV-2 variants α-B.1.1.7 (United Kingdom), β-B.1.351 (South Africa), γ-P.1 (Brazil), δ-B.1.617 (India) and B.1.1.529 (Omicron), infected MDM without replication, the γ-Brazil variant exhibiting increased infectivity for MDM. No clear polarization profile of SARS-CoV-2 variants-infected MDM was observed. The β-B.1.351 (South Africa) variant induced macrophage activation while B.1.1.529 (Omicron) was rather inhibitory. We observed that SARS-CoV-2 variants modulated ACE2 expression in MDM. In particular, the β-B.1.351 (South Africa) variant induced a higher expression of ACE2, related to MDM activation. Finally, all variants were able to activate γδ2 cells among which γ-P.1 (Brazil) and β-B.1.351 (South Africa) variants were the most efficient.

Conclusion: Our data show that SARS-CoV-2 variants can infect MDM and modulate their activation, which was correlated with the ACE2 expression. They also affect γδ2 T cell activation. The macrophage response to SARS-CoV-2 variants was stereotypical.

Keywords: ACE2; COVID-19; SARS-CoV-2 variants; macrophage; γδ T cells.


Conflict of interest statement

The authors declare that the research was conducted in the absence of any commercial or financial relationships that could be construed as a potential conflict of interest.

Figures

Figure 1
Figure 1
MDM infection with SARS-CoV-2 variants. MDM were infected with SARS-CoV-2 variants including Wuhan (China), α-B.1.1.7 (United Kingdom, UK), β-B.1.351 (South Africa, SA), γ-P.1 (Brazil), δ-B.1.617 (India) and B.1.1.529 (Omicron) (0.1 MOI) for 6, 24, 48 and 72 hours. (A) SARS-CoV-2 was quantified in cells as Ct values by RT-PCR. (B) Cell viability was tested at 24, 48 and 72 hours post-infection. (C) SARS-CoV-2 replication was quantified by RT-PCR in cell supernatants and expressed as Ct values. Data values represent the mean ± SD from 4 healthy donors whose experiments were carried out in triplicate. Statistical analysis was performed with two-way ANOVA and Tukey’s multiple comparison test. *p ≤ 0.05, **p ≤0.01 and ***p ≤ 0.001.
Figure 2
Figure 2
Polarization profile of MDM infected with SARS-CoV-2 variants. MDMs were infected with SARS-CoV-2 variants including Wuhan (China), α-B.1.1.7 (United Kingdom, UK), β-B.1.351 (South Africa, SA), γ-P.1 (Brazil), δ-B.1.617 (India) and B.1.1.529 (Omicron) (0.1 MOI). (A–D) The polarization status was investigated by measuring the expression of M1 genes (IL6, TNF, IL1B, NOS2, IFNB, IL1R2) and M2 genes (IL10, TGFB, MR) at 6 hours post-infection. Data are illustrated as (A) hierarchical clustering and (B) principal component analysis obtained using ClustVis webtool. (C, D) Fold change (FC) of (C) M1 genes and (D) M2 genes (Log 10). Data values represent the mean ± SEM from 4 healthy donors whose experiments were carried out in triplicate. Statistical analysis was performed with one-way ANOVA and Tukey’s multiple comparison test. *p ≤ 0.05 and ****p ≤ 0.0001.
Figure 3
Figure 3
Cytokine release of MDM infected with SARS-CoV-2 variants. (A, B) Levels of TNF, IL-6, IL-10 and IL1-β were evaluated in the culture supernatants by ELISA at (A) 24 and (B) 48 hours post-infection. Data values represent the mean ± SEM from 4 healthy donors whose experiments were carried out in triplicate. Statistical analysis was performed with one-way ANOVA and Tukey’s multiple comparison test. *p ≤ 0.05 and ****p ≤ 0.0001.
Figure 4
Figure 4
ACE2 expression by MDM infected with SARS-CoV-2 variants. MDMs were infected with SARS-CoV-2 variants including Wuhan (China), α-B.1.1.7 (United Kingdom, UK), β-B.1.351 (South Africa, SA), γ-P.1 (Brazil), δ-B.1.617 (India) and B.1.1.529 (Omicron) (0.1 MOI). (A) Relative quantity of ACE2 gene was evaluated by q-RTPCR at 6 hours post-infection after normalization with housekeeping ACTB gene as endogenous control. Data values represent the mean ± SD from 4 healthy donors, and the experiments on unstimulated Vero E6 cells were performed in triplicate. (B) ACE2 protein expression was quantified by flow cytometry in MDMs at 24 hours post-infection and expressed as mean fluorescence intensity (MFI) values. (C) ACE2 was evaluated by immunofluorescence in MDMs at 24 hours post-infection. ACE2 was identified in red, SARS-CoV-2 in green, F-actin in purple and DAPI. Relative ACE2 expression was quantified by fluorescence with ImageJ software. Statistical analysis was performed with two-way ANOVA and Tukey’s multiple comparison test. *p ≤ 0.05, ***p ≤ 0.001 and ****p ≤ 0.0001.
Figure 5
Figure 5
γδ2 T cell activation. MDM previously infected 24 hours with SARS-CoV-2 variants including Wuhan (China), α-B.1.1.7 (United Kingdom, UK), β-B.1.351 (South Africa, SA), γ-P.1 (Brazil), δ-B.1.617 (India) and B.1.1.529 (Omicron) (0.1 MOI) were co-cultured with autologous γδ2 T cells (E:T ratio of 1:1). γδ2 T cell degranulation (% CD107ab+ cells) and intracellular TNFα and IFNγ, respectively, were assessed after 4 hours of co-culture in the presence of GolgiStop and analyzed by flow cytometry. Manual gating to identify γδ2 T cell population (CD3+ TCRVδ2+). The percentage of CD107+, IFNγ+ and TNFα+ cells, were then gated in the γδ2 cell population (CD3+ TCRVδ2+). Data values represent the mean ± SD from 3 healthy donors. Statistical analysis was performed with one-way ANOVA and Tukey’s multiple comparison test. *p ≤ 0.05 and **p ≤0.01.

References

    1. Guan W, Ni Z, Hu Y, Liang W, Ou C, He J, et al. Clinical characteristics of coronavirus disease 2019 in China. New Engl J Med (2020) 382:1708–20. doi: 10.1056/NEJMoa2002032 - DOI - PMC - PubMed
    1. Chen N, Zhou M, Dong X, Qu J, Gong F, Han Y, et al. Epidemiological and clinical characteristics of 99 cases of 2019 novel coronavirus pneumonia in wuhan, China: a descriptive study. Lancet (2020) 395:507–13. doi: 10.1016/S0140-6736(20)30211-7 - DOI - PMC - PubMed
    1. Zhou F, Yu T, Du R, Fan G, Liu Y, Liu Z, et al. Clinical course and risk factors for mortality of adult inpatients with COVID-19 in wuhan, China: A retrospective cohort study. Lancet (2020) 395:1054–62. doi: 10.1016/S0140-6736(20)30566-3 - DOI - PMC - PubMed
    1. Wang D, Hu B, Hu C, Zhu F, Liu X, Zhang J, et al. Clinical characteristics of 138 hospitalized patients with 2019 novel coronavirus–infected pneumonia in wuhan, China. JAMA (2020) 323:1061–9. doi: 10.1001/jama.2020.1585 - DOI - PMC - PubMed
    1. Sudre CH, Murray B, Varsavsky T, Graham MS, Penfold RS, Bowyer RC, et al. Attributes and predictors of long COVID. Nat Med (2021) 27:626–31. doi: 10.1038/s41591-021-01292-y - DOI - PMC - PubMed

Substances

Supplementary concepts